Publisher’s version / Version de l'éditeur:
Vous avez des questions? Nous pouvons vous aider. Pour communiquer directement avec un auteur, consultez la
première page de la revue dans laquelle son article a été publié afin de trouver ses coordonnées. Si vous n’arrivez pas à les repérer, communiquez avec nous à [email protected].
Questions? Contact the NRC Publications Archive team at
[email protected]. If you wish to email the authors directly, please see the first page of the publication for their contact information.
https://publications-cnrc.canada.ca/fra/droits
L’accès à ce site Web et l’utilisation de son contenu sont assujettis aux conditions présentées dans le site LISEZ CES CONDITIONS ATTENTIVEMENT AVANT D’UTILISER CE SITE WEB.
Internal Report (National Research Council of Canada. Division of Building Research), 1957-03-01
READ THESE TERMS AND CONDITIONS CAREFULLY BEFORE USING THIS WEBSITE.
https://nrc-publications.canada.ca/eng/copyright
NRC Publications Archive Record / Notice des Archives des publications du CNRC :
https://nrc-publications.canada.ca/eng/view/object/?id=4eeb9903-f90e-42b4-8507-538aaf715a36 https://publications-cnrc.canada.ca/fra/voir/objet/?id=4eeb9903-f90e-42b4-8507-538aaf715a36
NRC Publications Archive
Archives des publications du CNRC
For the publisher’s version, please access the DOI link below./ Pour consulter la version de l’éditeur, utilisez le lien DOI ci-dessous.
https://doi.org/10.4224/20337958
Access and use of this website and the material on it are subject to the Terms and Conditions set forth at Some observations on simply supported circular ice plates loaded at the centre
NATIONAL RESEARCH COUNCIL
CANADA
DIVISION OF BUILDING RESEARCH
SOME OBSERVATIONS ON SIMPLY SUPPORTED
CIRCULAR ICE PLATES LOADED AT THE
CENTRE
by
L. W. Gold
Report No. 117 of the
Division of Building
Research
OTTAWA
PREFACE
There is a great need for a rational method of predicting the strength of ice sheets on lakes and rivers. Aircraft and truck and tractor trains use frozen rivers and lakes in Northern Canada in winter, and pUlpwood logging companies establish log dumps on lakes to which logs are trucked as soon as the ice cover has attained sufficient strength to carry the loads. The study of the strength of ice is one of the major projects of the Snow and Ice Section of this Division.
Studies of full-scale ice sheets are relatively costly and control of even the major factors may be difficult, if not impossible. Most fortunately it has been possible to study in the laboratory many
features of the larger problem by means of model tests such as the one now reported. The value of this approach has already been demonstrated. Further studies involving both model and large-scale tests are in progress.
Ottawa, March, QYUセ
N. B. Hutcheon7
SOME OBSERVATIONS ON SIMPLY SUPPORTED CIRCULAR ICE PLATES LOADED AT THE CENTRE
by
L. W. Gold
Before it became too involved with the various aspects of the problem of the bearing strength of ice, the Snow and Ice Section of the Division of Building Research, National Research Council, thought that it would be profi-table to gain an understanding of the behaviour of ice plates under load. Therefore, a series of observations was undertaken on the deflection of a circular ice plate simply supported at the edges and loaded at the centre. From these observations valuable experience was gained on the elastic behaviour of ice under conditions of short duration loads. It was possible also to obtain a value for the rigidity modulus of ice and a rough estimate of Young's modulus and Poisson's ratio. Finally, the results indicated the usefulness of continuing such studies on the behaviour of ice plates under load, but on a larger scale.
THEORY
Love (1) gives for the deflection of a circular
plate loaded at the centre and simply supported at the edge,
w = P 27TD
a
r (1)
where
w is the deflection at radius r
P is the total load applied at the centre D is the rigidity modulus
セゥウ the Poisson's ratio a is the plate radius
Seely and Smith (2) discuss the conditions under which the assumptions implicit in the derivation of equation(l)are valid. Experiments have ウィッセカョ that this equation is
2
-correct for
Q
ZO.l and the maximum deflection is less athan セ where h is the thickness of the plate. These conditions ensure that any straight line drawn through the plate, normal to the middle surface, before the plate is bent remains reasonably straight and normal to the middle surface after the ーャ。エ・セ bent, and that no direct tensile stresses due to large deflections are developed.
If we let a equal 10 inches in ・アオ。エゥッョHセL it is seen that the last term on the right is of the order of 1 per cent of the second term. Therefore, this term was neglected in applying the theory to the data.
Roark (3), for the deflection w when load is applied uniformly over an area of radius r
O' gives w
=
L
f7r42"*"r802)lnセャ
3+'\I(a2_r2)+1 1-q- 1'02(a2-r2)l
(2) 2111)11
l ' 8 1+c:r 16QKセ
a 2J
for 1'0> 0 and w=...l....
[81 3+ q- a 2 _ r02 Inセ
_ 1'0 2 7+3\OJJ
2TTD QKセ 8 r O 32 1+ セ for l '=
O.In most of the load tests that were made r
O = 0.5inches
l '
=
5
inchesa
=
10 inchesAssuming
u-=
0.3 and considering the terms in equation (2) 1'2 In §;=
4.33'4
l ' r02 In §;=
0.02 0 - r 1 3+\J (a2_r2)=
23.8 8 1+\r 1- - - -
Q⦅セイPR (a2_r2)=
0.01 16 QKセ a 23
-Considering the terms in equation (3)
1 8 3+'1 a 2 = 31 7 • 1+'1
In
= 0.09 r 2--!L
7+3 V-= 0.05 32 1 + 'fTherefore it is evident that all the terms involving r O are less than 1 per cent of the significant terms and were, therefore, neglected in analysing the load test results.
The equations considered valid are, therefore,
w = p
U
r2In
セ-
1SKセ
(a2 - r2)] 27TD r 8 l+q-イセ 0 Wo
-- '2D
pt
18 3+\lャKセ a 2Jr
=
0Wo
セ:;:
_1.
SKセ=
k 21fD P a0:; 8 1+<::J 0 セ Substituting in equation (4) Therefore, ) D=
---...,..--..,r----2 a
r
In
r
a2-r2s rrt
k-kO a2 For r=
5
inches (6)4
-From equation
(5)
r
= _ •
50 k O D + 3 1 + .50 kO DBecause of the sign of w, kO and k5 are negative numbers. From the definition of D
D
=
Eh3
12 (
I-V2 )
where E is Young's modulus(8)
(9)
APPARATUS
A loading frame (Fig. 1) was constructed of steel angle and clamped to a metal-topped rigid bench. The ice plate to be loaded was supported on a steel ring 20 inches in diameter which contained sixteen i-inch screws uniformly spaced around the ring circumference. These could be ad-justed to ensure that the ring had uniform support. Dial gauges with an accuracy of 10-
4
inches per division were mounted on a cross-piece to measure along a diameter of the ice plate the deflections at the centre and at 5 inches on either side. The load was applied to the ice plate over a circular area loaded through a ball by a lever.EXPERIMENTAL PROCEDURE
The ice plate was made artificially in a large tank, cut to a diameter of 20 inches with a band saw, and planed to uniform thickness. It was then placed on the steel ring of the loading frame and preloaded by a small weight to ensure firm contact. The screws on the ring were adjusted until they just conta.cted the ice as indica:ted by the gauges mounted for measuring deflections.
Initial observations had indicated that if a loading cycle was completed in 10 seconds or less, the behaviour of the ice was essentially elastic. A loading procedure was adopted therefore, in which the load was applied, the gauges read, and the load removed, all in approximately 5 seconds. A range of loads was used in which the magnitude was not increased or decreased in a regular way but chosen at random. On completion of the test, the deflection at the centre and the mean of the deflections at r =
5
inches wereS
-plotted against the applied load and the values of k
O and k
S obtained.
DATA
Observations were carried out on three plates whose thicknesses were 0.44 inches, 0.S4 inches and 0.66 inches. More than one series of load cycles was carried out on each plate. The dates on which the tests were made, along with the measured values of k
O and k
s
and the calculated values for D and DkO' are given in Table 1. All tests were made at -9°C.Figure 2 shows a typical set of load deflection curves. In all cases kO and kS were constant over the loading range.
From Table 1 it is seen that the accuracy in the calculation of individual values of D was of the order of + 10 per cent. The source of this error was not so much in the actual measurement of load and resulting deflection as in factors which affected each reading in any given test in such a way as to alter the slope of セィ・ load-deflection curve and thus, k O and kS. Possible sources of this error are non-isotropic behaviour of the plate, the load not being applied exactly in the centre, and deformation of the plate at the ring support due to the compressive stresses existing there. A rough estimate of the edge deformation indicated that it should be less than 2 per cent of the central
deflection. This source of error is largely eliminated in the calculation of D, as it is the differences k S - セ kO' that occur in equation (64
From ・アオ。エゥッョHセ it is seen that
where C is a constant. (10) . Therefore
wo
p
= k O = 1 21TCh3 3+l+T<:Ta2J .
(11) In Figure 3 the logarithm of the average value for kO foreach plate is plotted against the logarithm of h. A line with a slope of
-3
is dravVll through the plotted points. The logarithm of kS is also plotted on the same figure.It is seen that the results for the O.SS-inch and the 0.66-inch plates are consistent with the theory, but the results for
TABLE I
Date h rO kO k5 TI kOTI
inches inches inches/pound inches/pound pound-inches
22/11/ 0.55 0.5 2.12 x 10- 4 1.30 x 10- 4 2.38 x 10 4 5.04
24/111
0.55 0.5 2.14 1.28 2.15 4.6113/12/
PLATE
BROKEDUHING
TEST
Average 2.13 1.29 2.27 4.83 23/11/ 0.66 0.5 1.19 x 10⁻⁴ 0.74 x 10- 4 4.60 x 10 4
5.48
24/11/
0.56 0.5 1.22 0.74 -.:. R'7 4.68 OGセj13/12/
0.56 0.5 1.26 0.80 4.60 5.809/1/
0.66 0.5 1.23 0.76 4.06 5.00 11/1/ 0.66 0.5 1.30 0.83 4.93 6.40 11/1/ 0.66 0.5 1.32 0.81 3.84 5.0611!11
0.66 0.5 1.23 0.77 4.31 5.30 m11/11
0.66 0.5 1.26 0.77 4.06 5.12 Average 1.25 0.78 4.28 5.354/11
0.44 0.5 5.16 x 10- 4 3.09 x 10- 4 0.88 x 10 4 4.56 9/1/ 0.4·4 0.5 5.17 3.05 0.83 4.3011/1/
0.44 0.75 5.13 3.17 1.01 5.20 11/1/ 0.44 0.25 5.28 3.24 0.96 5.06 11/1/ 0.44 1.0 5.56 3.13 1.11 5.56 11/1/ 0.44 0.5 5.18 3.21 1.01 5.26 Average 5.25 3.15 0.97 4.997
-reason for this deviation; it was probably due to the
difficulty of establisl1ing the ーャセエ・ thicbless accurately. In Fig. 4 the average カセャオ・ for D calculated for each plate is plotted against h). From this Figure, C is found to be equal to
1.47
x104
Therefore,
D ::;: 1.47
x105h
3 .From Fig. 3 it is found that
(12 )
k
::;:-o
0.3Lt
hx3104
(13 )Utilising these values for k
O
andD,
kOD ::;:
5.0,
which agrees favourably v,rith the values given in Table I, particularly the over-all average. Substitutinp' this value for kOD in equation (7) gives
セZZ[Z 0.33.
Using this value for Poisson's ratio, and sUbstituting
equation (12) for D in equation (9) and solving for Young's modulus gives
E ::;: 1.57 x 10⁶
ultitィセte STRENGTH OF ICE IN TillJSION
For the radial and tangential stress at the centre of a simply supported plate loaded at the centre, Roark gives
3P
[
]
Sr ::;: St ::;: - 2 h 2 ャKHャKセI In セo Letting T= 0.33 a=
10
inches r O ::;:0.5
inches Sr=
St -- 2.4PhT
Since the stress-deflection curve is linear to failure for ice loaded dynamically, it will be assumed that equation
(15) is valid for the calculation of ultimate strengths.
(14)
8
-Table 2 gives the results of a number of tests on plates which had undergone previous loading tests. The approxi-mate total number of load cycles to which the plate had been subjected before failure occurred is given.
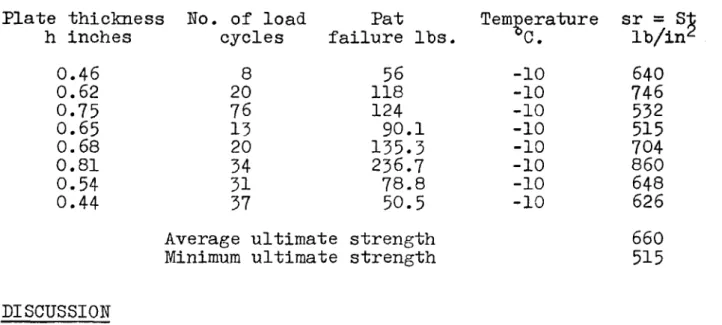
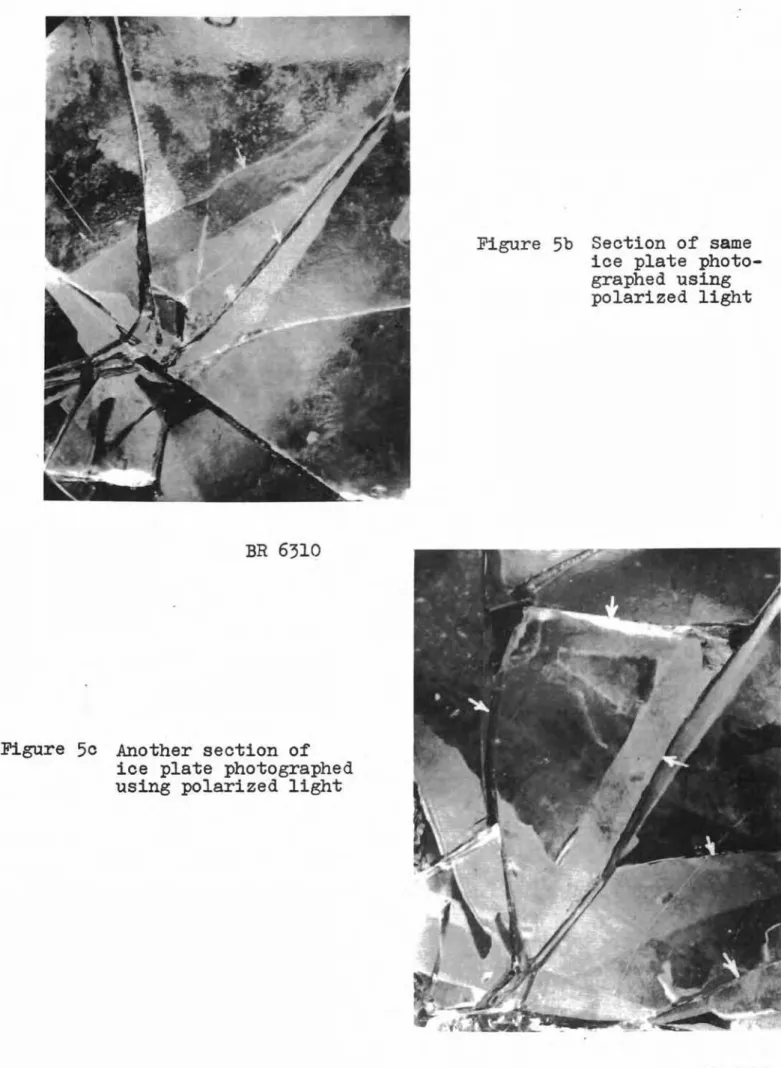
Figure 5a is a photograph of one of the plates after failure. Most of the non-radial fractures occurred when pieces of the plate fell from the loading ring. Figures 5b and c are sections of the same plate photographed with polarized light. Some failures which coincided with grain boundaries are indicated.
TABLE 2
Plate thickness No. of load Pat t・ュセ・イ。エオイ・ sr
=
sセh inches cycles failure Ibs. C. Ib/in
0.46 8 56 -10 640 0.62 20 118 -10 746 0.75 76 124 -10 532 0.65 13 90.1 -10 515 0.68 20 135.3 -10 704 0.81 34 236.7 -10 860 0.54 31 78.8 -10 648 0.44 37 50.5 -10 626
Average ultimate strength 660 Minimum ultimate strength 515
DISCUSSION
One interesting result of these tests was that the values for Young's modulus and the ultimate strength of ice were
significantly larger than the values normally reported in the literature. This is not surprising in the light of the symmetrical stress distribution which exists under the type of loading used. The calculated values for Young's modulus and Poisson's ratio are in good agreement with observea
values which have been obtained in the laboratory for single ice crystals. This tends to confirm the conclusion that when shear stresses exist, there is an additional
contri-bution to the strain which likely arises at the grain boundaries. Though this method of testing does not lend itself to
accurate determinations of Young's modulus and Poisson's ratio on the basis of tests ona single plate, from tests on a number of plates of different thicknesses, the depen-dence of D and k on h3 can be determined and a much hieher accuracy achieveg. The apparatus used in the present tests limits the maximum plate thickness to about 1 inch. The success achieved to date indicates the advantages of re-designing the apparatus so that plates 2 to 3 inches thick can be tested.
9
-The tests to date have been carried out in such a way as to ensure that the ice behaves elastically. Information is now required on the behaviour of ice plates when the load is essentially static. An apparatus capable of loading plates up to 3 inches thick would be very useful for this study.
REFERENCES
1. Love, A.E.H., A treatise on the mathematical theory of elasticity, 4th edition. Cambridge University Press, 1952, 643 p.
2. Seely, F.B. and J.O.Smith, Advanced mechanics of materials, 2nd. edition. Wiley and Sons, New York, 1952, 680 p. 3. Roark, R.J., Formulas for stress and strain, 3rd edition.
BR
6313Figure 1 Photograph of Apparatus
160 140 120 60 80 100 DEFLECTION
x
104 (INCHES) 40 20 00 80 I I I I I " I I I - I 20 I " セ I I I I I I I 100I i i , i , i i i i i i i i i i •ar
60 I I I / ' 1/ I 'c Iセ I I I .J-
a, c«
o
...J 40 I I /1 セ I I I I IFIGURE 2
TYPICAL LOAD-DEFLECTION CURVE FOR
r
=0
AND r=5 INCHES
10·0 9-0 8-0 7·0 4'0 _ 2-5 m ...J ... 3-0 Z
--2
1-0 -9 C Z ·8« .
7-2
-6 -5 ·3 -IS \ \\
\
,
•
SLOPE=-3セ
セ':\
セ'.
...
\
セ X1\
-,
1\
\
X,
LEGEND !1\
-.•
Ko
XK5
-4 -5 -6 -7 '8 -9 1-0 h (INCHES)FIGURE 3
LOGARITHM OF AVERAGE
Ko
a
K5PLOTTED AGAINST THE LOGARITHM
OF
·5
·4
.,
/
/
/
,/r
/0
V
i
o
o
2 6 )C.o
(/)43
;:)o
o
セ セ 3-o
(,!)a::
V '0 -N Z ...セU
-FIGURE 4
RIGIDITY MODULUS D PLOTTED AGAINST
h
3
BR 6312 Figure 5a Photograph of one of the ice
plates after failure
Figure 5b Section of same ice plate photo-graphed using polarized light
BR 6310
Figure 5c Another section of ice plate photographed using polarized light
BR 6311 DBR Internal Report No.117