Autonomous Collision Avoidance
Tradespace Analysis for High-Speed Vessels
The MIT Faculty has made this article openly available. Please share
how this access benefits you. Your story matters.
Citation
Woerner, Kyle L., Michael R. Benjamin."Autonomous Collision
Avoidance Tradespace Analysis for High-Speed Vessels." 13th
International Conference on Fast Sea Transportation, FAST 2015,
Washington, D.C., September 1-4 2015.
As Published
www.sname.org/fast2015
Publisher
Society of Naval Architects and Marine Engineers
Version
Author's final manuscript
Citable link
http://hdl.handle.net/1721.1/117066
Terms of Use
Article is made available in accordance with the publisher's
policy and may be subject to US copyright law. Please refer to the
publisher's site for terms of use.
Autonomous Collision Avoidance Tradespace Analysis
for High-Speed Vessels
In this work, a tradespace was introduced allowing a weighted combination of a course change and speed change when deviating from the preferred velocity vector in protocol-constrained autonomous collision avoidance algorithms. A novel iterative geometry testing technique was introduced and key evaluation metrics were studied including the introduction of a protocol-compliance metric for collision avoidance scenarios. The performance metric results differed for high-speed vessels indicating a need for parameter tuning specific to high-speed vessels before applying collision avoidance algorithms tested on slower vessels.
Kyle L. Woerner1,2 (SM), Michael R. Benjamin1 (V)
1. Massachusetts Institute of Technology, Computer Science and Artificial Intelligence Laboratory, Cambridge, MA 02139 2. United States Navy, Washington, D.C. (views are solely of the authors and do not represent those of the US Navy)
KEY WORDS
Autonomous collision avoidance; high-speed vessels; COLREGS; multi-objective optimization; utility function design; iterative geometry testing; protocol compliance
INTRODUCTION
The field of marine autonomy continues to grow quickly both in literature and practice. Academic, military, and commercial applications are seeing increasingly complex involvement of autonomous decision making as well as autonomous assistance to remote operators. While advances have been made in the application of proven collision avoidance techniques to the autonomous decision space, this paper identifies several areas to further inform autonomous collision avoidance algorithms for under-actuated vehicles including high-speed marine craft in both protocol and unconstrained encounters. This paper introduces three contributions to the field of autonomous collision avoidance. First, the
consideration of iterative geometric testing that forces
simultaneous combinations of differing protocol rules; second, the introduction of the patience parameter; and third, a recommended set of metrics for analyzing the autonomous collision avoidance design tradespace. This iterative geometric testing methodology for autonomous collision avoidance algorithms applies to both simulations and on-water testing. Iterative geometric testing demonstrates that results of collision avoidance algorithms for high-speed vessels differs from the results of the same algorithm for slower speed vehicles, especially as it applies to complex, multi-vehicle, multi-rule encounters within the constraint of protocol-based rules such as COLREGS (USCG). The patience parameter allows greater tradespace between slowing and altering course over the current literature and is applicable to both general mission planning and collision avoidance routines. The patience parameter and recommended metrics of analysis allow autonomous collision avoidance to more closely resemble manned vessel collision avoidance reasoning and assessment.
RECENT LITERATURE AND MOTIVATION
The traditional algorithm for determination of collision risk in autonomous vehicle literature is the velocity obstacle, which was first introduced by Fiorini. Alternative algorithms include direct calculation of the closest point of approach (CPA) (Benjamin; Choi), Voronoi diagrams (Lekkas), and potential force (Zeghal) among others.
Comprehensive reviews (Campbell; Tam) of recent advances in autonomous collision avoidance algorithms demonstrate the growth and variety in the field. Alternatives to the traditional velocity obstacle include the Generalized Velocity Obstacle, Reciprocal and Generalized Reciprocal Velocity Obstacle (van den Berg), and the Hybrid Reciprocal Velocity Obstacle (Snape).
While the family of velocity obstacles is computationally inexpensive, the algorithms result in a simple “safe/unsafe” decision based on a priori determined collision distance and candidate velocity vector. Only determining if a maneuver is “safe/unsafe” rather than obtaining an explicit numeric value limits reasoning about a candidate velocity vector’s
quantifiable level of “goodness” with respect to collision avoidance.
Experimentation has occurred in simulation and on-water environments using velocity obstacles. The state-of-the-art for protocol-based autonomous marine vehicle on-water experimentation is Kuwata (2014). Kuwata et al. showed that a velocity obstacle based autonomous collision avoidance algorithm could use organic sensors to reason about a real-time contact picture and select a protocol-appropriate maneuver without human guidance in limited on-water testing scenarios and geometric configurations.
The velocity obstacle provides a transformation from the absolute space to a relative velocity geometric space. Since the development of velocity obstacles in the early 1990s, advances to computing power and sampling algorithms have allowed computation of the explicit closest point of approach solution for candidate velocity vectors in real time.
Benjamin (2006) and Choi (2013) both examined CPA-based collision avoidance techniques. The CPA-based algorithm requires more computation resources than the velocity obstacle; however, CPA-based collision avoidance algorithms yield quantifiable information about each candidate velocity vector. In reasoning about more information than the velocity obstacle’s simple “safe/unsafe” value, the CPA-based method makes additional information about a collision avoidance scenario available to a multi-objective optimization solver thus allowing more informed decisions regarding overall mission priorities. In multi-objective autonomous design space, overall mission priorities include the mission objectives, navigational constraints, collision avoidance constraints, and other relevant operational input.
Sampling algorithms such as Interval Programming (Benjamin 2004) allow for intelligent exploration of a decision space to create a piecewise approximation to the underlying true objective function. Configuration parameters such as the number of sample points, the type of approximation refinement, and the desired mesh resolution allow for sufficient sampling precision without the costs of brute force (Benjamin 2009). With the recent improvements of intelligent sampling algorithms and computing power, the CPA-based techniques are becoming more practical.
Autonomous designers should be cognizant of the impacts of design decisions on safety. The compounded effects of various design decisions on the individual mission, navigational, and collision avoidance objective functions require extensive testing to validate and verify robust performance in extreme operating conditions. Understanding the effects of autonomous collision avoidance parameters is necessary to achieve intended performance characteristics. Discussion of identification and tuning of collision avoidance parameters is found in Woerner (2014).
Testing Geometries
Several examples of protocol based collision avoidance are found in the literature (Lee; Perera; Shah). Many of these authors studied single vehicle pairs at any given time. Of those studies examining multiple vehicles, the scenarios often appear in sequential single vehicle pairs such as a vessel crossing a wide sea-lane. Several simulation-based protocol tests have also been conducted recently though many are limited in their scope to near-canonical encounter geometries and limited simultaneous, multi-vehicle encounters. These geometrically canonical or otherwise constrained encounters often evaluate either orthogonal or parallel tracks. In most recent literature, these “multi-vehicle” test that occur in succession rather than simultaneous fashion limit the utility of rigorously testing the underlying collision avoidance algorithms. More interesting results occur when the algorithms are stressed with competing constraints of both protocol and operational importance.
Protocol Evaluation and Compliance
Protocol compliance is often asserted by authors in the collision avoidance realm with no metric of verification or validation. The term "compliance" is often used in the general context of COLREGS protocols to ambiguously describe only the power-driven vessel rules in nominal operating conditions (COLREGS Rules 13-17). Little discussion exists in the literature as to how protocols such as COLREGS should be examined for compliance for either human-controlled or autonomous vessels for the complete set of protocol requirements. The Rules are intentionally vague to allow a reasonably experienced human operator the flexibility to take the most appropriate action within the context of the Rules. There are no well-defined universally recognized rubrics to measure or grade any vessel on how best to be “compliant” with the protocol nor what protocol “compliance” means. There are, however, extensive cases in admiralty law and practical experience of seasoned mariners that offer insight into means of shaping a framework for protocol evaluation. Literature pre-dating autonomous collision avoidance has consolidated many scenarios, lessons, and court rulings regarding collision avoidance on the seas (Cockcroft); however, many of these lessons are violated in recent academic literature on the subject due to the unintentional disregard of human-established customs and case law.
DISCUSSION
Similar to the watch officer of a human operated ship, the autonomous helm must appropriately balance the input of mission priorities, navigational constraints, and collision avoidance concerns. Depending on the particular combination of instantaneous environmental conditions, near term concerns, and long term objectives, the helm must appropriately choose a velocity vector that prioritizes the most effective and efficient maneuver. There is not necessarily one static set of conditions that always applies for prioritizing mission, navigation, and collision avoidance over one another. Similar to an officer standing a human operated watch, the autonomous helm must intelligently reason about the meaning of all data and priorities at its disposal while making a decision that will not result in thrashing or short term gain to the detriment of long term success. Multi-objective optimization is a common method for autonomous algorithms to reason about multiple competing demands for the autonomous helm’s attention.
A typical multi-objective optimization problem takes the form of Equation 1. The utility function, f! x!, … , x! , can describe any objective function including the mission(s), navigational constraints, or collision avoidance routines. The priority weights,!!!!, for collision avoidance routines are often selected based on current range, distance at CPA, or time to closest point of approach with the contact.
!∗= !"#$!!
Autonomous helm designers often design utility functions for the competing objectives in a polar space of speed (radius) and course (angle). Selection of the final course-speed pair that constitutes a velocity vector will be made based on prioritization of objective functions subject to design choices and environmental parameters. The proper selection of these priority weights in complex scenarios is necessary but not sufficient to find an appropriate solution. Designing a mission’s objective function to appropriately relax its preference from its peak optimal value to “next best” alternatives is as much an art as a science. This relaxation must be achieved in a way consistent with mission priorities without being overly limiting when faced with heavily constrained collision avoidance or navigational environments.
Patience Parameter
One design tradespace for mission objective functions especially for high-speed craft lies in the preference to do one of three things when forced to deviate from the preferred velocity vector: maintain a near constant speed while altering course; maintain a near constant course while altering (usually slowing) speed; or selecting some weighted combination thereof. By more thoroughly examining the tradespace that exists between course and speed prioritization when deviating from a preferred velocity vector and understanding the consequence thereof on performance metrics in collision avoidance scenarios, one can more appropriately design and allow autonomous tuning of objective functions when collision avoidance routines are active.
An additional objective function design parameter is introduced that allows an active tradespace between constant course-dominated decisions (speed may vary) and constant speed-dominated decisions (course may vary). This paper demonstrates that the active tradespace between these two extremes greatly impacts the resulting performance metrics in multi-vessel, protocol-constrained, high-speed encounters. Traditionally there has been little investigation in the literature to the effects on mission and collision avoidance performance when a choice must be made to deviate from preferred course and speed. In such algorithms, the preferred velocity vector is chosen based on mission priorities other than the collision avoidance procedure. Most velocity obstacle-based algorithms use a heuristic cost function to find the lowest cost deviation from an a priori selected velocity vector that represents the peak of the primary mission’s objective function. This velocity obstacle is used to either validate or eliminate the candidate vector from the decision space without adding additional performance insight to the decision. If a velocity obstacle eliminates the preferred velocity vector, the cost function’s least cost alternative does not necessarily recalculate the utility of this alternative velocity vector with respect to other mission priorities. This results in an often sub-optimal decision with respect to the global decision space for mission, navigation, and collision avoidance, especially
when multiple competing objects are at play or metrics other than achieving a mission waypoint are considered.
A patience parameter allows the primary mission’s objective function alternative utilities when deviating from its preferred velocity vector by giving a weighted preference to either course or speed. By using multi-objective optimization with a non-binary collision avoidance decision space based on the resulting distance and/or pose at closest point of approach, intelligent compromise can be achieved to choose a velocity vector consistent with considerations of a human operator. This patience parameter, !, spans from 1:99 to 99:1 giving the mission objective function designer wide latitude in tuning routines to behave as desired with respect to performance metrics (Equation 2; Fig 1).
! =!!"#$%&
!!"##$ (2)
!ℎ!"!!!"#$ℎ!"!!!"#$%&+ !!"##$= 100%! !
Fig 1 This polar heat map shows course (angle) and speed (radius)
for patience parameters with values of ! =!30 (top) and ! =!70 (bottom). Desirable velocities are dark red while less desirable velocities are blue. The bottom plot shows a strong desire to remain on course with less concern for speed. Both algorithms are trying to achieve a course of 180. The fuchsia point represents the peak value.
Experimentation allowed observation of decision behavior for vehicles with patience parameter as a variable. Two such experiments of the same initial detection geometry and nearly identical instantaneous geometries illustrate the variation possible in the decision space. The geometry configuration for these objective functions is shown in Fig 2. The high-speed vessel’s objective functions for patience parameters of ! = 30! (left column) and ! = 70!(right column) are shown in Fig 3. These polar objective functions represent the high-speed vessel’s decision space. In this heat map of candidate velocity vectors, red is most desired while blue is least desired. Radius corresponds to desired velocity; maximum speed is
represented by the outer edge of each circle. The polar angle corresponds to heading with North being vertical.
The combination of objective functions ! ! using Equation 1 corresponds to a collective objective function (!∗) according to priority weights !!. For this same initial geometric configuration, a snap shot of objective functions was taken at nearly identical points in the experiment.
The first row of objective functions represents collision avoidance for the high-speed vessel encountering slow speed vessel A. The second row of objective functions represents collision avoidance for the high-speed vessel encountering slow speed vessel B. Based on the time that this experiment was frozen, the objective functions are nearly identical for collision avoidance in the two variations of patience parameter.
Fig 2 Instantaneous relative geometries are shown for comparison of
the objective functions of Fig 3 (range not to scale). The high-speed vessel is shown in red.
The third row of objective functions represents the primary mission objective: transiting along track to the next waypoint. Note that this was the most prominent difference in the two experiments and was the primary variable of interest to each iterative geometric test. The ! = 30 (left) experiment shows high desire to maintain speed at the cost of altering course. Likewise, the ! = 70 (right) experiment shows a high desire to maintain course while allowing the vessel to slow as necessary.
Fig 3 The high-speed vessel’s objective functions for patience
The final pair of objective functions represent the collective objective function based on the weighted summation of rows 1-3. This experiment demonstrates the variation of the chosen course-speed pairs as shown by a fuchsia dot on the
cumulative objective function polar plot. The ! = 30 vessel chose maximum speed at course ≈ 090; the ! = 70 vessel chose near-zero speed while maintaining course. The resulting maneuvers caused significant reduction in temporal efficiency (90% vs. 68%) while maintaining relatively high track efficiency (Fig 4). This exemplifies the need for tuning based on mission priorities. Comparisons of mean efficiency over all geometries are shown for both track and temporal. The areas of slight variation seen in the angle of excluded (blue) decision space in objective functions for the high-speed vessel encountering slow speed vessel B (row 2) were not in regions of peak values (darkest red) for the collective objective function, and therefore valid for comparison.
Fig 4 The efficiencies varied for the high-speed vessel depending on
the patience parameter chosen. “Experiment” refers to Fig 3.
Testing With Iterative Geometry
To advance the canonical nature and relatively small variation of geometries found throughout the literature, a geometry generation scheme was developed and used for the testing of high-speed vessel encounters. Testing robustness vis-à-vis encounter geometry included generating iterative initial geometries using constant collision avoidance and primary mission algorithm configurations under the protocol constraints of COLREGS. These iterative geometries resulted in varying combinations of required protocol rules. After successive testing of a particular algorithm configuration over the desired geometries, analysis could determine the influence of initial geometry and/or protocol rule on the metrics of concern with the given settings. In this study, the performance metrics included measures of safety, protocol compliance, and efficiency (both spatial and temporal).
To create the specific geometry iterations for a design of experiments, the number of desired configurations was first selected. Initial speeds as well as the initial headings of the high-speed vessel were determined by design and used to seed the geometry generation for the slower vehicles. A baseline
geometry configuration for the two slower vessels was assumed. This slower vessel baseline geometry was only nominal, however, as uniformly distributed noise was used to perturb the slower vessels' initial headings. By inserting this variation for each of the two slower vessels, sufficient deviation from canonical cases could be achieved while still testing the general effects of the iterative high-speed vessel’s encounter geometries.
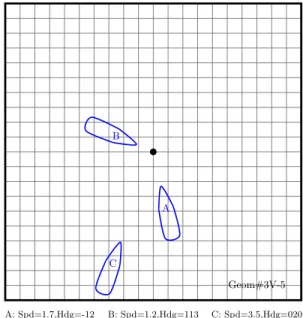
After determining the initial speed and heading of each vessel including noise, the vessels were placed at initial spatial coordinates such that maintaining their respective initial course and speed would result in simultaneous arrival at a shared point for all vessels (Fig 5). More than demonstrating that appropriate action was taken for a single rule, this placed vessels in situations where requirements of multiple rules conflict with one another and operational compromises must be made. A common tie-breaking scheme in the literature is to use time to CPA to choose which constraint to relax; in this geometry configuration, time to CPA is equivalent for all vehicles so a more elegant decision is required.
By repeating this experiment for several geometries of equally constrained initial conditions for collision, the nature of the autonomy's scheme for resolving conflicting constraints for collision avoidance is forced to the surface. The true ability of the underlying collision avoidance algorithms to successfully reason about more complex scenarios of each rule set is also tested. Discovery of edge cases for particular rule pairs in one-on-one scenarios is not trivial; however, the edge case
A: Spd=1.7,Hdg=-12 A B: Spd=1.2,Hdg=113 B C: Spd=3.5,Hdg=020 C Geom#3V-5
Fig 5 An example geometry iteration shows the initial positions of
three vessels. The dot in the center represents the simultaneous collision point. Distance from the collision point represents the initial speed of the vessel where farther distance implies faster initial speed. Slow speed vessels A and B were in nominal crossing patterns with initial heading noise to preclude canonical geometries. High-speed vessel C assumed initial headings throughout the range of 0 to 360 degrees.
search for discovering autonomous collision avoidance compromise requires advanced testing such as this. When properly designed, this iterative geometry scheme allows testing of the full geometry spectrum using rule, multi-vessel scenarios in protocol-constrained environments.
Metrics For Comparison
Several metrics were used to allow a more full picture of the effects of design and configuration decisions on collision avoidance performance. These metrics are consistent with human operated ship driving considerations for complex encounters of multiple vehicles, multiple rules, navigational considerations, and simultaneous mission needs. The primary metrics used to analyze and assess performance included:
- Distance at CPA - Pose at CPA
- Quantified protocol compliance - Track efficiency
- Temporal efficiency
Safety was measured using a combination of range and pose at closest point of approach. Pose at CPA is little studied in the literature of autonomous vehicle collision avoidance, though is of high interest to manned operators. For example, assuming that two encounters occurred with the same CPA distance, a vessel that points a contact at CPA should feel more concern than a vessel who takes a contact down her preferred beam on parallel tracks.
Temporal efficiency (Equation 3) was calculated as the dimensionless value of time required to achieve the next subsequent waypoint at the initial course and speed without deviation divided by the actual time to achieve the subsequent waypoint. Track efficiency was measured as the dimensionless ratio of “odometer” distance between waypoints and linear distance between waypoints (Equation 4).
!!"#$%&'(=!"#$!"#$!"#$!%&
!"#$!% (3)
!!"#$%#&=!"#$!"#$!%&
!"#$!"#$!% (4) While protocol compliance is arbitrarily asserted by many studies, no known work to date has quantified what it means to be protocol compliant. A first iteration of compliance quantification was designed and used for this work based on extensive analysis of admiralty law, current and former collision avoidance protocols (COLREGS and the evolution thereof), and input from real-world experienced operators on the high seas. While not yet a fully refined evaluation solution, this first iteration shows that extensive testing with some intelligently chosen combination of metrics yields
insight as to the influence of underlying variables and unintended outcomes of collision avoidance protocols when heavily or over constrained conditions exist (e.g., multiple conflicting simultaneous collision avoidance protocols and mission objectives). The protocol compliance metric considers explicit protocol requirements, case law, best practices and lessons learned, and customs expected by human operators. Scores were assigned on a 0-100 scale.
Testing within this experiment was limited to power driven vessels in sight of each other. Assumptions for vessels operating in degraded sensing environments, non-power driven or special exemption status, and other advanced considerations should be incorporated into similarly challenging testing regimes that incorporate similar metrics for effectiveness. Testing and evaluating the full spectrum of protocol requirements outside COLREGS Rules 13-17 is especially important before fielding.
RESULTS
To thoroughly test the effects of initial geometry and the patience parameter on the performance metrics of high-speed vessels, a design of experiments was developed. Three vehicles existed on the course with no other vehicles or navigational constraints present; this scenario simulated an open-ocean interaction of three transiting vehicles with extreme collision risk if no action were taken. Two of the vehicles were given speeds similar to transiting merchants that might be found on the open seas (12 and 17 knots). The third vehicle, a high-speed transiting vessel, was assigned a speed of 35 knots. The two slower craft were positioned such that they would nominally start in a crossing situation (Rules 15, 16, and 17 of COLREGS); however, their initial courses were each chosen using random noise of up to 20 degrees (10 degrees either port or starboard) to create non-canonical initial encounter geometry. The high-speed vessel started at headings chosen by the experiment designer nominally encompassing all 360 degrees. With the unique initial headings and vehicle speeds assigned for each experiment, the vessels were positioned at (x,y) coordinates such that without autonomous collision avoidance action, all three vehicles would collide simultaneously at the origin (Fig A1). Each vessel’s primary mission was to achieve the next navigational waypoint. The waypoint’s location was a point on the initial track line of each vessel such that the simultaneous collision point existed at one-third of initial track distance.
The experiment was iterated over varying levels of patience parameters ranging from 1 to 99 (11 steps total). This forced all three vehicles to be in stressing situations while allowing analysis of the underlying algorithm performance. All other collision avoidance tuning parameters were held constant. The experimental parameters included initial geometry, initial velocity, protocol rule combinations, and the vessel's emphasis on prioritizing course over speed (or vice versa).
By forcing a multi-vehicle simultaneous encounter with sufficient bearing spread to require multiple rules, the autonomous solver was forced to choose velocity vectors that might ultimately conflict with the desires of the mission (here, achieving the next waypoint down track) and other collision avoidance rules required. As an example, a vessel might be in a stand-on situation with one contact and simultaneously be in a give-way situation with another contact. Robust testing scenarios such as this exercise the autonomous collision avoidance algorithms in ways that current literature does not discuss thus allowing a more thorough understanding of full spectrum response.
Specific maneuvering characteristics of the vessels were considered and values were chosen to be consistent with open ocean going vessels including turn radius, limiting accelerations, and similar parameters. These maneuvering characteristics were not varied as experimental parameters, and thus were not examined as part of the post-mission analysis. Future work should consider the influence of individual vessel constraints to collision avoidance algorithm design in conjunction with the parameters studied here.
Temporal Efficiency Aggregate
Mean and standard deviation were computed for each vessel’s performance over the aggregate of all iterative geometries for each patience parameter. Fig 6 shows a relatively high but decreasing mean temporal efficiency for the high-speed vehicle over increasing patience parameters. Examination of the standard deviation of temporal efficiency, however, shows an increasing spread in values (higher standard deviation) for the high-speed vessel as its patience parameter increases. The standard deviations of the slow speed vessels remained rather constant over the patience parameter domain (Fig 7). Wide variation was seen in the high-speed vessel’s temporal efficiency as patience parameter and geometry configurations changed (Fig 8).
Fig 6 Temporal efficiency results show a decreasing trend in mean
over all iterative geometries for high-speed craft as patience parameter increases (i.e., more preference is given to maintaining course rather than maintaining speed).
Fig 7 Temporal efficiency results show a rising trend in variability
for high-speed craft as patience parameter increases (i.e., more preference is given to maintaining course rather than maintaining speed).
Fig 8 Temporal efficiency for the high-speed vessel shows that
geometry configuration plays an important role in which patience parameter should be selected. This implies that real-time tuning may be of importance to achieve greater efficiencies for high-speed vessel collision avoidance algorithms.
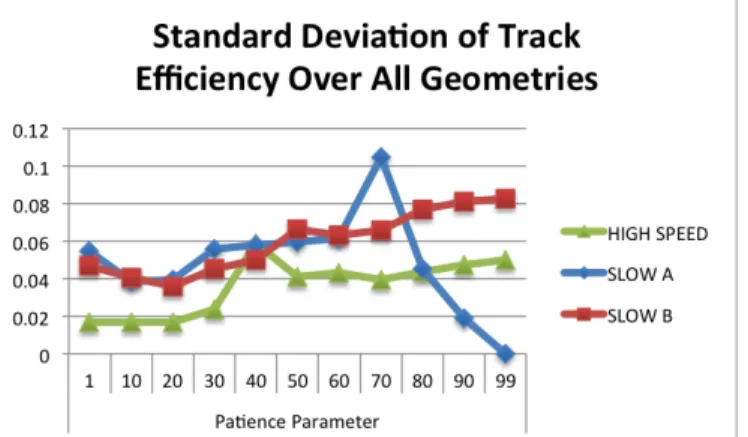
Track Efficiency Aggregate
The mean track geometry was similar to that of temporal efficiency (Fig 9). The standard deviation of track efficiency showed that the high-speed vessel also had a positive correlation with the patience parameter (Fig 10). A deeper dive into each vessel’s performance resulting from iterated geometries is warranted for a more thorough understanding of spatial and temporal efficiency when tuning a collision avoidance algorithm, especially before applying an algorithm to a high-speed vessel.
Fig 9 Track efficiency results show high-speed vessel performance
on par with one of the slow speed vessels.
Fig 10 A rising trend is seen in variability for the high-speed vessel
as the patience parameter increases.
Safety Score By Rule
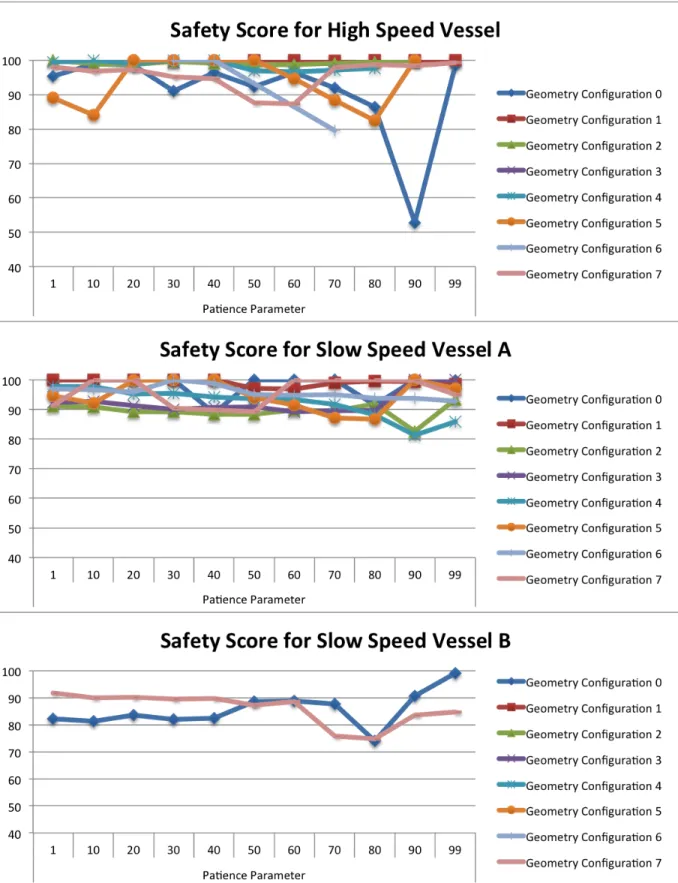
Safety was computed as a function of actual distance at CPA compared to threshold desired distances at CPA. This is similar to manned operations where a Captain’s guidance might say to take reasonable action to maintain all contacts outside a stated range while not allowing any contact to come within a closer stated range. A series of alerts and procedures of increasing action might be required the closer a contact comes to the exclusion range. In these experiments, vessels were all given similar detection ranges and preferred distances at CPA. The high-speed vessel had higher variability of distance at CPA than the lower speed vessels for various geometry and course-speed pair combinations as shown in the appendix (Figs A2-A3).
Safety Aggregate
Examination of the resulting distance at CPA was considered as a metric for safety. While the data representing each vehicle’s CPA distance for each patience parameter helps inform refinement of individual collision avoidance behaviors, a means of examining overall performance was also desired. The average distance at CPA was computed for both the slow vehicles and the high-speed vehicle over all geometries and patience parameters. These data were then aggregated for each vessel; the mean (Fig 11) and standard deviation (Fig 12)
of distance at CPA for all geometries was calculated for each patience parameter. While this aggregate data seems to show reasonably consistent results, the safety score by rule and geometry (Figs A2-A3) demonstrate the need to thoroughly examine testing data at the rule level as well as the aggregate level.
Fig 11 The mean of all geometries and all required protocol rules was
determined for each vehicle and patience parameter.
Fig 12 The standard deviation of all geometries and all required
protocol rules was determined for each vehicle and patience parameter.
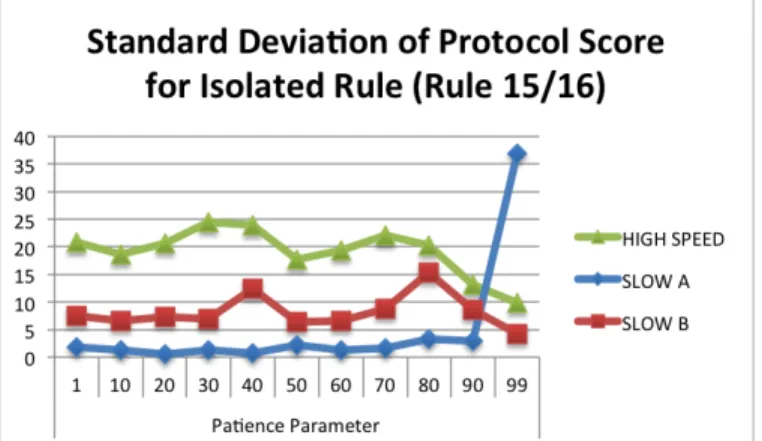
Protocol Score By Rule
Protocol “compliance” for the isolated power-driven vessel rules was scored using techniques as described above. For certain rules, the high-speed vessel demonstrated a lower overall performance with respect to protocol (Fig 13) with an accompanying higher variation (Fig 14) when holding collision avoidance tuning parameters constant. Prior to fielding, methods such as iterative geometry testing should be used to exhaustively test collision avoidance algorithms for protocol compliance edge cases. In addition, this work has shown that an algorithm that performs well on a slow speed vessel requires tuning specific to a high-speed vessel before migrating the algorithm for use.
Fig 13 The high-speed vessel is shown to have a lower mean protocol
score (averaged over all geometries) for most patience parameters indicating collision avoidance tuning specific to high-speed vessels is required.
Fig 14 The high-speed vessel is shown to have a higher standard
deviation of protocol score for crossing give-way scenarios than the slower speed vessels. This is an indication of increased study being required for proper tuning before fielding.
CONCLUSIONS
Experimentation with high-speed vessels in protocol-constrained, multi-vehicle, multi-rule scenarios demonstrated that both geometry and patience parameters influenced key metrics of performance. Additional investigation is warranted for autonomous collision avoidance designers to determine the exact effects of encounter geometry and relaxation of over-constrained missions. Comparison of slow and high-speed vessels showed inconsistencies in performance that should be considered by high-speed collision avoidance algorithm designers especially when tuning for desired performance. If considering pose as a primary factor in the quantification of safety and/or protocol compliance, designers should also consider pose as a factor in the selection of velocity vectors in collision avoidance scenario. This is a limitation of the current literature that warrants additional study into use of alternative collision avoidance techniques such as explicit CPA and pose calculations using smart sampling techniques. The tuning of autonomous collision avoidance algorithms is a little-studied area. The effects of placing equivalent collision
avoidance algorithms on both slow and high-speed vessels require further investigation before fielding. As demonstrated in the results section, several effects can be seen to cause pause when a designer arbitrarily assigns a collision avoidance or corresponding primary mission algorithm to a vessel for all initial speeds and encounter geometries. Rather, designers should use approaches similar to this to robustly test their algorithms to determine which variables require tuning specific to the real-time mission and collision avoidance scenario.
ACKNOWLEDGEMENTS
The authors would like to thank John Leonard, Henrik Schmidt, Jonathan How, and Franz Hover for their support.
REFERENCES
Navigation Rules, International-Inland / U.S. Department Of Transportation, United States Coast Guard. 1977-19 : CG. [Washington, DC] : The Guard : [For Sale By The Supt. Of Docs., U.S. G.P.O.], 1999.
Benjamin, M., Curcio, J., And Newman, P. Navigation Of Unmanned Marine Vehicles In Accordance With The Rules Of The Road. Proceedings 2006 IEEE International Conference On Robotics & Automation, 2006. ICRA 2006 (2006), 3581.
Benjamin, M., Leonard, J., Curcio, J., And Newman, P. A Method For Protocol- Based Collision Avoidance Between Autonomous Marine Surface Craft. JOURNAL OF FIELD ROBOTICS 23, 5 (2006), 333 – 346.
Benjamin, M. R. The Interval Programming Model For Multi-Objective Decision Making. MIT CSAIL AI Memo 2004, 021 (September 2004).
Benjamin, M. R., Newman, P. M., Schmidt, H., And Leonard, J. J. Extending Moos-Ivp And Users Guide To The Ivpbuild Toolbox. Tech. Rep., Technical Report MIT-CSAIL-TR-2009-037, MIT Computer Science And Artificial Intelligence Lab, 2009.
Choi, H., Kim, Y., Lee, Y., And Kim, E. T. A Reactive Collision Avoidance Algorithm For Multiple Midair Unmanned Aerial Vehicles. Transactions Of The Japan Society For Aeronautical And Space Sciences 56, 1 (2013), 15–24.
Cockcroft, A. N., And Lameijer, J. N. F. Guide To The Collision Avoidance Rules. Butterworth-Heinemann, 2012. Fiorini, P., And Shiller, Z. Motion Planning In Dynamic
Environments Using The Relative Velocity Paradigm. IEEE Int. Conf. Of Automat. And Robotics 1 (1993), 550–566.
Fiorini, P., And Shiller, Z. Motion Planning In Dynamic Environments Using Velocity Obstacles. International Journal Of Robotics Research 17, 7 (July 1998), 760– 772.
Kuwata, Y., Wolf, M., Zarzhitsky, D., And Huntsberger, T. Safe Maritime Autonomous Navigation With COLREGS, Using Velocity Obstacles. Oceanic Engineering, IEEE Journal Of 39, 1 (Jan 2014), 110–119. Lekkas, A. M. Guidance And Path-Planning Systems For Autonomous Vehicles. Phd Thesis, Norwegian University Of Science And Technology, 2014.
Perera, L., Carvalho, J., And Soares, C. Fuzzy Logic Based Decision Making System For Collision Avoidance Of Ocean Navigation Under Critical Collision Conditions. Journal Of Marine Science And Technology 16, 1 (August 2010), 84 – 99.
Shah, B. C. Trajectory Planning With Adaptive Control Primitives For Autonomous Surface Vehicles Operating In Congested Civilian Traffic. IEEE International Conference On Intelligent Robots And Systems (Iros) (2014).
Snape, J., Van Den Berg, J., Guy, S. J., And Manocha, D. The Hybrid Reciprocal Velocity Obstacle. IEEE Transactions On Robotics 27, 4 (Aug 2011), 696–706.
Svec, P., Shah, B., Bertaska, I., Alvarez, J., Sinisterra, A., Von Ellenrieder, K., Dhanak, M., And Gupta, S. Dynamics-Aware Target Following For An Autonomous Surface Vehicle Operating Under COLREGS In Civilian Traffic. In Intelligent Robots And Systems (Iros), 2013 IEEE/Rsj International Conference On (Nov 2013), Pp. 3871–3878.
Tam, C., And Bucknall, R. Collision Risk Assessment For Ships. Journal Of Marine Science And Technology 15, 3 (2010), 257–270.
Tam, C., Bucknall, R., And Greig, A. Review Of Collision Avoidance And Path Planning Methods For Ships In Close Range Encounters. Journal Of Navigation 62, 03 (2009), 455–476.
Van Den Berg, J., Lin, M., And Manocha, D. Reciprocal Velocity Obstacles For Real-Time Multi-Agent Navigation. In 2008 IEEE International Conference On Robotics And Automation, Vols 1-9 (345 E 47th St, New York, Ny 10017 Usa, 2008), IEEE International Conference On Robotics And Automation, IEEE, IEEE, Pp. 1928–1935. IEEE International Conference On Robotics And Automation, Pasadena, Ca, May 19-23, 2008.
Wilkie, D., Van Den Berg, J., And Manocha, D. Generalized Velocity Obstacles. In 2009 IEEE-Rsj International Conference On Intelligent Robots And Systems (345 E 47th St, New York, Ny 10017 Usa, 2009), IEEE Robot & Automat Soc; Robot Soc Japan; Soc Instrument & Control Engn; IEEE Ind Elect Soc; Inst Control, Robot & Syst Korea; Abb; Barrett Technol, Inc; Willow Garage; Robotis; Aldebaran Robot, IEEE, Pp. 5573–5578. IEEE Rsj International Conference On Intelligent Robots And Systems, St. Louis, Mo, Oct 10-15, 2009.
Woerner, K. L. COLREGS-Compliant Autonomous Collision Avoidance Using Multi-Objective Optimization With Interval Programming. Master’s Thesis, Massachusetts Institute Of Technology, 77 Massachusetts Avenue, Cambridge, Ma 02139, June 2014.
Woerner, K. L., And Benjamin, M. R. Safety And Efficiency Analysis Of Autonomous Collision Avoidance Using Multi-Objective Optimization With Interval Programming. Naval Engineers Journal 126, 4 (December 2014), 163–167.
Wo er ne r Au to no mo us C oll isi on Av oid an ce T ra de sp ac e An aly sis fo r Hi gh -Sp ee d V es se ls
A
P
P
EN
D
IC
ES
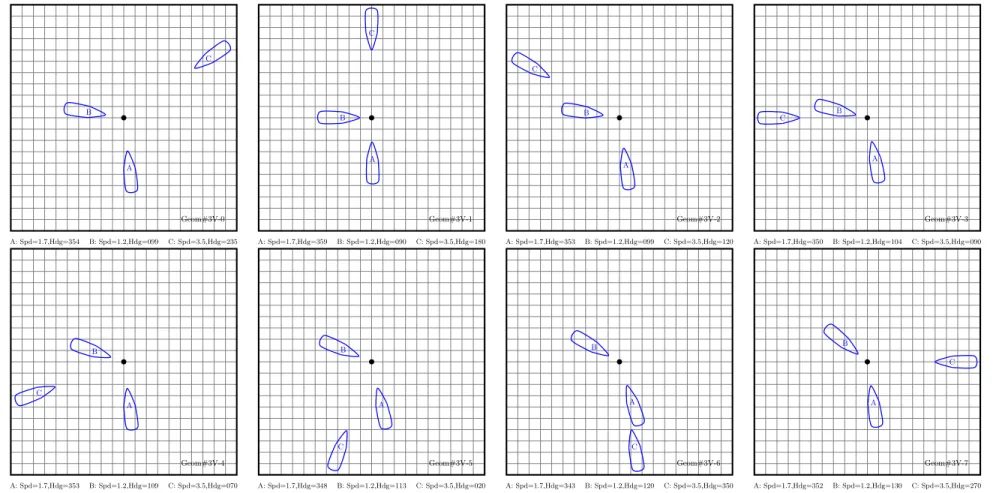
A: Spd=1.7,Hdg=354 A B: Spd=1.2,Hdg=099 B C: Spd=3.5,Hdg=235 C Geom#3V-0 A: Spd=1.7,Hdg=359 A B: Spd=1.2,Hdg=090 B C: Spd=3.5,Hdg=180 C Geom#3V-1 A: Spd=1.7,Hdg=353 A B: Spd=1.2,Hdg=099 B C: Spd=3.5,Hdg=120 C Geom#3V-2 A: Spd=1.7,Hdg=350 A B: Spd=1.2,Hdg=104 B C: Spd=3.5,Hdg=090 C Geom#3V-3 A: Spd=1.7,Hdg=353 A B: Spd=1.2,Hdg=109 B C: Spd=3.5,Hdg=070 C Geom#3V-4 A: Spd=1.7,Hdg=348 A B: Spd=1.2,Hdg=113 B C: Spd=3.5,Hdg=020 C Geom#3V-5 A: Spd=1.7,Hdg=343 A B: Spd=1.2,Hdg=120 B C: Spd=3.5,Hdg=350 C Geom#3V-6 A: Spd=1.7,Hdg=352 A B: Spd=1.2,Hdg=130 B C: Spd=3.5,Hdg=270 C Geom#3V-7Fig A1 The iterative geometry testing scheme consisted of eight configurations. The slow
vessels (A & B) were placed in nominal crossing situations perturbed by +/- 10 degrees of heading noise. The high-speed vessel (C) started at various locations resulting in varying rule configurations.
Fig A2 Safety scores for crossing give-way scenarios are shown for each vehicle for varying geometry configurations and patience parameters. The
high-speed vessel results had more significant low score outliers for specific geometry and patience parameter combinations. Certain encounter geometries for multi-vehicle scenarios could be well served from self-tuned patience parameters corresponding to higher safety scores (all else equal).
Fig A3 Safety scores for stand-on scenarios are shown for each vehicle for varying geometry configurations and patience parameters. The