Publisher’s version / Version de l'éditeur:
Fire Protection Engineering, Fall 32, pp. 42-56, 2006-10-01
READ THESE TERMS AND CONDITIONS CAREFULLY BEFORE USING THIS WEBSITE. https://nrc-publications.canada.ca/eng/copyright
Vous avez des questions? Nous pouvons vous aider. Pour communiquer directement avec un auteur, consultez la première page de la revue dans laquelle son article a été publié afin de trouver ses coordonnées. Si vous n’arrivez pas à les repérer, communiquez avec nous à [email protected].
Questions? Contact the NRC Publications Archive team at
[email protected]. If you wish to email the authors directly, please see the first page of the publication for their contact information.
NRC Publications Archive
Archives des publications du CNRC
This publication could be one of several versions: author’s original, accepted manuscript or the publisher’s version. / La version de cette publication peut être l’une des suivantes : la version prépublication de l’auteur, la version acceptée du manuscrit ou la version de l’éditeur.
Access and use of this website and the material on it are subject to the Terms and Conditions set forth at Smoke detectors in prison cells
Su, J. Z.; Gaw, R.; Richardson, J. K.; Taber, B. C.; Carpenter, D. W.
https://publications-cnrc.canada.ca/fra/droits
L’accès à ce site Web et l’utilisation de son contenu sont assujettis aux conditions présentées dans le site LISEZ CES CONDITIONS ATTENTIVEMENT AVANT D’UTILISER CE SITE WEB.
NRC Publications Record / Notice d'Archives des publications de CNRC:
https://nrc-publications.canada.ca/eng/view/object/?id=5e417ed1-d6da-4356-9d45-00d23e70bf9c https://publications-cnrc.canada.ca/fra/voir/objet/?id=5e417ed1-d6da-4356-9d45-00d23e70bf9c
http://irc.nrc-cnrc.gc.ca
Sm oke de t e c t ors in prison c e lls
S u , J . ; G a w , R . ; R i c h a r d s o n , K . ; T a b e r , B . ;
C a r p e n t e r , D .
N R C C - 4 7 6 5 1
A version of this document is published in / Une version de ce
document se trouve dans: Fire Protection Engineering, No. 32,
Fall 2006, pp. 42-56
SMOKE DETECTORS IN PRISON CELLS
Joseph Su,a Randy Gaw,b Ken Richardson,c Bruce Taber a and Don Carpenter a
a
National Research Council of Canada
b
Correctional Service of Canada
c
Ken Richardson Fire Technologies Inc
Fires occur frequently in North American prisons, most occurring in locked cells. A large majority of these fires are small in size and are not formally reported. As a result of inmates being locked in cells when most cell fires occur, it is important that fires in cells be detected early and help summoned. For that reason, building codes require smoke detection inside cells. For example, in Canada, the National Building Code of Canada1 requires a smoke detector inside each cell. Under NFPA 101,2 Life Safety Code, detectors are required in cells which house more than four inmates.
On average, the frequency and origins of fires in Canadian federal prisons are probably similar to most North American facilities. It is possible that the contents that an inmate may bring into a cell in Canada may be more in number than in other jurisdictions as a result of Human Rights Tribunal decisions related to aboriginal, religious or educational reasons. Also, inmates are permitted to smoke in cells in Canadian federal institutions. It must be noted, however, that all Canadian federal prison living units are fully sprinklered, thus reducing the potential for flashover fires.
The problem that operators of correctional facilities are encountering with the in-cell detectors is one of nuisance alarms, usually caused by the inmates. The nuisance alarms may be the result of inmates activating the detector through intentionally creating smoke in its vicinity (by smoking, religious or cultural ceremonies, etc.) or by maliciously damaging the unit. Whatever the cause, the nuisance alarms result in:
• Time lost while guards investigate the cause of the alarm. This could result in a "cry wolf" syndrome in which guards and inmates pay less attention to alarms. That also means lost time for other employees who must respond from other parts of the facility.
• Significant cost, as detectors must be examined and replaced should they be damaged. As well, costs associated with restoring a system to proper operation must be considered.
• Increased risk to inmates and guards as the fire alarm system could be out of service for minutes, hours or even days depending on the extent of damage, the time of the day, the day of the week or the location of the facility. Some systems in remote locations may be out of service for extended periods while waiting for replacement parts or service technicians.
Operators of correctional facilities, then, wish to remove in-cell smoke detectors (the primary causes of nuisance alarm problems) and relocate them outside cells. To establish the technical substantiation for this change, Correctional Service of Canada (CSC), in
conjunction with the National Research Council of Canada and Ken Richardson Fire Technologies Inc., undertook a full scale research project using a temporarily abandoned prison range in Kingston, ON, Canada. The objective of the research project was to determine-if the in-cell smoke detectors could be moved outside of cells and still provide an equivalent level of fire protection that the fire risk to inmates in the cell of fire origin would not exceed critical limits for carbon monoxide, carbon dioxide and temperature.
FIRE LOSSES IN PRISON
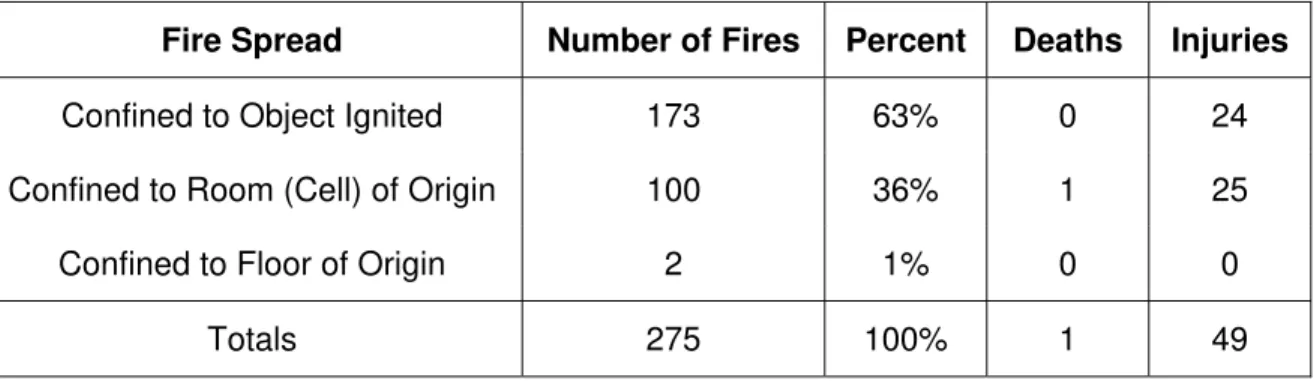
Fortunately, the number of fires involving deaths and injuries in Canadian federal prisons is low. It will be assumed, for the purposes of this paper, that all fires in these facilities have been reported. This is a conservative assumption since any unreported fires would have been quite small and would have caused minimal damage. The fire statistics for these Canadian facilities for the period 1995 to 2000 are shown in Table 1.3
TABLE 1. Extent of Fire Spread in Canadian Federal Prison Facilities 1995-2000. 3
Fire Spread Number of Fires Percent Deaths Injuries
Confined to Object Ignited 173 63% 0 24 Confined to Room (Cell) of Origin 100 36% 1 25
Confined to Floor of Origin 2 1% 0 0
Totals 275 100% 1 49
Table 1 clearly demonstrates that virtually all fires in these facilities are confined, at worst, to the cell of fire origin, which is not surprising given the presence of automatic sprinkler protection in all CSC facilities. This demonstrates that flashover (total fire involvement in a cell) occurs infrequently, since a flashover fire would typically spread beyond the cell of origin.
From Canadian Federal Prisons data on fire,4 it is reported that most fires are deliberately set by inmates with the reasons for these set fires including: intimidation of staff and other inmates, destruction of prison or personal property, diversion for assault or escape attempt, suicide attempt and escape from boredom. The materials first ignited in these fires are reported to be typically materials inmates have in their cells.
While specific Canadian data on materials first ignited is not available, the National Fire Protection Association provides guidance in this area. Table 2 shows statistics from the United States5 for the period 1989-1993. CSC indicates that these percentages appear to be similar to their experience.
TABLE 2. Leading Sources of Material First Ignited. 5
Mattress or Bedding 40.3%
Trash 10.1% Paper 6.1% Clothing 6.0%
Table 2 essentially provides the shopping list of the burning materials to which smoke detectors must be able to respond in the event of a fire in an individual cell. As such, this information was used to establish the fire source materials in the experiments conducted as part of this research.
EXPERIMENTAL PARAMETERS
Sources of Fire
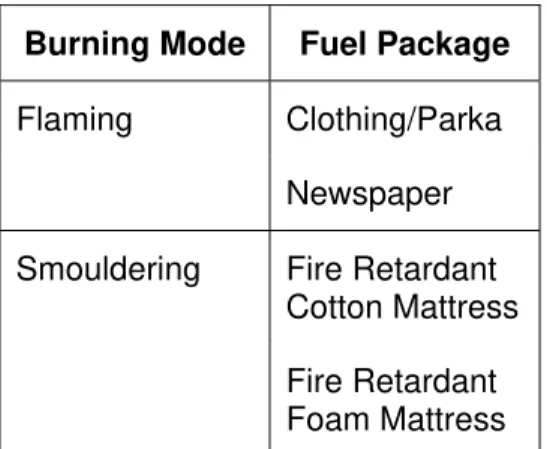
To establish the differences in response for detectors inside and outside cells, it was necessary to develop fire sources that would be both representative-of fires that occur in cells and be reasonable challenges to the detectors themselves. Using the statistical data on materials first ignited shown in Table 2, the fire sources shown in Table 3 were selected for the experiments.
TABLE 3. Fire Sources for Experiments
Burning Mode Fuel Package
Flaming Clothing/Parka Newspaper Smouldering Fire Retardant
Cotton Mattress
Fire Retardant
Foam Mattress
All materials (except newspaper) used to create the fuel packages for the selected fire sources were obtained from CSC. The fire-retardant mattresses conformed to the
California Bureau of Home Furnishings and Thermal Insulation Technical Bulletin 121, "Flammability Test Procedure for Mattresses for Use in High-Risk Occupancies." 6
The fire sources, shown in Table 3, were selected to be a challenge to smoke detectors located inside and outside cells. With a larger fire source, it is possible that critical conditions inside a cell would be reached earlier than those obtained in these
experiments. At the same time, it is likely that earlier detection time, either inside or outside the cell, would also occur as a result of the larger fires. Given that all Canadian federal prison cells are sprinklered, the sprinklers would be more responsive to the larger fire source as well. Another not so-obvious factor is that larger fires are considered to be easier for inmates in adjacent cells to detect and raise an alarm.
The extent to which critical conditions are or are not reached in the tests is contingent on the experimental conditions. It is obviously difficult to extrapolate these to all other fire sources and conditions due to the many factors that affect the onset of critical conditions inside a cell.
Critical Conditions
The approach used in this research was to determine, for the given experimental
conditions, whether or not critical smoke conditions would be attained during a fire in a cell with the smoke detector located outside the cell – whether in a corridor or in a return-air duct. There are two cases to consider.
Case 1 – This is the existing situation with a detector in each cell. The objective for this case is:
TDetection + TAssist < TCritical (1)
While this establishes a benchmark for detection time (TDetection), this does not mean that a
longer detection time will create significant problems in terms of risk to inmates. What is important is that the total of time of detection plus the time for guards to respond to the cell of origin and assist the inmate (TAssist) is less than the time at which critical smoke
conditions are reached in the cell (TCritical). TAssist was chosen for all cases to be 120
seconds. This maximum limit is specified in the NFPA 101 Life Safety Code2 as the maximum time for prison staff to release locks for emergency evacuation or rescue or to initiate other emergency actions.
Case 2 – This is the condition under investigation with detection outside the cell (in the corridor or return air duct). The objective for this case is the same as for Case 1. Even if the total time in Case 2 is greater than Case 1 but the probability of detector response, when needed, is better (i.e., the detector has a higher probability of operating), the ultimate risk to the inmate in the cell of origin may be less with detection outside the cell and a greater detector activation time, provided critical conditions have not been reached inside the cell.
A first important element in the research was to establish what critical conditions would be addressed, i.e., critical conditions in the cell as the result of a fire inside a cell. For this
research, critical conditions were assumed to have been reached when any of the following occurred:
• Carbon monoxide (CO) concentration reaches 1,000 ppm.7
(While Reference 7 suggests a critical concentration of 1,500 ppm for CO, a lower concentration was selected for conservatism.)
• Carbon dioxide (CO2) concentration reaches 5 percent.8
• Oxygen (O2) concentration drops to 14 percent.
• Temperature reaches 80°C.
These concentrations are limiting values that are immediately dangerous-to life or health and represent currently accepted values for these gases for exposures of a number of minutes, usually 30 minutes. While more "toxic" gases, such as HCl, HCN and NOx, may
be associated with fire gas incapacitation, they were not studied in this project due to the many unknown factors that lead to their generation and subsequent affect on humans-(such as burning material properties, ventilation, fire size, etc.). Also, the three gases shown above are commonly selected for establishing limiting conditions in fire
experiments. The temperature limit of 80°C was chosen as a conservative threshold for hyperthermia and skin burns.
EXPERIMENTAL PROGRAM
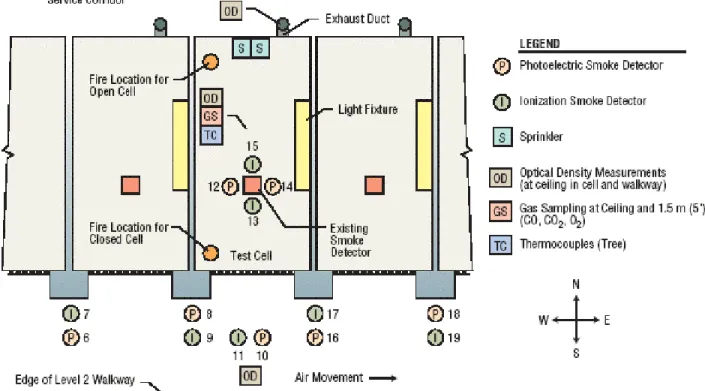
Thirteen full-scale experiments8 were carried out in the prison facility. The layout of the experimental facility and the instrumentation is shown in Figure 1.
It should be noted that the location of the source fire was varied depending on whether the cell had an open or closed front to provide the greatest challenge to the expected first-responding outside-cell detectors. Canadian federal prison authorities estimate that they currently have 10 percent to 20 percent of their cells with open fronts, and that number is decreasing.
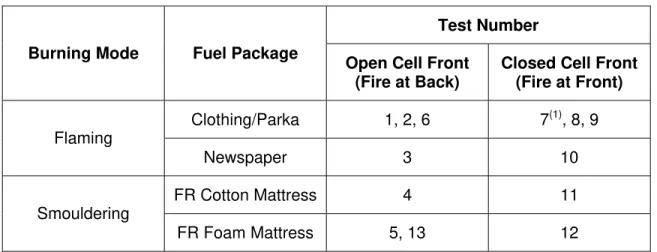
A matrix of the experiments conducted is shown in Table 4. The variables included: Open-/closed-front cells, locations of fires in the cell, the source fuel package and burning mode.
TABLE 4. Experimental Matrix
Test Number
Burning Mode Fuel Package
Open Cell Front (Fire at Back)
Closed Cell Front (Fire at Front) Clothing/Parka 1, 2, 6 7(1), 8, 9 Flaming Newspaper 3 10 FR Cotton Mattress 4 11 Smouldering FR Foam Mattress 5, 13 12 (1)
In this test, the fire was located at the back of the cell.
EXPERIMENTAL RESULTS
The full details of the testing and results are contained in References.8,9 For each of the 13 full-scale tests, the time to actuation of responding detectors was recorded and the conditions inside the cell of origin measured. All tests were run for 15 minutes with all responding detector response times recorded. The objective was to determine conditions in the cell at the times of response of in-cell, outside-cell and duct detectors.
For detectors inside the cell, the average of the detection times for the two detectors of the same type was used in later analysis. The response time for a detector located in the duct was assumed to be the time that the optical density of the smoke in the duct reached the optical density of the smoke in the cell at the average response time of the earlier responding of the two ionization or two photoelectric detectors located in the cell. The actual response times for other detectors outside the cell were used.
The time of interest in assessing critical conditions was TDetection + TAssist. Therefore, to
each detection time, the 120 seconds maximum assist time noted previously was added to establish total response time to a fire in a cell. This was assumed to be a conservative
estimate for the time that facility staff would take to locate the fire and arrange assistance. Critical conditions were compared to in-cell conditions at that total time.
Ceiling Temperatures
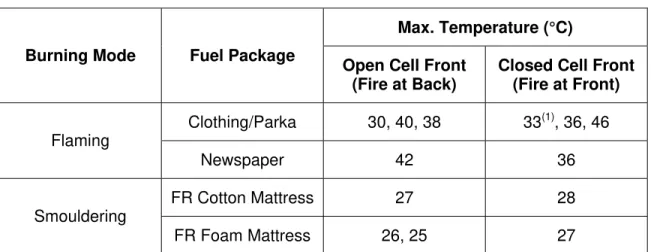
Maximum ceiling temperatures were recorded by the thermocouple tree in the center of the test cell. Table 5 shows the maximum temperature in the cell at the greatest time for detection outside the cell plus assistance time from a guard (or the greatest average of both detectors at a location plus assist time). As can be seen, the maximum temperature recorded in any test was 46°C at the greatest TDetection + TAssist. These recorded
temperatures in all tests are below the activation temperature of "institution type"
sprinklers used inside cells by CSC. The temperature rating of those sprinklers was 71°C (160°F).
TABLE 5. Ceiling Temperatures in Cell
Max. Temperature (°C)
Burning Mode Fuel Package
Open Cell Front (Fire at Back)
Closed Cell Front (Fire at Front) Clothing/Parka 30, 40, 38 33(1), 36, 46 Flaming Newspaper 42 36 FR Cotton Mattress 27 28 Smouldering FR Foam Mattress 26, 25 27 (1)
Fire at back of cell.
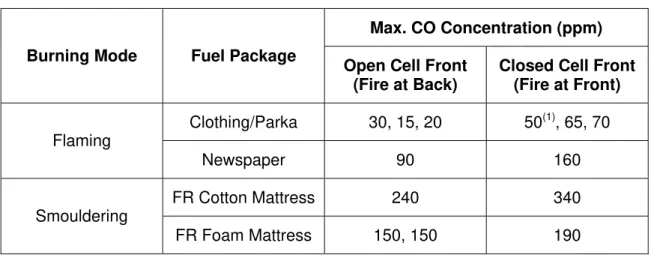
Carbon Monoxide Concentrations
The CO concentrations in the cell at the maximum average detection time outside the cell plus assist time are shown in Table 6. As can be seen, the maximum CO concentration occurred for a smoldering cotton mattress fire with a solid door front and was 340 ppm (34 percent of conservative critical conditions).
TABLE 6. CO Concentrations in Cell
Max. CO Concentration (ppm)
Burning Mode Fuel Package
Open Cell Front (Fire at Back)
Closed Cell Front (Fire at Front) Clothing/Parka 30, 15, 20 50(1), 65, 70 Flaming Newspaper 90 160 FR Cotton Mattress 240 340 Smouldering FR Foam Mattress 150, 150 190 (1)
Fire at back of cell.
Carbon Dioxide Concentrations
The CO2 concentrations in the cell, at the maximum average detection time outside the
cell plus assist time, are shown in Table 7. The maximum CO2 concentration, which
occurred in Test No. 9 (Flaming, Clothing) was 0.55 percent or 11.6 percent of critical conditions.
TABLE 7. CO2 Concentrations in Cell
Max. CO2 Concentration (percent)
Burning Mode Fuel Package
Open Cell Front (Fire at Back)
Closed Cell Front (Fire at Front) Clothing/Parka 0.06, 0.18, 0.15 0.21(1), 0.32, 0.55 Flaming Newspaper 0.18 0.25 FR Cotton Mattress 0.05 0.09 Smouldering FR Foam Mattress 0.02, 0.03 0.07 (1 )
Fire at back of cell.
Oxygen Concentrations
The oxygen concentrations, as a percent of critical conditions in the cell at the maximum average detection time outside the cell plus assist time, are shown in Table 8. Due to the small reductions in oxygen concentrations in the tests, the percent of critical conditions is shown in Table 8 rather than the concentrations themselves. The maximum oxygen reduction, which occurred in Test No. 9, resulted in conditions that were 8.5 percent of the established critical conditions for the cell of origin.
TABLE 8. Oxygen Concentrations in Cell
Oxygen(1) as Percent of
Critical Conditions
Burning Mode Fuel Package
Open Cell Front (Fire at Back)
Closed Cell Front (Fire at Front) Clothing/Parka 1.0%, 2.2%, 2.9% 1.4%(2), 1.6%, 8.5% Flaming Newspaper 2.9% 4.0% FR Cotton Mattress 0.7% 1.7% Smouldering FR Foam Mattress 1.0%, 0.7% 1.0% (1)
Percent of critical conditions was calculated as
100% x ion) Concentrat ic Atmospher -ion Concentrat (Critical ion) Concentrat ic Atmospher -ion Concentrat tal (Experimen . (2)
Fire at back of cell.
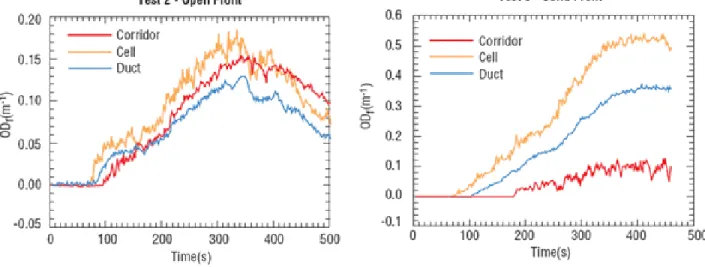
Optical Densities in Cell
Optical densities were measured continuously throughout each test at locations inside the cell, in the exhaust duct from the cell and in the corridor outside the cell. These were used for comparison purposes to determine the time at which a detector inside the duct would respond given the optical density inside the cell at the time of detector response at that location. Optical density plots for an open-front cell test (Test No. 2) and a closed-front cell test (Test No. 9) are shown in Figure 2.
OBSERVATIONS AND SUMMARY
As a result of the experiments, the following observations can be put forward: • The smoldering fires and very small flaming fires resulted in the greatest
detection times.
• The most notable critical condition was that of CO buildup. Smoldering fires resulted in the greatest CO buildup (up to 34 percent of critical conditions). • Flaming fires resulted in the greatest temperature buildup in the cell; however, the
maximum temperature in any test did not exceed 46°C, which is below the normal temperature required to activate the sprinkler in the cell.
• Detection of smoke in the exhaust duct proved to be a viable option for all test scenarios (provided that the exhaust duct is in normal operation).
The open-bar-front cells proved to be less of a challenge to outside-cell detection than closed-front cells. For open-bar-front cells, it can be concluded that moving the detector from inside the cell to outside, either to the duct or corridor, does not result in times being extended to where critical conditions inside the cell would be reached, based on the fire scenarios evaluated in this research. However, moving detectors from inside the cell to the exhaust duct requires effective measures to ensure that the exhaust air ducts are operational and are not blocked. Specifically, the following are applicable to open-bar-front cells:
• Detectors may be moved from inside the cell to outside the cell in the corridor. • The air movement in the corridor had an impact on the response of the corridor
detectors. The detectors on the downstream side of the experimental cell generally activated earlier than those on the upstream side of the cell.
• Detector location in the corridor could be directly in front of the cell or at each column between cells. Locating detectors at alternate columns (every second cell) cannot assure response times before critical conditions are reached.
• The optical density readings obtained in the exhaust duct from the cell indicated that detectors could be located in these ducts and obtain a response prior to critical conditions being reached inside the cell. This application requires a reliable exhaust system in addition to the reliability of specific duct detectors to be used. Measures to prevent inmates from blocking exhaust vents must be applied. A program of upkeep and maintenance would have to be established to ensure reliable operation and to minimize false alarms.
The closed-front cells proved to be a greater challenge to outside-cell detection than the open-bar-front cells. The closed fronts also resulted in more rapid in-cell detection times. For closed-front cells, it can be concluded that moving the detector from inside the cell to the corridor cannot assure that critical conditions would not be reached inside the cell for all fire scenarios evaluated in this research. (Corridor detectors failed to respond to one very small flaming fire within the 15-minute test duration.) Optical density measurements in the exhaust duct, however, indicated that detection times in all tests would enable response prior to critical conditions being reached in the cell, provided that the exhaust
duct is in normal operation. Specifically, the following are applicable to closed-front cells:
• Detectors may be moved from inside the exhaust duct but with the same issues as noted above for open-bar-front cells.
• With current closed fronts, detectors cannot be moved from inside the cell to outside in the corridor given the nonresponse of corridor detectors to very small fires.
• With a ventilation opening in the cell wall at the top of each closed front, it is likely that a detector, located-adjacent to the opening, would respond in sufficient time that critical conditions would not be reached inside the cell. This is
concluded based on the response of corridor detectors to most test fires in closed-front cells with only the normal air leakage in the cell closed-front. In many of the fire scenarios, the higher temperature in the cell probably caused gases to expand and smoke to migrate to corridor. The exact design of the ventilation opening and the location of the detector with respect to the opening would need to be evaluated by test. The presence or absence of ceiling fans in the corridor would also have to be taken into consideration.
ACKNOWLEDGEMENTS
This study was conducted as a joint research project between the Correctional Service of Canada and the National Research Council of Canada. The authors wish to acknowledge CSC staff and Collins Bay Institution for logistic support.
REFERENCES
1. Canadian Commission on Building and Fire Codes, National Building Code of Canada, 1995 Edition, National Research Council of Canada, Ottawa, ON, 1995. 2. NFPA 101, Life Safety Code, National Fire Protection Association, Quincy, MA,
2003.
3. Fire Losses in Penitentiaries (1995-2000), Private Correspondence provided by Human Resources Development Canada, Ottawa, ON, 2002.
4. National Summary of Reported Fire Losses for Correctional Service of Canada (1996-2001), Private Correspondence provided by the Correctional Service of Canada, Ottawa, ON, 2002.
5. Cote, A.E. (Ed.), Fire Protection Handbook (18th Edition), National Fire Protection Association, Quincy, MA, 1997.
6. Technical Bulletin 121 – "Flammability Test Procedure for Mattresses for Use in High-Risk Occupancies, California Bureau of Home Furnishings and Thermal Insulation," North Highlands, CA.
7. OSHA-Regulated Hazardous Substances, Occupational Health and Safety Administration (USA), Noyes Data Corporation, Park Ridge, IL, 1990.
8. Su, J.Z.; Taber, B.C.; Carpenter, D.W., Experiments of Smoke Detector Response in Prison Facilities, Research Report IRC-RR-182, Institute for Research in Construction, National Research Council Canada, November, 2004
9. Smoke Detectors in CSC Facility Cells, Prepared for the National Research Council of Canada, by Ken Richardson Fire Technologies Inc., Ottawa, ON, June 2002.