Publisher’s version / Version de l'éditeur:
Vous avez des questions? Nous pouvons vous aider. Pour communiquer directement avec un auteur, consultez la première page de la revue dans laquelle son article a été publié afin de trouver ses coordonnées. Si vous n’arrivez pas à les repérer, communiquez avec nous à PublicationsArchive-ArchivesPublications@nrc-cnrc.gc.ca.
Questions? Contact the NRC Publications Archive team at
PublicationsArchive-ArchivesPublications@nrc-cnrc.gc.ca. If you wish to email the authors directly, please see the first page of the publication for their contact information.
https://publications-cnrc.canada.ca/fra/droits
L’accès à ce site Web et l’utilisation de son contenu sont assujettis aux conditions présentées dans le site LISEZ CES CONDITIONS ATTENTIVEMENT AVANT D’UTILISER CE SITE WEB.
Research Paper (National Research Council of Canada. Division of Building
Research); no. DBR-RP-381, 1968-11
READ THESE TERMS AND CONDITIONS CAREFULLY BEFORE USING THIS WEBSITE. https://nrc-publications.canada.ca/eng/copyright
NRC Publications Archive Record / Notice des Archives des publications du CNRC : https://nrc-publications.canada.ca/eng/view/object/?id=9d0587c4-0639-4730-8caa-413462bc9f7c https://publications-cnrc.canada.ca/fra/voir/objet/?id=9d0587c4-0639-4730-8caa-413462bc9f7c
NRC Publications Archive
Archives des publications du CNRC
This publication could be one of several versions: author’s original, accepted manuscript or the publisher’s version. / La version de cette publication peut être l’une des suivantes : la version prépublication de l’auteur, la version acceptée du manuscrit ou la version de l’éditeur.
For the publisher’s version, please access the DOI link below./ Pour consulter la version de l’éditeur, utilisez le lien DOI ci-dessous.
https://doi.org/10.4224/40001532
Access and use of this website and the material on it are subject to the Terms and Conditions set forth at
Determining the temperature history of concrete constructions
following fire exposure
no.
381
c . 2
NATIONAL RESEARCH COUNCIL OF CANADA
CONSEIL NATIONAL DE RECHERCHES DU CANADA
DETERMINING THE TEMPERATURE
HISTORY OF CONCRETE CONSTRUCTIONS
FOLLOWING FIRE EXPOSURE
by
T.
2.
Harmathy
Authorized reprint from copyrighted
JOURNAL of the AMERICAN CONCRETE INSTITUTE Vol. 65, No. 11, November 1968
Research Paper No. 381
of the
Division of Building Research
OTTAWA
November 1968
Determining the Temperature
History of Concrete Constructions
Following Fire Exposure
By T. Z. HARMATHY
With the use of thermogravimetry and dilatom- etry the maximum temperatures attained a t vari- ous locations in a concrete construction during a
fire can b e determined, i f samples of the concrete can be o'btained within I or 2 days of the fire. Keywords: cement pastes; concretes; dehydra- tion, dilatometry; fires; high temperature; port- land cements; research; temperature; thermo- gravimetry.
THE QUESTION OF whether a concrete construc-
tion should be replaced, at least partially, follow- ing a fire exposure comes up from time to time among people responsible for the safety of build- ings. In answering this question some guidance may be obtained from a number of papers which discuss the behavior of concrete and concrete constructions in fire.lJThe specific role that the concrete plays in a particular construction is, of course, of primary importance. In general, how- ever, its loss of strength due to fire exposure is the main cause of worry. I t is known that the strength of portland cement paste is not signifi- cantly affected by temperatures up to about 200 C (392 F) .3-5 Nevertheless, there has been no way
to determine whether the temperature of any part of the concrete reached or exceeded this critical level.
Studies have been conducted in this laboratory to develop simple techniques for determining the temperature history of concrete after fire ex- posure. In this paper some results of this work are reported.
ACI member 1. Z. Harmathy has been research officer, Fire Section, Division of Building Research, National Research Coun- cil of Canada, Ottawa, since 1958. He obtained a degree in mechanical engineering from the Budapest University of Technology in 1946, and a Doctor of Engineering degree from the Vienna University of Technology in 1967. Dr. Harmathy's current research includes investigating the physical properties of building materials at elevated temperatures and the behavior of building elements in fire. He is a member of ACI Com- mittee 216, Fire Resistance and Fire Protection of Structures.
THEORETICAL CONSIDERATIONS
There are hardly any building materials which remain physicochemically stable at such high temperatures as they may attain during a fire exposure. The reactions* that develop a t elevated temperatures are more often than not irreversi- ble, or at least such that the reverse reactions proceed a t extremely low rates.
Hydrated portland cement paste is an especially notable material from this viewpoint. Under normal atmospheric conditions, this material is formed by hydration from finely ground portland cement. The most important product of the hy- dration reactions is a tobermorite-like gel, which forms from the tricalcium silicate and p-dicalci- um silicate components of the ~ e m e n t . ~ . ~ . ~ In ad- dition, the paste contains a large number of other not easily identifiable hydrates formed from some other components of the cement, some fairly well developed Ca (OH) crystals, and some anhydrous residues of the cement.
When the cement paste is heated, the dehydra- tion of Ca (OH)2 (taking place generally be- tween 400 and 600 C or 752 and 1112 F) 9 ~ 1 0 is easily
recognizable from a rapid weight loss or shrink- age indicated by thermogravimetric and dila- tometric tests.' In contrast, the other dehydration reactions occur more or less gradually, starting as soon as (or even before) the desorption of the evaporable water is completed and proceed- 'ing at temperatures up to more than 800C (1472F). Thus, portland cement paste can be idealized as a mixture of an infinite number of hydrates in which the water molecules are held by bonds of strengths varying in infinitesimal
steps.
The final products that form from the tober- morite-like gel after the completion of all de-
*The w o r d reaction is used h e r e In a general sense, meanlng a n y physicochem~cal change whlch 1s accompanied by absorption
Or evolution of energy. ?These experimental
handbooks a n d papers. See, f o r example, References techniques a r e described in 11 numerous a n d 12.
hydration reactions consist mainly of (3-wolla- stonite and (3-dicalcium silicate. ' T h e r e are also present a number of other dehydration products as well as some residues of the original anhy- drous components of the cement.
Since all dehydration reactions are more or less irreversible, the heating of the cement paste can be construed as a process of chemical stabiliza- tion. In other words, once the paste was heated, to, say, 500 C (932 F ) , it acquires (ideally, at least) unique physicochemical characteristics in- trinsic to that "modification" of the paste which is formed in the sequence of reactions ending a t 500 C, and will henceforth retain these character- istics as long as its temperature remains below 500 C.
As reactions of this kind are always accom- panied by loss of weight and also, usually, by shrinkage, either thermogravimetry or dilatome- try can be used to determine the temperature in- terval of the physicochemical stability brought about by the heating of the paste. For example, the thermogravimetric curve of the above-de- scribed "modification" of the paste will be rep- resented by a horizontal line and the dilatometric curve by a nearly straight, upward sloping line, up to 500 C. If this modification is heated beyond the upper temperature limit of its stability (500 C ) , it will be subject to further reaction that will show up as a further decrease of weight in thermogravimetric tests or as a substantial change in the tangent to the thermal expansion curve in dilatometric tests.
Unfortunately, the dehydration reactions of portland cement paste, like such reactions in general, are rather sluggish; therefore, the re- action temperatures (and also the accompanying property changes) are subject to significant shifts, dependent on the rate of heating employed in the tests (see, for example, References 11 and 12). I t is also known that not all dehydration reac- tions of the cement paste are irreversible, al- though the rehydration reactions always develop at very low rates. Some ways of lessening the difficulties presented by these "non-ideal" char- acteristics of cement paste will be discussed in a subsequent section.
EXPERIMENTAL PROGRAM
From among the more than 100 thermogravi- metric and dilatometric tests only a few will be discussed in detail: those performed on a certain portland cement paste. The reason for selecting a portland cement paste for detailed discussion instead of a concrete follows clearly from the previous section. The cement paste is the com- ponent of the concrete that makes all these in- vestigations possible. The presence of the physi-
cochemicaliy more or iess inert aggregates in the concrete tends to mask certain definite features of the thermogravimetric or dilatometric curves, although this masking is never so significant as to result in entirely false conclusions.
A Type I portland cement of 2890 cm2/g specific surface was used. Its chemical analysis and cal- culated compound composition are reported else- where." Standard cylinders 6 x 12 in. (15 x 30 cm) were prepared with two parts (by weight) of portland cement and one part (by weight) of dis- tilled water. The cylinders were immediately transferred to a fog chamber for maturing. They were kept there for 28 days, and then stored on a shelf under normal atmospheric conditions for 4 years.
The test samples were cut from the inner 4 x 8- in. (10 x 20 cm) core of these cylinders. The amount of material to be subjected to thermo- gravimetric analysis was crushed and ground. All samples were dried in an oven at 105t0.5 C (221
*
1 F ) for 24 h r then put, in this "refer- ence condition," in a desiccator containing Mg (C104)2.
2H20, for storage. A few samples were later tested in this condition. The others were, one by one, subjected to a further 24-hr heating at 200, 400, 500 or 600 C (392, 752, 932 or 1112 F ) . These heat-treated samples were tested within 30 min of their removal from the furnace.;The apparatus used in the thermogravimetric studies consisted of an automatic electrobalance made by an American manufacturer, a vertical cylindrical furnace with temperature program controller, and an X-Y recorder. The test sample, 500-mg (0.018 oz) ground material, was suspended on a noble metal pan inside the hangdown tube of the electrobalance. The furnace was subse- quently jacked up to surround the tube. The tem- perature of the furnace was programmed to rise at a constant rate, 5 C/min (9 F/min) or 0.5 C/ min (0.9 F/min)
.
The measurement of the speci- men temperature was done by a fine thermo- couple, with the hot junction located inside the hangdown tube close to the suspended specimen. The X-Y plotter recorded the output from the electrobalance against the signal from the speci- men thermocouple.The dilatometric apparatus consisted of a hori- zontal dilatometer-furnace assembly, made to the design of the British Ceramic Research As- sociation by a British manufacturer, a furnace temperature program controller, and an X-Y re- corder. The basic dilatometer had been modi- fied slightly in the author's laboratory to make it suitable for automatic operation. A sample of
*Other cements may yield somewhat different thermogravi- metric and dilatometric curves; nevertheless the actual shape of these curves 1s immaterial from the viewpoint of these investi- gations.
;As explained in References 11 and 12, in these tests the sample is heated at some constant rate while its change of weight or expansion (or shrinkage) is re'corded.
the material
3
in. (7.62 cm) long and aboutl/i x
Y2
in. (1.3 x 1.3 cm) square represented thetest specimen, which was located horizontally inside a silica glass tube. This tube was subse- quently surrounded by the cylindrical furnace, which was movable on rails. The expansion or shrinkage of the test specimen was transferred to a displacement transducer by a silica glass rod. The temperature of the furnace was programmed to rise at 5 C/min (9 F/min). The specimen tem- perature was measured by a thermocouple with the hot junction introduced into the specimen through a small hole near its center. Again, the output from the transducer was recorded against the signal from the specimen thermocouple by the X-Y plotter.
EXPERlMENfAL RESULTS
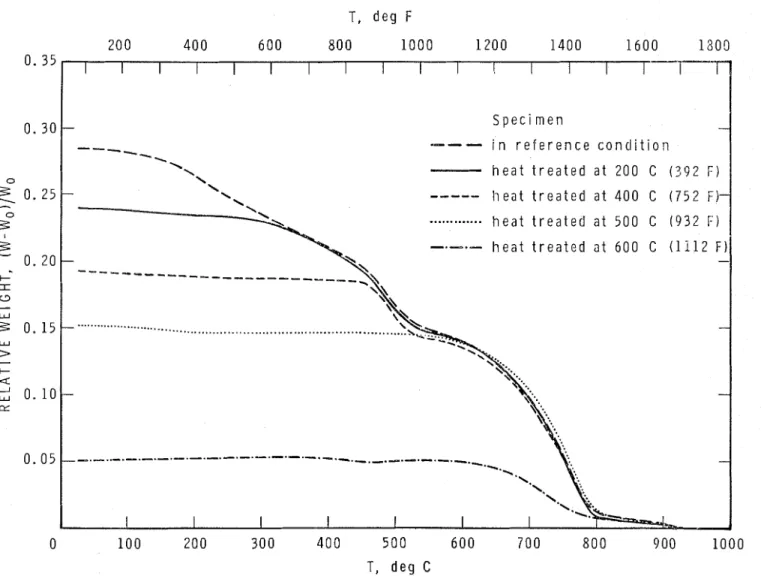
The results of the thermogravimetric tests ob- tained at a rate of heating of 5 C/min (9 F/min) are summarized in Fig. 1 and those obtained at 0.5 C/min (0.9 F/min) in Fig. 2. In preparing these plots the weight of the final decomposition products at 1000 C (1832 F) was used as the ref- erence weight, W,.
A comparison of Fig. 1 and 2 reveals that, as expected, with lowering of rate of heating all re- actions shift to lower temperatures. This shift averages about 50 C (90 F ) below 500 C (932 F ) and about 100 C (180 F) above 500 C (932 F ) .
The curves representing heat-treated cement paste samples are not perfectly horizontal up to the temperature of heat treatment in either Fig. 1 or Fig. 2. A small decline of these curves with rising temperature is probably due to the de- hydration of a small amount of water that may have been picked up by the powder during its installation in the electrobalance. It is also seen that there is no sharp break in the curves a t the temperatures of previous heat treatment. The reason is that the rate of the reactions is an in- creasing monotonic function of the temperature. Therefore, during the 24-hr heating not only those reactions for which the reaction temperature is below the temperature of heating developed to more or less completion, but to various degrees also some of those for which reaction tempera- tures are slightly above heating temperature.
Above the temperature of previous heating, the various curves join fairly closely the thermo- T, deg
F
.-
- -
i n r e f e r e n c e c o n d i t i o n heat t r e a t e d at 2 0 0 C (---
heat t r e a i e d at 400 C (...
---____
- - - I - _ _ _ _ ......
_._.-._._._.-.-.-.-.-.-.-.---.-
.-._._.-.-.-.-.-.
0 10 0 200 300 4 0 0 5 0 0 6 0 0 7 0 0 8 0 0 900 1000 T, deg CFig. I-Thermogravimetrlc curves o f a portland cement paste and some o f i t s "modifications;" rate o f heating:
5 C / m i n (9 F/min)
TABLE I-Temperatures o f heat treatment of hydrated portland cement samples*
' A c t u a l values compared w i t h t h o s e evaluated f r o m t h e r m o - gravimetric and dllatometric t e s t s .
gravimetric curve of the reference specimen. The temperatures at these joining points are listed and compared with the temperatures of heat treatment in Table 1.
The temperatures estimated from the joining points show a better agreement with the actual temperatures of heat treatment when the tests are carried out very slowly, as in the test at 0.5 C/ min (0.9 F/min) heating. This is not surprising in view of the length (24 hr) of heat treatment. Naturally, during a fire exposure no part of a
- -
A c t u a l v a l u e s
C ( F )
concrete
structure
will receive heat for such a long period. Nevertheless, especially a few inches away from the surfaces, the temperature may stay for several minutes close to its maxi- mum value. This is long enough to produce a modification not too different from that which would result after 24-hr heating. I t seems plausi- ble, therefore, that to obtain a fair estimate of the maximum temperature attained by concrete in fire, it is necessary to carry out the thermo- gravimetric tests at as low rates of heating as are practicable. But even with 0.5 C/min (0.9 F/min) heating this temperature will probably be somewhat overestimated up to about 500 C,(932 F) and may be significantly overestimated above this temperature.
The results of the dilatometric tests a r e shown in Fig. 3. All curves have been plotted with a reference length, l , , of 3 in. (7.62 cm). As dis- cussed earlier, the previous heat treatment re- sults in a quasi "physicochemical stabilization" of the cement paste, which shows up in the ab- sence of sagging or declining sections in the dilatometric curve up to the temperature of heat treatment. Consequently, the temperature at
T, deg F 2 0 0 4 0 0 6 0 0 800 1000 1200 1400 1600 1800 0. 35 V a l u e s , in C ( F ) , derived f r o m Specimen
---
i n r e f e r e n c e c o n d i t i o n heat t r e a t e d at 200 C ( 3 9 2 F )---
heat t r e a t e d at 400 C (752 F )-.-.-
heat t r e a t e d at 6 0 0 C (1112 F )-.-.-.
-.-.-.-.-.-.-.-.-.-._._.
T h e r m o g r a v i m e t r i c t e s t s - A t 5 C / m i n A t 0.5 C / m i n ( 9 F / m i n ) (0.9 F / m l n ) heating heating 0 100 200 3 0 0 4 0 0 5 0 0 6 0 0 7 0 0 8 0 0 9 0 0 1000 T, deg C Dilatolnetric t e s t s At 5 C / m i n ( 9 F / m i n ) heatingFig. 2 - T h e r m ~ ~ r a v i m e t r i c curves o f a portland cement paste and some o f i t s "modifications;" rate o f heating:
which a definite sagging is first observed can be taken as the estimated temperature of previous heating.
In Table 1 the temperatures of heat treatment estimated on this basis are also listed. All esti- mates obtained from dilatometric tests are more a c c u r a t e than those based on thermogravi- metric tests carried out a t the same rate of heat- ing (5 C/min or 9 F/min), and for the 600 C (1112 F ) run even more accurate than that based on thermogravimetric tests a t 0.5 C/min (0.9 F/min) heating. This finding, plus the fact that solid state reactions cannot be detected by ther- mogravimetry, place dilatometry ahead of other possible methods in similar investigations.
specimen. Nevertheless, a reference test may sometimes help in arriving a t more accurate estimates. It is thus recommended that a sample of the concrete also be taken from a location not exposed to elevated temperatures.
The two main advantages of thermogravimetry in such investigations are that (1) very small samples are required, and it is easier to relate the result of the investigation to a well defined location in the construction, and (2) the sample is used in powdered form, making it possible to remove from it the coarse aggregate which only tends to obscure the clarity of the conclusions. Yet, whenever possible, one should strive to ob- tain samples for dilatometry and to procure a sample from some area not affected by the fire.
DISCUSSION OF RESULTS If a-sample of substantial size can be taken from
the concrete, it is advisable to cut the dilato-
As the that take place metric samples out of the big sample and
to
dryin the cement paste during fire exposure are not
them after cutting without delay in an oven a t all irreversible, it is extremely important to ob-
tain test samples from the concrete construc- 105 C (221 F ) and then to keep them in a desicca- tion as soon as possible after the fire and to keep tor until the scheduled testing. The dilatometric these samples in a desiccator until tested. samples should always be cut with their axes
From Fig. 1, 2, and 3 it appears that fairly ac- parallel to the surface affected by the fire.
curate temperature estimates can be obtained With the aid of several such thermogravimetric even without carrying out tests on a reference or dilatometric specimens, taken a t various dis-
T, d e g F 2 0 0 4 0 0 6 0 0 8 0 0 1000 1200 1400 1600 1800 t 1 . 0 I I I I I I I I 1 1 I I I 1 I I
-
/.-.-.-.
.
.
-. \.\.
'+--.
s
-\.
---
h'.
\ h ' \ \ \ - \ -. \ \ \ \ \ \ \ \ --
S p e c i m e n \ \---
i n r e f e r e n c e c o n d i t ~ o n \ \ h e a t t r e a t e d a t 2 0 0 C ( 3 9 2 F ) \-
---
h e a t t r e a t e d a t 400 C ( 7 5 2 F ) '+\-
-.-.-
h e a t t r e a t e d a t 6 0 0 C (1112 F ) I 1 I I T, d e g CFig. 3-Dilatometric curves o f a cement paste a n d o f some o f its "modifications;" rate of heating: 5 C/min ( 9 F/min)
tances from the surface of exposure, the pattern of heat penetration into the concrete construction during a fire can be conveniently studied.
C O N C L U S I O N S
1. If samples of the concrete can be procured within 1 or 2 days of the fire, the maximum temperatures attained a t various locations in a concrete construction during the fire exposure can be determined.
2. Among the commonly used scanning tech- niques, thermogravimetry and dilatometry proved especially suitable for such investigations.
3. These investigations make use of the fact that, upon heating, the cement paste undergoes a continuous sequence of more or less irreversible decomposition reactions; thus a once heated piece of it will behave for some time as a stable material up to the temperature of heating.
4. The cement paste is that component of the concrete which makes these investigations pos- sible. The presence of aggregates in the concrete tends to mask certain features of the thermo- gravimetric and dilatometric curves but, as a rule, does not affect significantly the accuracy of the conclusions.
A C K N O W L E D G M E N T
The thermogravimetric and dilatometric tests were performed by Mr. J. R. McKellar. This paper is a contribution of the Division of Building Research, National Research Council of Canada, and is published with the approval of the Di- rector of the Division.
APPENDIX
NOTATION
1 = length of dilatometric specimen at temperature
m
lo = reference length in plotting dilatometric data: length of the respective "modification" (ob- tained by heating) a t room temperature W = weight of thermogravimetric specimen a t tem-
perature T
Wo = reference weight in plotting thermogravimetric data: weight (of any modification) at 1000 C
(1832 F )
REFERENCES
1. Smith, P., "Investigation and Repair of Damage to Concrete Caused by Formwork and Falsework Fire." ACI JOURNAL, Proceedings V. 60, No. 11, Nov. 1963, pp. 1535-1566.
2. ACI Committee 216, Symposium on Fire Resistance of Concrete, SP-5, American Concrete Institute, Detroit, 1962, 88 pp.
3. Seamann, J. C., and Washa, G. W., "Variation of
Mortar and Concrete with Temperature,"
ACI JOURNAL, Proceedings V. 54, No. 5, Nov. 1957, pp. 385-396.
4. Zoldners, N. G., "Effect of High Temperatures on Concretes Incorporating Different Aggregates," Pro- ceedings, ASTM, Philadelphia, V. 60, 1960, pp. 1087-1108. 5. Harmathy, T. Z., and Berndt, J. E., "Hydrated Port- land Cement and Lightweight Concrete a t Elevated Temperatures," ACI JOURNAL, P r o c e e d i ~ ~ g s V. 63, No. 1, Jan. 1966, pp. 93-112.
6. Kalousek, G. L., and Prebus, A. F., "Crystal Chem- istry of Hydrous Calcium Silicates, P a r t 111," Journal, American Ceramic Society, V. 41, No. 4, Apr. 1958, pp. 124-132.
7. Brunauer, S., and Greenberg, S. A., "The Hydration of Tricalcium Silicate and P-Dicalcium Silicate at Room Temperature," Proceedings, Fourth International Sym- posium on the Chemistry of Cement, Washington, D. C., V. 1, 1960, pp. 135-165 (National Bureau of Standards, Mo?~ogmplz 43, Aug. 1962).
8. Taylor, H. F. W., "The Chemistry of Cements," Research, V. 14, No. 4, Apr. 1961, pp. 154-158.
9. Lea, F. M., and Jones, F. E., "The Rate of Hydra- tion of Portland Cement and Its Relation to the Rate of Development of Strength," Journal, Society of t h e Chemical Industry, V. 54, 1935, pp. 63-70.
10. Petzold, A., and Talke, I., "Zur Differential- thermoanalyse erhartender Portlandzemente," Silikat Technik (Berlin), V. 11, No. 3, 1960, pp. 122-125.
11. Duval, C., I ~ ~ o r g a n i c Thermogravimelric AnallJsis, Elsevier Publishing Co., Amsterdam, 1953.
12. Paguin, P., "Contribution a la DCtermination de Certains MinCroux Argileux par DilatomCtrie Essais Quantitatifs," SocietC f r a n ~ a i s e de ceramique, Paris, Memoire, No. 58, Jan.-Mar. 1963.
13. Bogue, R. H., The Chemislrl~ of Portland Cement, Reinhold Publishing Corp., New York, 2nd Ed., 1955, p. 526.
This paper was received b y the Iiistitute Feb. 8, 1968.
; Sinopsis
-
Resume-
ZusammenfassungDeterrninando la Historia de Ternperatura d e Construcciones de Concreto Despuest de haber sido
Expuestas a l Fuego
Con el uso de la 1,ermogravimetria y l a dilatometria se puede determinar las temperaturas mhximas obtenidas en varios lugares de una construcci6n durante un fuego, si se pudieran obtener muestras de concreto dentro de uno o dos dias despuCs del fuego.
DGterrnination du Comportement Suivant I'Evolution de Temperature, de Constructions e n
Beton Apres u n lncendie
Avec l'utilisation d e thermogravimCtrie et de dilatometrie les tempPratures maximum atteintes B
diffCrents points d'une construction en bCton durant un incendie peuvent Etre dCterminCes, si des Cchantillons de bCton peuvent Etre obtenus dans les 1 5 2 jours
suivant l'incendie.
D i e Bestirnrnung des Temperaturverlaufes in einem Betonbauwerk nach einem Brand
Mit Hilfe von thermographische und dilatometrische Methoden konnen die Hochsttemperaturen, die wahrend eines Brandes in einem Betonbauwerk an verschiedenen Stellen entstehen, bestimmt werden. Dazu ist es erforderlich, ein oder zwei Tage nach dem Brand Betonproben zu entnehmen.
This publication is being distributed by the Division of Building Research of the National Research Council. I t should not be reproduced in whole or in part, without permission of the original publisher. The Division would be glad to be of assistance in obtaining such permission. Publications of the Division of Building Research may be obtained by mailing the appropriate remittance, (a Bank, Express, or Post Office Money Order or a cheque made payable at par in Ottawa, to the Receiver General of Canada, credit National Research Council) to the National Research Council, Ottawa. Stamps are not acceptable.
A list of all publications of the Division of Building Research is avail- able and may be obtained from the Publications Section, Division of Building Research, National Research Council, Ottawa, Canada.
ETABLISSEMENT QU QIAGRAMME QE TEMPERATURE
D90UVRAGES EN BETON EXPOSES A UN INCENQIE
SOMMAIRE
L'auteur expose l'utilisation des mkthodes de thermogravimktrie et de dilatomktrie pour determiner les tempkratures maximales atteintes en divers points d'un ouvrage en bkton expos6 a un incendie par l'examen d'kchantillons de bkton moins de un a deux jours aprhs l'incendie.