Publisher’s version / Version de l'éditeur:
Vous avez des questions? Nous pouvons vous aider. Pour communiquer directement avec un auteur, consultez la première page de la revue dans laquelle son article a été publié afin de trouver ses coordonnées. Si vous n’arrivez pas à les repérer, communiquez avec nous à [email protected].
Questions? Contact the NRC Publications Archive team at
[email protected]. If you wish to email the authors directly, please see the first page of the publication for their contact information.
https://publications-cnrc.canada.ca/fra/droits
L’accès à ce site Web et l’utilisation de son contenu sont assujettis aux conditions présentées dans le site LISEZ CES CONDITIONS ATTENTIVEMENT AVANT D’UTILISER CE SITE WEB.
Physical Review. A, Atomic, Molecular, and Optical Physics, 72, 5, 2005-11-23
READ THESE TERMS AND CONDITIONS CAREFULLY BEFORE USING THIS WEBSITE. https://nrc-publications.canada.ca/eng/copyright
NRC Publications Archive Record / Notice des Archives des publications du CNRC :
https://nrc-publications.canada.ca/eng/view/object/?id=b38e111d-64d0-44af-8dd1-000cfc1054fe
https://publications-cnrc.canada.ca/fra/voir/objet/?id=b38e111d-64d0-44af-8dd1-000cfc1054fe
NRC Publications Archive
Archives des publications du CNRC
This publication could be one of several versions: author’s original, accepted manuscript or the publisher’s version. / La version de cette publication peut être l’une des suivantes : la version prépublication de l’auteur, la version acceptée du manuscrit ou la version de l’éditeur.
For the publisher’s version, please access the DOI link below./ Pour consulter la version de l’éditeur, utilisez le lien DOI ci-dessous.
https://doi.org/10.1103/PhysRevA.72.052717
Access and use of this website and the material on it are subject to the Terms and Conditions set forth at
Imaging the time-dependent structure of a molecule as it undergoes
dynamics
Légaré, F.; Lee, Kevin F.; Litvinyuk, I. V.; Dooley, P. W.; Bandrauk, A. D.;
Villeneuve, D. M.; Corkum, P. B.
Imaging the time-dependent structure of a molecule as it undergoes dynamics
F. Légaré,1,2Kevin F. Lee,1,3I. V. Litvinyuk,1,4P. W. Dooley,1,3A. D. Bandrauk,2D. M. Villeneuve,1and P. B. Corkum1 1
National Research Council of Canada, Ottawa, Ontario, Canada K1A 0R6
2
Département de Chimie, Université de Sherbrooke, Sherbrooke, Québec, Canada J1K 2R1
3
Department of Physics & Astronomy, McMaster University, Hamilton, Ontario, Canada K1S 5P3
4
Department of Physics, Kansas State University, Manhattan, Kansas, 66506, USA
共Received 6 October 2004; revised manuscript received 24 August 2005; published 23 November 2005兲 We image the dynamics of diatomic and triatomic molecules with sub-5 fs and sub-Å resolution using laser Coulomb explosion imaging with 8 fs pulses. We obtain image information by measuring the vector momenta of all atomic ions produced by explosion of a single molecule. We image vibrating D2+ and of dissociating SO22+and SO23+. Images taken at 0 and 60 fs show that the dissociation of SO22+produces an SO+rotational wave packet.
DOI:10.1103/PhysRevA.72.052717 PACS number共s兲: 34.50.Gb, 33.80.Rv
Molecules have 3N-3 coordinates 共where N is the number of atoms兲 as well as time. Pump-probe spectroscopy 关1兴 takes a low-dimensional projection of this inherently multi-dimensional problem. Hidden from view in most ultrafast dynamics experiments are unobserved changes to the mo-lecular structure.
Measuring molecular structure requires that the wave-length of the probe is shorter than the wave-length of the chemical bonds. Electron diffraction 关2兴 can determine the structure of gas phase molecules. X-ray diffraction 关3兴 can measure crys-talline structures. Laser pump-probe techniques have high time resolution 关4兴 but they cannot measure structure be-cause of the long wavelength of optical photons. If the long wavelength photons could be converted into short wave-length particles 共electrons or ions兲, then high spatial resolu-tion could be combined with ultrafast temporal resoluresolu-tion. We use laser Coulomb explosion 关5–7兴 for the conversion, producing short wavelength ions 共 ⬍ 0.001 nm兲.
A Coulomb explosion triggered by a high-velocity colli-sion between a multi-MeV molecular ion and a thin foil was originally developed for measuring static molecular struc-tures 关8兴. Rapid ionization also occurs during collisions be-tween highly charged atoms and molecules 关9兴, or during Auger decay following the absorption of x rays 关10兴. These studies advanced the technology of coincidence imaging. By using few-cycle pulses and coincidence imaging, we achieve sub-5 fs and sub-Å resolution of vibration and dissociation dynamics.
We initiate dynamics in D2and SO2 by multiphoton ion-ization from a few-cycle pump pulse to D2+, SO22+, and SO23+. We image the time-dependent nuclear motion by laser Coulomb explosion imaging 共CEI兲. We choose D2+because of its extremely fast molecular motion 关11兴. We choose SO2n+ for three reasons. First, we demonstrate that even when multiple dissociation channels simultaneously occur, CEI allows each to be imaged. Second, we image unstable radical ions produced by rapid ionization, which are other-wise very difficult to measure. Finally, SO22+ has a specific dissociation channel, SO22+→ O++ S++ O that is observed when x ray absorption induces rapid double ionization. Nei-ther theory nor experiment has been able to determine if this
channel is concerted or sequential 关12兴. We show that both bonds break simultaneously 共concerted兲 when produced by rapid multiphoton ionization.
We generate the ⬃8 fs laser pulses by self-phase modu-lation of ⬃40 fs Ti:sapphire in an argon-filled hollow-core fiber and compression with chirped mirrors 关5兴. The pulse sits upon a ⬃5% intensity background lasting ⬃100 fs. To generate pump and probe with variable time delay, we use two pieces of 3-mm-thick fused silica: a 25-mm-diam annu-lus, and a 5-mm-diam disk which was the center of the an-nulus. The beam passing through the inner disk is the pump, and the outer beam is the probe. Rotating the annulus delays the probe with respect to the pump.
Our interaction chamber contains a uniform acceleration time-of-flight mass spectrometer 共240 mm ion flight length, 70 mm internal diameter兲, and a position-sensitive detector that can measure the velocities of up to eight fragment ions per shot 关5,13,14兴. The detector efficiency is ⬃50%. For the D2 experiments, the acceleration field is 100 V / cm and 250 V / cm for SO2. The molecules enter the interaction chamber in a low-density beam that is ⬃50m thick along the laser beam propagation direction. There is less then one molecule per laser shot in the focus. We now describe how laser CEI can be used to observe vibrational dynamics in D2+.
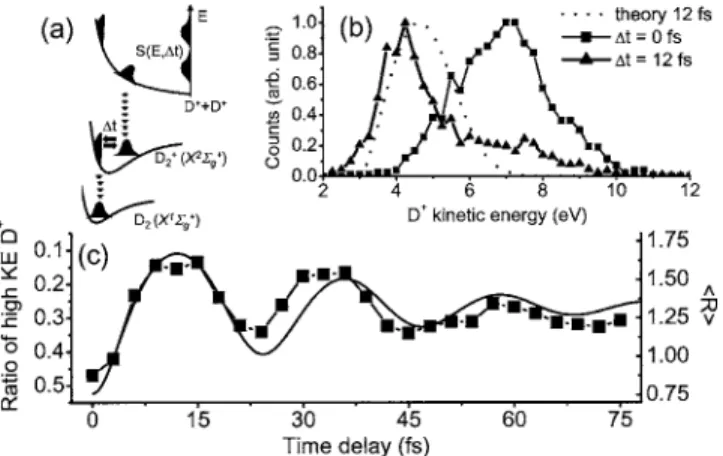
As illustrated in Fig. 1共a兲, ionization of D2 launches a vibrational wave packet in D2+. The pump intensity was
Ipump⬃ 3 ⫻ 1014W / cm2 and the probe intensity was
Iprobe⬃ 1 ⫻ 1015W / cm2. At Ipump⬃ 3 ⫻ 1014W / cm2, only single ionization to D2+X2⌺g+is possible, resulting in a well defined D2+wave packet. In addition, a significant fraction of molecules is ionized at this intensity. We only analyze data for molecules that are within 10° of being perpendicular to the laser polarization.
Figure 1共b兲 shows the kinetic energy spectrum of the D+ fragments. Zero and 12 fs correspond to times of the smallest and largest expected bond length. The fragments in Fig. 1共b兲 have lower kinetic energy when the wave packet is probed at 12 fs than when it is probed at 0 fs. The high-energy tail in the experimental 12 fs spectrum is due to molecules that were not ionized by the pump pulse.
greater than 7 eV over total D+counts 共squares, left axis兲 as a function of the delay. We choose 7 eV because the ⌬t = 0 fs spectrum peaks at this value. We follow the wave packet motion for 75 fs until it has mostly dephased. At longer time delays, beyond the reach of our 3-mm-thick disk/ 共annulus兲 delay stage, we expect the wave packet to revive. A clear oscillation of fragment kinetic energy is vis-ible, tracing the ultrafast dynamics of D2+.
For fragments parallel to the laser polarization, the agree-ment is only relatively good for delays less than 12 fs. At longer times, the strong parallel coupling between the A2⌺u+ and X2⌺g+induced by the 5% background intensity of the probe pulse affects the wave packet motion. By choosing angles between 80° and 100° to laser polarization, this back-ground has almost no effect on the wave packet motion.
We compare our experimental results with a simulation. We project the ground state wave function of D2 onto the D2+X2⌺g+ surface, solve the time-dependent Schrödinger equation, and then project the wave packet onto the Coulomb potential. In Fig. 1共b兲, the dotted curve is the predicted spec-trum at 12 fs. The solid line in Fig. 1共c兲 shows the average internuclear distance 共具R典, right axis兲 as a function of time on the X2⌺g+surface. The ⬃24 fs vibration period and ⬃60 fs dephasing time in Fig. 1共c兲 are consistent with our knowl-edge of the D2+X2⌺g+state.
We now turn our attention to SO2. A pump pulse, Ipump ⬃ 1 ⫻ 1015W / cm2, removes up to three electrons from the SO2 producing doubly and triply charged molecules. This launches a set of dissociative wave packets on both charge states. Since they dissociate, we can record the velocity vec-tors of all fragment ions produced by the pump alone. We identify five photodissociation channels: 共SO23+→ O++ S+ + O+兲; 共SO 2 3+ → SO2++ O+兲; 共SO2 2+ → SO++ O+兲; 共SO22+→ O++ S++ O兲, and 共SO
2 2+
→ S++ O2
+兲. The three most probable channels are italicized.
A probe pulse, Iprobe⬃ 5 ⫻ 1015W / cm2, explodes the dis-sociating molecules that were prepared by the pump. We observe charge states up to SO210+. We only analyze events where all three fragments from the molecule 共Si+, Oj+, and Ok+兲 are captured. To guard against false coincidences, we require that the momentum sum of the three detected ions is less than 1 ⫻ 10−22kg m / s. Fewer then 5% of the events are false coincidences.
A major question in the photochemistry of three-body dis-sociation is whether the process is concerted or sequential. Do the two bonds of SO2n+ 共n = 2; SO22+
→ O++ S++ O;
n= 3: SO22+→ O++ S++ O+兲 break simultaneously? We can resolve this question for SO2n+ with information from the explosion channel SO27+→ O2++ S3++ O2+. If both O2+ frag-ments have similar energy, we can conclude that the channel probed by the CEI is a concerted three-body breakup, if not, the dissociation is sequential.
Figure 2共a兲 presents the correlation map of the O2+-O2+ kinetic energy. The 0 fs image was obtained by the CEI of SO2at its equilibrium position. At ⌬t = 220 fs, the correlation map has broken into three distinct peaks; the low energy part that lies along the diagonal 共E1= E2⬃ 9 eV兲, and two off diagonal peaks 共E1⬃ 7 eV, E2⬃ 36 eV兲. The labeling of O2+ as 1 or 2 is determined by which ion strikes the detector first. A background due to the CEI of nonexcited SO2 has been subtracted from all maps 共except 0 fs兲.
Figure 2共a兲 shows dynamics along the diagonal towards the lower energy as a function of time delay. Dynamics into diagonal indicates concerted three-body break up. An off di-agonal dynamics appears 30 fs after ionization and becomes well separated at longer times. For the off-diagonal peaks of Fig. 2共a兲, the oxygen with high energy was still bonded to the sulfur, while the low energy oxygen came from the dis-sociating bond. At long delays, 共e.g., ⌬t = 220 fs兲 the disso-ciating oxygen is far from the sulfur, and receives negligible energy from the CEI. When we compare the O2+energy after the CEI at ⌬t = 220 fs with the energy of the O+coming from the dissociation of SO22+→ SO++ O+ when only the pump laser is on, we confirm that the asymmetric features in Fig. 2共a兲 are from SO22+ions as they dissociate to SO++ O+. We distinguish with femtosecond resolution concerted three-body break up from asymmetric dissociation.
There are actually two concerted channels, seen in Fig. 2共b兲. The channels show up as two isolated peaks when the angle between the velocity vectors of the O2+fragments 共␣兲 is plotted as a function of the total energy for the events on the diagonal of Fig. 2共a兲 at ⌬t = 220 fs. For the same reason as mentioned above, by choosing a long delay of 220 fs, we can compare the CEI data to the measurements with only the pump pulse. The narrower distribution, with an average en-ergy of ⬃27.5 eV, has an ␣ distribution corresponding to SO23+→ O++ S++ O+. The broader distribution, with an aver-age energy of ⬃22.5 eV, has an␣distribution corresponding to SO22+→ O++ S++ O 共we determine the momentum of the unobserved O fragment by momentum conservation with the measured O+ and S+ from data where only the pump pulse interacts with SO2兲. Thus, we confirm that SO23+→ O++ S++ O+ is concerted 关12兴 and find that SO22+→ O++ S++ O breakup is also concerted.
The CEI is an imaging technique. So far, we have used FIG. 1. 共a兲 Potential energy surface of D2
n+
sketching the con-cept of the experiments. 共b兲 D+ kinetic energy 共KE兲 spectra for a pump-probe delay of 0 fs 共square兲 and 12 fs 共triangle兲. The dotted curve is the expected kinetic energy spectrum for ⌬t = 12 fs. 共c兲 Ratio of high KE D+ is the total number of D+ counts having KE⬎ 7 eV divided by total D+ counts 共square兲. Calculated time-dependent average internuclear distance 共具R典 in Å兲 as a function of time on D2+X2⌺g+ 共solid line兲. Ipump⬃ 3 ⫻ 1014W / cm2,
Iprobe⬃ 1 ⫻ 1015W / cm2.
LÉGARÉ et al. PHYSICAL REVIEW A 72, 052717 共2005兲
partial information to identify and qualitatively describe dis-sociation channels. Figure 3 shows three images determined from the measured velocity vectors. Although randomly aligned in space, each SO2 ion explodes in a plane. There-fore, we can view all images in a single plane. We define the plane as follow: in all images, the center of mass of one SOn+bond is set at 共0,0兲. For asymmetric channels, we select the center of mass of the shorter bond. For concerted chan-nels, we choose SOn+randomly. For all images, the remain-ing oxygen ion position is set to Y = 0 and X positive. This defines the X axis. We define the Y axis by requiring that the sulfur ion have a component in the positive Y direction. With the plane defined, we turn to the data in Fig. 3. On the X axis of Fig. 3 we plot the distribution of position of the Y = 0 oxygen ion. To show some aspects of the correlation, the distribution in Fig. 3共b兲 is broken into three segments 共green, black, and blue兲 and the average of the two outer distribu-tions are shown as points. The lines connect the average positions.
The algorithm that we use to calculate structures assumes initial positions for each atom and uses classical motion on a Coulomb potential with zero initial velocities 关14兴. An itera-tive procedure converges on a structure that results in explo-sion velocities consistent with experimental results. For long
delays, our zero initial velocity assumption is not accurate, so the images in Fig. 3 are only for delays of 60 fs or less.
To minimize the effect of nonzero initial velocities, we use the highest charge state available, SO210+ for SO23+→ S++ O++ O+ and SO22+→ S++ O++ O. We estimate a spatial resolution of 艋1 Å and bond angle resolution of 15° for delays 艋45 fs. For the asymmetric channel, SO22+→ SO++ O+, there are insufficient SO2
10+
explosions, so we use SO27+. Similar spatial resolution is obtained for delays 艋60 fs since the wave packet motion on the doubly charged state is slower.
The upper plot of Fig. 3 shows the measured SO2 equi-librium structure 共⌬t = 0 fs兲 probed by a SO27+ explosion. The middle plot, taken at 60 fs, shows the asymmetric SO22+→ SO++ O+channel, also probed with SO
2
7+. The bot-tom, taken at 45 fs, shows the image of three-body breakup channels probed by SO210+explosions.
The ⌬t = 0 fs image 关Fig. 3共a兲兴 has R1= R2⬃ 1.7 Å and an FIG. 2. 共Color兲 共a兲 O2+energy-energy correlation map. The final
charge state is SO27+→ O2++ S3++ O2+共the map is on a logarithmic scale兲. 共b兲 Velocity angle vs total kinetic energy 共eV兲 for pump-probe delay of 220 fs 共the map is on a linear scale兲.
Ipump⬃ 1 ⫻ 1015W / cm2, Iprobe⬃ 5 ⫻ 1015W / cm2.
FIG. 3. 共Color兲 共a兲 Structure of SO2at ⌬t = 0 fs 共final charge state is SO27+→ O2++ S3++ O2+兲. 共b兲 Structure of SO2
2+undergoing asymmetric dissociation 共SO22+→ SO++ O+兲 at ⌬t = 60 fs. Blue: av-erage structure for bond angle ⬍50°. Green: avav-erage structure for bond angle ⬎75° 共final charge is SO27+→ O2++ S3++ O2+兲. 共c兲 Structure of SO2 in the concerted dissociation channel at ⌬t = 45 fs, also shown is the equilibrium structure of SO2 共final charge is SO210+→ O3++ S4++ O3+兲. Ipump⬃ 1 ⫻ 1015W / cm2,
average O-S-O angle of 120°, close to the known 119° equi-librium angle and 1.43 Å bond distance 关15兴. By ⌬t = 60 fs 关Fig. 3共b兲兴, the average angle has decreased to ⬃70°, the unbroken bond distance has increased to 2 Å, and the atomic fragment has an average distance of ⬃3.7 Å from the center of mass of SO+. Figure 3共b兲 shows that the angle is smaller for more rapidly moving O+fragments 共longer distance from SO+ center of mass兲. Thus, we observe the rotational wave packet created when the angular momentum is transferred during asymmetric dissociation. Figure 3共c兲 shows the three-body breakup channels at ⌬t = 45 fs. At 45 fs, we cannot distinguish between the SO22+→ S + O++ O+ and the SO23+→ S++ O++ O+ channels. We measure R1= R2⬃ 4.1 Å and the average bond angle has decreased from 120° to 100°. Before concluding, it is important to discuss the accuracy of our measurements. The images in Fig. 3 come from the measured ion velocities. The main error comes from the pix-elization of the detector 共250m兲. This corresponds to an uncertainty in the velocity of ⬃250 m / s. In our experiments, a typical final velocity is on the order of 10 000 m / s. We estimate that such an experimental error can cause a bond angle error of 5° and a bond distance error of ⬃0.1 Å in Fig. 3.
In conclusion, our results show that current laser technol-ogy allows the dynamics of small molecules to be imaged in
time steps of 5 fs. The CEI allows a full image to be taken from each explosion. This single molecule imaging capabil-ity lets us follow a complex photochemical process—the asymmetric dissociation of SO22+—and distinguish it from concerted dissociation.
Looking ahead laser CEI will allow photochemical pro-cesses in small neutral molecules to be imaged frame by frame. Image quality will improve because of the lower en-ergy of neutral molecule dissociation and from using shorter, 3.4 fs explosion pulses 关16兴. 0.1 Å resolution images 关5,14兴 with ⬃2 fs between consecutive frames seems possible. In addition, laser CEI will allow statistical breakup to be aged, a process that is very important in chemistry. One im-portant issue in statistical breakup is the structure共s兲 that the molecule assumes it dissociates. By imaging one molecule at a time, laser CEI can distinguish molecules that are frag-menting during predissociation from the much more com-mon but less interesting molecules that are already frag-mented or are yet to fragment.
We thank Professor K. Yamanouchi 共University of Tokyo兲 for stimulating discussions. The authors appreciate financial support from the NSERC, the NRC/CNRS collaborative re-search fund, the CIPI, and the FQRNT.
关1兴 A. H. Zewail, J. Phys. Chem. A 104, 5660 共2000兲.
关2兴 H. Ihee, V. A. Lobastov, U. M. Gomez, B. M. Goodson, R. Srinivasan, C.-Yu Ruan, and A. H. Zewail, Science 291, 458 共2001兲.
关3兴 F. Schotte, M. Lim, T. A. Jackson, A. V. Smirnov, J. Soman, J. S. Olson, G. N. Phillips, Jr., M. Wulff, and P. A. Anfinrud, Science 300, 1944 共2003兲.
关4兴 T. Saito and T. Kobayashi, J. Phys. Chem. A 106, 9436 共2002兲. 关5兴 F. Légaré, I. V. Litvinyuk, P. W. Dooley, F. Quéré, A. D. Ban-drauk, D. M. Villeneuve, and P. B. Corkum, Phys. Rev. Lett.
91, 093002 共2003兲.
关6兴 K. Zhao, G. Zhang, and W. T. Hill, III, Phys. Rev. A 68, 063408 共2004兲.
关7兴 C. Beylerian and C. Cornaggia, J. Phys. B 37, L259 共2004兲. 关8兴 E. P. Kanter, P. J. Cooney, D. S. Gemmell, K.-O. Groeneveld,
W. J. Pietsch, A. J. Ratkowski, Z. Vager, and B. J. Zabransky,
Phys. Rev. A 20, 834 共1979兲. 关9兴 D. Mathur, Phys. Rep. 391, 1 共2004兲.
关10兴 A. De Fanis, N. Saito, M. Machida, K. Okada, H. Chiba, A. Cassimi, R. Dörner, I. Koyano, and K. Ueda, Phys. Rev. A 69, 022506 共2004兲.
关11兴 B. Feuerstein and U. Thumm, Phys. Rev. A 67, 063404 共2003兲.
关12兴 S. Hsieh and J. H. D. Eland, J. Phys. B 30, 4515 共1997兲. 关13兴 P. W. Dooley, I. V. Litvinyuk, Kevin F. Lee, D. M. Rayner, D.
M. Villeneuve, and P. B. Corkum, Phys. Rev. A 68, 023406 共2003兲.
关14兴 F. Légaré et al., Phys. Rev. A 71, 013415 共2005兲.
关15兴 CRC Handbook of Chemistry and Physics 共CRC Press, Boca Raton, 2003兲.
关16兴 K. Yamane, Z. Zhang, K. Oka, R. Morita, M. Yamashita, and A. Suguro, Opt. Lett. 28, 2258 共2003兲.
LÉGARÉ et al. PHYSICAL REVIEW A 72, 052717 共2005兲