Publisher’s version / Version de l'éditeur:
Canadian Acoustics, 35, September 3, pp. 136-137, 2007-09-01
READ THESE TERMS AND CONDITIONS CAREFULLY BEFORE USING THIS WEBSITE.
https://nrc-publications.canada.ca/eng/copyright
Vous avez des questions? Nous pouvons vous aider. Pour communiquer directement avec un auteur, consultez la première page de la revue dans laquelle son article a été publié afin de trouver ses coordonnées. Si vous n’arrivez pas à les repérer, communiquez avec nous à [email protected].
Questions? Contact the NRC Publications Archive team at
[email protected]. If you wish to email the authors directly, please see the first page of the publication for their contact information.
NRC Publications Archive
Archives des publications du CNRC
This publication could be one of several versions: author’s original, accepted manuscript or the publisher’s version. / La version de cette publication peut être l’une des suivantes : la version prépublication de l’auteur, la version acceptée du manuscrit ou la version de l’éditeur.
Access and use of this website and the material on it are subject to the Terms and Conditions set forth at
Measuring and predicting speech privacy in open-plan spaces
Bradley, J. S.
https://publications-cnrc.canada.ca/fra/droits
L’accès à ce site Web et l’utilisation de son contenu sont assujettis aux conditions présentées dans le site LISEZ CES CONDITIONS ATTENTIVEMENT AVANT D’UTILISER CE SITE WEB.
NRC Publications Record / Notice d'Archives des publications de CNRC:
https://nrc-publications.canada.ca/eng/view/object/?id=85c67bd5-2559-42ce-a495-af2d05fb18da https://publications-cnrc.canada.ca/fra/voir/objet/?id=85c67bd5-2559-42ce-a495-af2d05fb18da
http://irc.nrc-cnrc.gc.ca
M e a s u r i n g a n d p r e d i c t i n g s p e e c h p r i v a c y i n
o p e n - p l a n s p a c e s
N R C C - 5 0 0 7 5
B r a d l e y , J . S .
A version of this document is published in / Une version de ce document se trouve dans: Canadian Acoustics, v. 35, no. 3, Sept. 2007, pp. 136-137
The material in this document is covered by the provisions of the Copyright Act, by Canadian laws, policies, regulations and international agreements. Such provisions serve to identify the information source and, in specific instances, to prohibit reproduction of materials without
written permission. For more information visit http://laws.justice.gc.ca/en/showtdm/cs/C-42
Les renseignements dans ce document sont protégés par la Loi sur le droit d'auteur, par les lois, les politiques et les règlements du Canada et des accords internationaux. Ces dispositions permettent d'identifier la source de l'information et, dans certains cas, d'interdire la copie de
Measuring and Predicting Speech Privacy in Open-Plan Spaces
John S. Bradley
Institute for Research in Construction, National Research Council, Montreal Rd., Ottawa, K1A 0R6
Introduction
The acoustical design of an open-plan office should attempt to minimize the intelligibility and disturbance of unwanted speech from nearby workstations. The success of the design can be assessed in terms of signal-to-noise ratio type measures such as the
Articulation Index (AI) or its newer replacement the Speech Intelligibility Index (SII). In Europe the use of Speech Transmission Index (STI) has been proposed
for evaluating open-plan offices.
Successful designs can be most reliably achieved by a combination of quantitative design procedures and subsequent validation measurements. This paper reviews the elements for good design and describes new software tools that make quantitative design and assessment more easily achievable.
Rating Open-Plan Office Acoustics
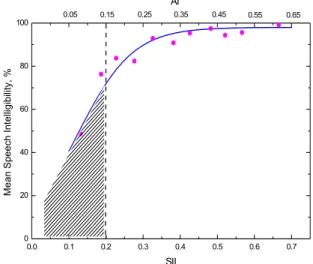
Subjective studies [1] have confirmed conventional recommendations that the combination of speech from an adjacent workstation and ambient noise levels should correspond to SII≤0.20 (or AI≤0.15, or STI≤0.17) (See Fig. 1). In calculating these values an
Intermediate Office Speech Level (IOSL) was used
which is representative of the lower speech levels found in open-plan offices [2,3].
0.0 0.1 0.2 0.3 0.4 0.5 0.6 0.7 0 20 40 60 80 100 0.55 0.65 0.45 0.35 0.25 0.05 Mean Sp eec h I n te lligi b ilit y, % SII 0.15 AI
Fig. 1. Mean speech intelligibility scores versus AI and SII values aggregated in 0.05 intervals.
While increased ambient noise levels can better mask unwanted speech sounds and lead to reduced AI ratings, too much noise is disturbing and causes people to talk louder. An ambient/masking noise level
of 45 dBA is recommended as an optimum compromise for open-plan offices [1,3].
Key Requirements for Open-Plan Offices
Open-plan offices must be designed to have appropriate ambient/masking noise levels (≈45 dBA) and should attenuate the propagation of speech as much as possible to ensure adequate speech privacy (i.e. SII≤0.20). The most important 2 elements of the design are a highly sound absorbing ceiling, to minimize reflected sound, and adequate height workstation panels (
≥
1.7 m) to block speech propagation to adjacent workstations. Fig. 2 shows combinations of these two parameters that will meet the design criterion of SII≤0.20.0.35 0.30 0.25 0.20 0.5 0.6 0.7 0.8 0.9 1.0 1.3 1.4 1.5 1.6 1.7 1.8 1.9 Panel heig ht , m Ceiling SAA
Fig 2. Shaded area indicates combinations of ceiling absorption (SAA) and panel height
providing SII≤0.20.
It is also important that workstations not be too small (at least 2m by 2m), and that the workstation panels are sound absorptive (SAA≥0.70). The type and location of lighting fixtures can also affect the success of the acoustical design. Ceiling lights with flat reflective lens should be avoided.
COPE-Calc, Software Design Tool
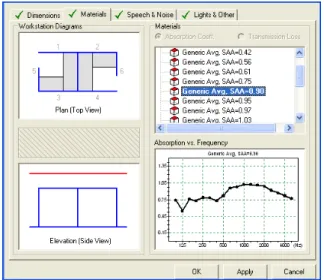
The COPE-Calc software [4] provides accurate estimates of the expected speech privacy between two adjacent rectangular workstations. It uses an image sources approach [5-8] and includes all significant reflections. The user specifies the dimensions and selects material properties from the programs database. The user can add new materials to the database. Finally, the user specifies speech levels and ambient/masking noise levels and the program calculates AI and SII values.
The program makes it easy to compare various designs and also allows the user to hear audio simulations of speech from an adjacent workstation with the specified ambient/masking noise for each deign. The program also gives advice on how improve privacy based on a range of calculated increases in each parameter.
Figure 3 shows a view of the edit screen illustrating the selection of a ceiling tile material from the database.
Fig. 3. COPE-Calc edit screen.
SPMsoft, Speech Privacy Measurement Tool
It is also important to be able to measure the degree of speech privacy in offices to either quantify problems or to validate the success of new designs. The new speech privacy measurement software (SPMsoft) is being developed to permit more convenient speech privacy measurements using impulse response techniques. The sound source is first calibrated to have a known output at 1 m in a free field and then the program can measure attenuations from a source workstation to nearby workstations.
The user selects an appropriate speech source level such as the IOSL [1-3] and when combined with the measured attenuation gives the expected speech level at the receiver location. The ambient noise level is either measured or a reference value is read from the program’s database. The program then calculates values of AI, SII and STI from the impulse response, as well as the speech and noise levels.
If the user enters the dimensions of the workstations and the positions of the source and receiver, the program will identify the expected time of arrival of the main ceiling reflection and the initial diffracted path over the separating screen. The relative energy
in these two main features of the impulse response indicates whether one should first increase the screen height or the ceiling absorption to most effectively improve speech privacy. (See Fig. 4).
Fig. 4 Main screen of SPMsoft showing measured noise levels (upper) and measured impulse response (lower). C 1.68 m 1. 11 m 4 3 2 5 0.1500 0.2000 0.2500 0.3000 0.3500 0.4000 0.4500 0.5000 0.5500
Fig. 8. Contours of AI values for speech propagation from workstation #4 to workstations #3 and #5 from measurements at 0.30 m intervals.
References
[1] Construction Technology Update #63 IRC-NRC (2004).
[2] Can. Acoust. 31(2) 23-30 (2003). [3] Paper N1034, Inter Noise (2003). [4] COPE-Calc, is available at http://irc.nrc-cnrc.gc.ca/ie/cope/index.html [5] App. Acoust., 63(8) 849-866 (2002). [6] App. Acoust., 63(8) 867-883 (2002). [7] App. Acoust., 63 (12) 1335-1352 (2002). [8] App. Acoust., 63 (12) 1353-1374 (2002).