HAL Id: hal-02627771
https://hal.inrae.fr/hal-02627771
Submitted on 26 May 2020
HAL is a multi-disciplinary open access archive for the deposit and dissemination of sci-entific research documents, whether they are pub-lished or not. The documents may come from teaching and research institutions in France or abroad, or from public or private research centers.
L’archive ouverte pluridisciplinaire HAL, est destinée au dépôt et à la diffusion de documents scientifiques de niveau recherche, publiés ou non, émanant des établissements d’enseignement et de recherche français ou étrangers, des laboratoires publics ou privés.
study with the bat Plecotus auritus
Tommy Andriollo, François Gillet, Johan R. Michaux, Manuel Ruedi
To cite this version:
Tommy Andriollo, François Gillet, Johan R. Michaux, Manuel Ruedi. The menu varies with metabar-coding practices: A case study with the bat Plecotus auritus. PLoS ONE, Public Library of Science, 2019, 14 (7), �10.1371/journal.pone.0219135�. �hal-02627771�
The menu varies with metabarcoding
practices: A case study with the bat Plecotus
auritus
Tommy AndriolloID1,2, Franc¸ois Gillet3,4, Johan R. Michaux3,5, Manuel Ruedi1* 1 Department of Mammalogy and Ornithology, Natural History Museum of Geneva, CP, CH, Geneva, Switzerland, 2 Section of Biology, Faculty of Sciences, University of Geneva, Quai Ernest-Ansermet, Geneva, Switzerland, 3 Laboratoire de Ge´ne´tique de la Conservation, Universite´ de Liège, Institut de Botanique B22, Liège, Belgium, 4 Comportement et E´ cologie de la Faune Sauvage (CEFS), Institut National de la Recherche Agronomique, Auzeville, Castanet-Tolosan Cedex, France, 5 CIRAD, Agirs Unit, TA C- 22/ E- Campus international de Baillarguet, Montpellier Cedex, France
Abstract
Metabarcoding of feces has revolutionized the knowledge of animal diets by providing unprecedented resolution of consumed resources. However, it is still unclear how different methodological approaches influence the ecological conclusions that can be drawn from such data. Here, we propose a critical evaluation of several data treatments on the inferred diet of the bat Plecotus auritus using guano regularly collected from various colonies throughout the entire active season. First and unlike previous claims, our data indicates that DNA extracted from large amounts of fecal material issued from guano accumulates yield broader taxonomic diversity of prey than smaller numbers of pellets would do, provided that extraction buffer volumes are adapted to such increased amounts of material. Second, tro-phic niche analyses based on prey occurrence data uncover strong seasonality in the bat’s diet and major differences among neighboring maternity colonies. Third, while the removal of rare prey items is not always warranted as it introduces biases affecting particularly sam-ples with greater prey species richness. Fourth, examination of distinct taxonomic depths in diet analyses highlights different aspects of food consumption providing a better under-standing of the consumer’s diet. Finally, the biologically meaningful patterns recovered with presence-absence approaches are virtually lost when attempting to quantify prey consumed using relative read abundances. Even in an ideal situation where reference barcodes are available for most potential prey species, inferring realistic patterns of prey consumption remains relatively challenging. Although best practice in metabarcoding analyses will depend on the aims of the study, several previous methodological recommendations seem unwarranted for studying such diverse diets as that of brown long-eared bats.
a1111111111 a1111111111 a1111111111 a1111111111 a1111111111 OPEN ACCESS
Citation: Andriollo T, Gillet F, Michaux JR, Ruedi M
(2019) The menu varies with metabarcoding practices: A case study with the bat Plecotus
auritus. PLoS ONE 14(7): e0219135.https://doi. org/10.1371/journal.pone.0219135
Editor: Elena Gorokhova, Stockholm University,
SWEDEN
Received: December 14, 2018 Accepted: June 17, 2019 Published: July 5, 2019
Copyright:© 2019 Andriollo et al. This is an open access article distributed under the terms of the Creative Commons Attribution License, which permits unrestricted use, distribution, and reproduction in any medium, provided the original author and source are credited.
Data Availability Statement: Raw DNA sequences
of prey of Plecotus auritus: available on Zenodo doi:10.5281/zenodo.3240538.
Funding: This study benefitted from the financial
support from the Direction Ge´ne´rale de
l’Agriculture et de la Nature de l’E´tat de Genève and the Fondation Ernst & Lucie Schmidheiny. The funders had no role in study design, data collection and analysis, decision to publish, or preparation of the manuscript.
Competing interests: The authors have declared
Introduction
The advent of high-throughput sequencing (HTS) and metabarcoding approaches in particu-lar provides unprecedented resolution in the study of animal diets [1–3]. Such sequencing techniques and related automated species identification allow the characterization of multiple assemblages of prey species through a single sequencing process, and has typically been applied to identify food resources recovered in feces, stomach contents or regurgitates [4]. So far, metabarcoding approaches has been used to unravel the diet of a diversity of invertebrates [5–
7], fishes [8–10], reptiles [11], birds [12] or mammals [13–16]. It has been widely used in descriptive studies of diet composition, foraging strategies, and to resolve more complex ques-tions about trophic ecology (e.g., resource partitioning, food web studies). These molecular techniques enable the study of elusive species’ diet such as that of insectivorous bats [17–25]. Before HTS, traditional methods of diet analysis of bat guano were based on morphological identification of macroscopic prey remains and relied on expert knowledge of invertebrate anatomy and diversity. Hence the taxonomic resolution was often limited to the order or fam-ily level [26–30]. With molecular methods of identification, the trophic ecology of these mam-mals can be characterized with much higher resolution across numerous samples [31–34], potentially unravelling overlooked dietary diversity, or identifying resource partitioning between species that was missed by traditional approaches [35].
Despite their huge promises, DNA-based methods are not free of limitations and potential methodological biases [36–39]. Experimental issues such as preferential amplification during PCR steps or the process of sequence demultiplexing and species identification have been examined in previous reviews [40–43]. However potential implications for a number of other factors that could lead to inaccurate diet analyses are still under explored. Here, we compare how some methodological choices may influence conclusions on dietary diversity and varia-tions of trophic niche overlap in the diet of an insectivorous bat species, the brown long-eared batPlecotus auritus (Linnaeus, 1758), which predominantly feeds on moths [28,35]. Such a specialized diet offers ideal conditions for metabarcoding analyses as lepidopterans have been covered by global barcoding initiatives (see [44] and references therein), and thus relatively comprehensive reference databases exist for the molecular identification of most potential prey. Furthermore, the maternity colonies of long-eared bats are frequently established in buildings, allowing the easy collection of bat droppings without disturbing the animals.
Here, we monitored several maternity roosts established in close geographic proximity and throughout an entire period of occupancy to explore seasonal and inter-colonial variations in the exploited prey spectrum. The analyzed samples either included aggregates of few pellets (typically three) as recommended by Mata et al. [45], or larger pools of pellets (typically 15–20 pellets) in order to evaluate the diversity of prey consumed by animals from each maternity colony. As no bat was captured to avoid disturbances, we did not attempt to estimate individ-ual-based diets, but only community or roost-level samples. Whole DNA extracts were sub-jected to classical metabarcoding approaches for molecular identification of prey, but the resulting original dataset was then altered in three different ways to see how such alterations would influence our conclusions about the long-eared bat’s diet. The alteration of the original dataset included (1) discarding rare prey items, (2) relying on a lower taxonomic depth and (3) quantifying prey contribution using sequence read counts. Indeed, removal of unique prey items from dataset is often recommended in metabarcoding studies, as rare items are purport-edly more susceptible to reflect sequencing errors or may exaggerate their importance in diet diversity [36,40]. However, no standard threshold has been established so far to define what a rare item is. Furthermore, the resulting effect of such removal on ecological conclusions still needs to be examined. The impact of the level of taxonomic resolution used for prey
identification may also impact on ecological conclusions. This is especially likely when meta-barcoding studies need to be compared with the ones leading to coarser identification levels, typically those using morphological identification of prey remains or those using barcoding markers with low taxonomic resolution. Finally, a recent study based on simulated datasets suggest that weighting prey occurrence according to read counts rather than simply recording their presence-absence may provide a more accurate view of consumers’ diet [38]. However results from these simulations have been poorly evaluated with real biological datasets that often include much more diversified diets.
Material and methods
Feces sampling and pooling
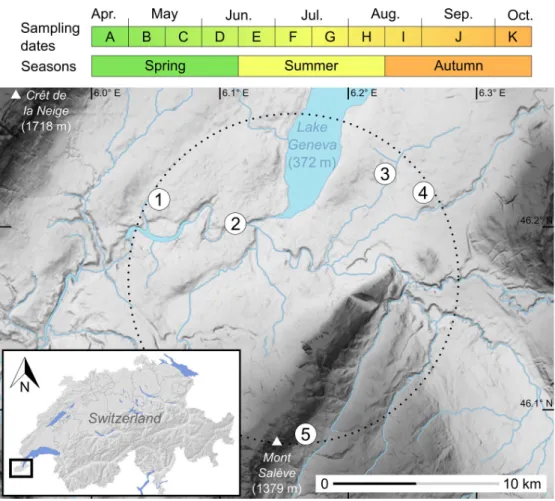
The sampling included feces collected from April to October 2015 from five monospecific col-onies of genetically identifiedPlecotus auritus [46,47]. These maternity colonies were situated in buildings (attics, steeples and a tunnel) and established within a 10 km-radius area in the Geneva region (Fig 1). They comprised a variable number of 10 to 60 individuals each. Four colonies were found in the lowlands at about 450 m a.s.l., while the fifth one was located in a more mountainous area at about 900 m a.s.l., but still in close geographic proximity to the oth-ers. In order to ensure that the fresh fecal material would dry quickly, thick absorbent paper sheets were set under hanging areas used by the bats. All accumulated feces were removed every two weeks (i.e. 11 dates in total), from the establishment of the maternity colony until bats eventually left the roost to complete their life cycle elsewhere. These sampling dates corre-spond to major periods in maternity roosts of bats [48], hereafter referred to as spring (from mid-April to mid-June, i.e. before pups are born), summer (from mid-June to mid-August, when pups are reared) and autumn (from mid-August to mid-October, when juveniles are weaned). The collected guano was stored in paper envelopes and preserved in a dry atmo-sphere before extraction.
For each colony and at each sampling date, we considered a “community sample” as a ran-dom aggregate of 15–20 pellets taken from the bulk of the collected droppings. These commu-nity samples weighted approximatively 60± 3 mg and likely represented the cumulated diet of the entire maternity colony during the two-weeks intervals, not the contribution of single indi-viduals. In order to test whether smaller samples would yield an equivalent number of prey [45], we also sampled 6 independent biological replicates from each of the 11 collecting dates in the maternity colony of Satigny. In each of these replicates, hereafter called “small repli-cates”, only three pellets (about 8 mg) were randomly taken from the collected guano samples.
Molecular analysis
DNA was extracted from each sample with the QIAamp DNA Stool Mini Kit (Qiagen, Switzer-land) using protocol modifications suggested by Zeale et al. [49]. For the community samples, a further technical step was added to prevent the pipetting of too much fecal material into the centrifuge tube. We used two Eppendorf tubes instead of one filled with Buffer ASL; the guano samples were thus ground and soaked in twice the recommended volume of buffer before cen-trifugation. The supernatant of both tubes was then pooled for subsequent extraction steps. Purified DNA was preserved at -20˚C. DNA extracts from all colonies and dates were random-ized on plates to prevent artefactual colony or seasonal autocorrelation due to contamination between adjacent wells. To amplify a wide range of potential invertebrate prey, we used the primer pair ZBJ-ArtF1c and ZBJ-ArtR2c [49] which amplifies 157 bp of the COI barcode gene [50]. After library construction and equimolar multiplexing of purified PCR products, the final pool was sequenced on an Illumina Genome Analyzer II using 150 by 150 paired-end
reads. Raw sequences were sorted and filtered using a script mixing FASTX Toolkit (http:// hannonlab.cshl.edu/fastx/toolkit; 23-09-16) and USEARCH [51] functions as proposed by Andre´ et al. [52]. Briefly, the paired-end reads were joined on their overlapping ends. The overlap had to be at least 10 bases long with an 8% maximum difference. Primers were removed and sequences were filtered to keep only those with at least 90% of the bases with a quality index greater than Q30 [52]. DNA sequences shorter than 149 bp or represented by less than five reads were filtered out in order to remove likely sequencing errors. Within each sample, sequences represented by less than 0.1‰ of read counts were discarded in order to ensure evenness of sequencing depth across samples, and as recovery biases of this order of magnitude have been reported in metabarcoding analyses of mock communities [53]. The retained reads were clustered into unique molecular operational taxonomic units (MOTUs) using the software MEGAN [54], allowing for one mutation within each MOTU (Min Percent Identity: 99.0). MOTUs were then submitted to the NCBI BLAST tool [55] which relies on the GenBank database, and taxonomic identification from the resulting file was performed with MEGAN. The same MOTUs were independently identified through the BOLD sequence iden-tification engine [56]; this taxonomically well-curated database allowed to gain taxonomic res-olution for some MOTUs. The presence of blank extractions and PCR negative controls allowed us to exclude MOTUs likely originating from extraction or PCR contaminants from
Fig 1. Sampling dates and map of the five colonies of long-eared bats studied in the Geneva region. Topographic
slopes are shaded from pale (flat) to dark grey (steep). The dotted circle represents a virtual 10 km-radius area encompassing all the five sampled colonies: (1) Satigny, (2) pont Butin, (3) Choulex, (4) Presinge and (5) Sappey. The inset (lower left) provides a location map of the study area near Lake Geneva in southwestern Switzerland.
further analyses. A final taxonomic check was performed manually in order to ensure that each identified MOTU indeed corresponded to species known from inventories of inverte-brates at local scale [57,58] or across all Switzerland [59].
Analyzed datasets
We followed Deagle et al. [38] to calculate the percentage of occurrence (POO) for each food item in the total dataset, weighted by the total number of prey found in a given sample (hereaf-ter called dataset “wPOO”). This wPOO dataset was considered to be the original, unal(hereaf-tered dataset. We considered two altered versions of this wPOO dataset. Firstly, we removed all rare MOTUs, defined here as those found only in a single sample (dataset “No rare items”). Notice that such singletons were usually represented by high read numbers, so should not be assimi-lated to those MOTUs excluded from the raw database because they were represented by low read counts (see previous section). A second altered dataset was generated by retaining only the family of each identified prey to obtain a coarser level of taxon identification (dataset “Family level”). Finally, we also calculated the relative read abundance of each prey (dataset “RRA”), which assumes that the abundance of a prey is proportional to its sequence read counts. All data manipulations, computations, statistical tests and plotting were performed in R [60], using the packages dplyr [61], tidyr [62] and ggplot2 [63]. The effectiveness of sampling effort and that of sequencing depth per sample were analyzed using accumulation curves cal-culated with the package iNEXT [64]. The Chao2 minimum estimator of asymptotic species richness [65,66] was computed with the software EstimateS 9.1.0 [67] for each sampling regime.
Ecological indices
Trophic niche breadth for each community sample was calculated using the Levins’ index [68]. We calculated the seasonal niche breadth for each of the three periods considered (Fig 1), as the mean of Levins’ indices measured for all community samples in a given season. Departure from normality was assessed with Shapiro’s tests, and homogeneity (equality of variance) of indices was subsequently assessed either with Levene’s or F-tests, depending on the outcome of Shapiro’s tests. Statistical significance of differences in niche breadth was then tested by per-forming t-tests, accounting for differences in variance when necessary. For more detailed com-parisons among colonies and across seasons, community samples from related dates were grouped within seasons (Fig 1). Trophic niche overlap between these seasonal samples was then measured with the Morisita-Horn indexCλ[69,70]. This measure is derived from the
Simpsons diversity index and ranges from 0 (no overlap in utilization of resources) to 1 (com-plete overlap). Pairwise niche overlap constituted similarity matrices between samples of inter-est, and were graphically represented by multidimensional scaling (MDS), using the Principal Coordinates Analysis (PCoA) function implemented in the R package ade4 [71].
Results
Diet composition
The sequencing and initial sequence validation yielded to a total of 1973378 usable reads, or a mean of 16583 reads per sample (n = 119). These reads produced 881 distinct sequences that were clustered into 654 MOTUs, each represented by a 1125 read counts per sample on aver-age (90% quantile: 5–5409). We discarded 111 of these MOTUs (17%) that did not match to any referenced sequence (i.e. with <40% similarity values). We also discarded 57 other MOTUs that obviously did not belong to the bat’s diet but likely resulted from environmental
contamination. The sequences either did not represent animals (enterobacteriae, algae, fungi or rotifers), or were small arthropods known to be attracted or feeding on guano deposits (mites, machilids, anobiid and dermestid beetles). Finally, two species of slugs were also removed from the full dataset, as they likely represented secondary prey consumed by carabid beetles eaten by the long-eared bats. Extrapolation of species richness indicated that the sequencing of all samples was deep enough for detecting all prey species present in the sampled feces.
The final, complete dataset (used for wPOO and RRA) represented a panel of 521 identified arthropods consumed by brown long-eared bats in the Geneva region. These arthropods were classified into 3 classes, 15 orders and 94 families (S1 Table). 505 of these prey species (97%) were insects, 12 were spiders (2%), and the remaining 4 (1%) were woodlice. Among insects, 53% were lepidopterans (n = 269), 34% were flies (n = 173), while bugs, beetles, neuropterans and hymenopterans represented each 2% of consumed species. The other taxonomic groups (barklice, caddisflies, cockroaches, earwigs, orthopterans, scorpionflies and snakeflies) were only represented by less than five species. In addition to these well-identified arthropods, 63 MOTUs (12%) could not be reliably assigned to a species and were thus either kept identified to the family (n = 49) or to the order level (n = 14).
Community samples vs. small replicates
The 11 community samples and 66 small replicates collected in the maternity colony of Satigny produced a total 150 and 299 identifiable prey species, respectively, 109 of which were shared by both sampling regimes (Fig 2A). However, for a comparable sampling effort, community samples provided a significantly (P < 0.001) higher species richness (mean of 23.5± 3.1 prey species per sample) than did small replicates (14.6± 5.4;Fig 2B). When considering the 53 community samples collected in all five maternity colonies, the mean prey species richness (23.5± 7.1) was not different from that of Satigny only (Fig 2B). Extrapolations from accumu-lation curves further suggested that these numbers only represent 50 to 60% of potential prey richness inferred with Chao2 estimator (Fig 2C). These extrapolations also indicated that at least. 266 community samples would have been necessary to detect 95% of total species rich-ness inferred for the five colonies (818 MOTUs).
Seasonal variation of niche breadth
Analysis of the complete dataset, comprising all retained prey items, each considered as weighted occurrence data (dataset wPOO), indicated that trophic niche breadth measured across all colonies was significantly higher in community samples gathered during the summer than during other seasons (P < 0.04) (Fig 3A). When expressed as number of prey species detected per community sample, a mean of 21.8 was observed in spring, 26.9 during the nurs-ing season and 21.4 after reproduction. When rare prey species were removed (i.e. 232 MOTUs or 56% of all identified prey species), summer samples exhibited the highest niche breadth (21.7 prey species), which was significantly higher than during spring (16.8 prey spe-cies). Species richness of samples gathered in summer and autumn(18.9 prey species) did not differ significantly (Fig 3B). When using occurrences of prey identified at a coarser taxonomic resolution (dataset Family level), niche breadth statistically differed between all seasons, and continuously decreased throughout the year (Fig 3C). A mean of 5.6 families per sample were represented in spring, 4.0 families in summer, and 2.4 families in autumn, indicating a taxo-nomically more focused diet. Finally, when using the RRA dataset, no significant differences in trophic niche breadth were observed between seasons, and seasonal mean Levins’ measures ranged from 3.4 to 3.9 prey species (Fig 3D). Similar results were retrieved when using the
Shannon-Wiener index of niche breadth [72], although it gives more weight to the rare resources (S1 File).
Seasonal and geographic niche overlap
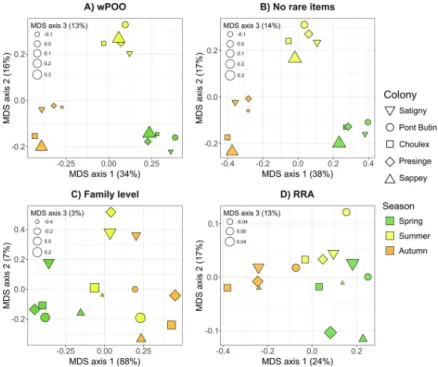
In the similarity matrix calculated for the wPOO dataset, Morisita-Horn indices measuring trophic niche overlaps between maternity colonies and seasons ranged from 6 to 72%. Lowest overlap values were observed between spring and autumn (6–28%; mean 25%), while overlap values within seasons were systematically higher (28–72%; mean 47%), regardless of the colony considered. The Sappey colony consistently exhibited lower overlap measures with other colo-nies (28–52%; mean 38% within seasons), while all other colocolo-nies had larger overlaps (35– 72%; mean 54% within season). This tendency was clearly recovered in MDS projection, since the three sampling seasons were well segregated along the first two axes of the PCA (Fig 4A).
Fig 2. Species diversity statistics for different regimes of guano sampling: Community samples for all colonies in green (n = 53), community samples for the Satigny colony in red (n = 11), and small replicates in blue (n = 66). A)
Area-proportional Euler diagram of the total species diversity found under each sampling regime. B) Number of species per sample, with significant differences between sampling regimes indicated by stars (���P < 0.001). C)
Extrapolated accumulation curves of the number of detected prey species for each sampling regime. https://doi.org/10.1371/journal.pone.0219135.g002
The third axis consistently separated the Sappey colony during all the three seasons considered (Fig 4A). The removal of rare prey items resulted in a very similar MDS representation (Fig 4B), and therefore did not affect the conclusions drawn from the full dataset. Conversely, both the use of family-level prey identification (Fig 4C) and the RRA method (Fig 4D) failed to pro-vide a clear-cut segregation of samples from a given colony or of samples from a given season. When using such data alteration, samples were poorly discriminated by date on the first axis,
Fig 3. Seasonal trophic niche breadth variation (Levins’ index) measured inP. auritus. The four panels correspond to different data manipulations: A) full dataset, with all prey items kept and identified to the species level and considered as weighted occurrence data (wPOO); B) all unique occurrences discarded from the dataset (No rare items); C) prey identified to the family level only (Family level); D) all prey items weighted according to their relative read abundance (RRA). Significant differences are indicated by a star (P < 0.05).
https://doi.org/10.1371/journal.pone.0219135.g003
Fig 4. Multidimensional-scaling of trophic niche overlap (Morisita-Horn index) measured between fecal samples ofP. auritus from different colonies and collected in distinct seasons. Each colony is represented by a distinct shape, and seasons by different colors. Size of symbols corresponds to their relative position along the third MDS axis. The four panels correspond to different data manipulations: A) full dataset, with all prey items kept and identified to the species level and considered as weighted occurrence data (wPOO); B) all unique occurrences discarded from the dataset (No rare items); C) prey identified to the family level only (Family level); D) all prey items weighted according to their relative read abundance (RRA).
and failed to identify the colony from Sappey as having lower dietary overlap compared to all other colonies. The use of taxonomic depth limited to the family level provided higher indices of niche overlap with most values being greater than 60%, while quantification by read abun-dance provided much lower values of this measure with most being lower than 20%. Compara-ble results were retrieved e,g, when using the Pianka’sOjkmeasure of niche overlap [73,74]
(S2 File).
Discussion
Prey detectability does not saturate in pooled poo samples
Mata et al. [45] compared the dietary diversity estimated for community samples against indi-vidual pellets, and observed no significant difference in the number of prey species detected under these two sampling regimes. They suggested that PCR competition between DNA tem-plates could likely explain this saturation in prey detection, as DNA present in low frequency may be outcompeted by more abundant ones during amplification. They recommended avoid-ing poolavoid-ing fecal samples to obtain a more accurate estimate of diet. We did not observe such saturation in our community samples consisting of 15–20 pellets versus smaller amounts of fecal material (3 pellets). Indeed, the former sampling regime allowed detection of 52% more prey species per sample than the latter (23.5 versus 14.9 prey species, respectively;Fig 2B). These results indicate that, given the same sequencing effort, the more pellets are pooled for the extraction, the higher diversity of prey species will be recovered. The apparent saturation in prey detection reported by Mata et al. [45] might therefore reflect a methodological problem during the extraction step (e.g., clogged membrane) rather than an amplification bias during PCR. Our extraction improvement consisted of using larger initial volumes of digestion buffer when extracting large volumes of fecal material and probably overcame this problem. Contrary to recommendation from Mata et al. [45], we thus suggest that community samples uncover greater dietary diversities than individual samples do. Furthermore, such community samples include droppings accumulated during several days and by several bats and thus better reflect the range of prey species consumed by the colony members. They also reduce the stochasticity associated with smaller samples, that are more affected by individual variation of prey con-sumption (e.g., [45,75,76]).
Seasonal and geographical variation matters
Due to the marked seasonal phenologies of insect activity observed in most habitats [77], prey assemblages available for insectivorous bats varies greatly throughout the year, in terms of abundance, diversity and composition. With the complete dataset (wPOO;Fig 3A), we showed that this seasonality is strongly reflected in the diet ofP. auritus, which appears to exploit insect
prey opportunistically, with a peak in prey species richness marked during the summer, when females are rearing their pups. Members of all maternity colonies appear to exploit the same seasonal spectrum of insects, as niche overlap is much larger within a given season than between different periods (Fig 4A). These seasonal shifts in prey consumption imply that die-tary habits measured at a given period may poorly reflect the global diet, both in terms of tro-phic niche breadth and composition, as already evidenced in other bats from temperate zones [19,35]. Hence, studies focusing on temporarily limited samplings that are typically conducted during the summer (e.g., [78]; i.e. when prey availability may not represent limiting trophic resources) could miss crucial information about diet composition, or niche partitioning.
Despite the small geographic scale envisioned here (i.e., within a radius of 10 km;Fig 1), our data also shows that geographic location can be an important factor of variation. Indeed, the four colonies of brown long-eared bats from the lowlands had systematically higher niche
overlaps among them as opposed to the one located higher in the mountains (Fig 4A). Such local effects of diet composition may thus confound effects of diet variation, when trophic niche overlaps are evaluated in distant localities (e.g., [28,35]). To avoid these potential con-founding factors of variation (season and location), we argue that niche overlap should be assessed using populations or species sampled in close proximity and within the same period of the year.
Discarding rare prey occurrences is not always warranted
Rare prey items are sometimes removed from metabarcoding datasets, since they may have an exaggerated weight in analyses compared to their actual importance in the diet [21,40], espe-cially for animals consuming relatively few prey species [38]. However, this is not always war-ranted, as we show here with the highly diversified diet of the brown long-eared bat. In this case, removing rare occurrences, which represent more than half of all prey items recovered, did not notably affect indices of niche overlap (about 5% of increase), nor results concerning seasonal and geographic variation of diet (Fig 4B). Thus, we concur with Clare et al. [40] that discarding unique occurrences has little effect regarding some ecological conclusions, but would restrict this recommendation to the estimation of resource partitioning. Indeed, we show here that removing these rare items may lead to a significant shrinking of other measures such as indices of niche breadth. Since samples with the highest prey species richness also are the ones most susceptible to carry rare prey items, removal of the latter artificially increases similarities of niche breadths (Fig 3B).
In other situations where reference databases for taxonomic identification are incomplete (e.g., [79]) and rare MOTUs are difficult to tease apart from artefactual sequences [36], the removal of rare items is justified. In more ideal conditions, like shown here, these rare prey sequences can be easily and unambiguously assigned to plausible insect species and thus reflect real prey choices. The high number of unique prey occurrences observed throughout the year indeed reflects the opportunistic feeding behavior of the brown long-eared bat reported in other studies [29,80]. These prey items should therefore be retained for an accurate descrip-tion of the richness of the diet of this insectivore.
Different taxonomic depth leads to different conclusions
The level of taxonomic resolution in prey consumed is known to greatly affect ecological anal-yses, such as food web connectance [81]. Taxonomic resolution is particularly limited in the case of diet studies using morphological identification of prey remains, but is also limited in molecular studies when reference databases are incomplete or when conserved markers are used in an attempt to reduce amplification biases. In the last case for instance, less than 67% of sequences were identified to the genus level and less than 30% to the species level in recent studies [82,83]. In the context of dietary assessment, an increase in niche breadth and a decrease in niche overlap are expected when taxonomic resolution increases [35]. Accordingly, we observed that the trophic niche overlap between colonies of brown long-eared bats was clearly higher (by about 80%) when only taxonomic identifications to the order-level were considered (Fig 3A,Fig 3C). Moreover, this overestimation due to coarser taxonomic identifi-cation of prey systematically led to increased niche overlap between seasons. This overlap was even higher than the 60% threshold classically used to characterize strong dietary overlaps [84]. When using a better taxonomic resolution (species level), all indices were lower than 49% (mean 25%) and we would reach the opposite conclusion. The study of dietary overlap among colonies and seasons was also severely affected by the use of lower taxonomic depth, as both season- and colony-specific differences were much less apparent or lost (Fig 4C). This increase
in values of niche overlap was probably exacerbated by the fact thatP. auritus is a
moth-spe-cialist, and less dramatic effects can be expected when studying species with wider taxonomic dietary breadth. Still, when coarse levels of prey identification fail to reveal trophic resource partitioning between species (e.g., [85,86]), metabarcoding techniques with high-resolution markers might be useful before rejecting the potential for competitive exclusion and invoking stabilizing mechanisms for coexistence.
Both detailed and coarser levels of taxonomic depths of prey identification might, however, highlight different aspects of food exploitation by insectivorous bats. The fully resolved dataset (Fig 3A) indicated that the brown long-eared bat exploits significantly higher prey species rich-ness during the summer, but when comparisons were restricted to family level only (Fig 3C) a higher diversity of insects was consumed in spring. Although less numerous in terms of species richness, the spring prey insects represent a broader spectrum of families, suggesting that bats cannot rely on a few preferred taxonomic groups (e.g., the largest or the most profitable prey such as noctuid or geometrid moths), but must be more eclectic during this season. The con-stant decrease of taxonomic diversity of preys observed at the family level throughout the year (Fig 3C) might again be a sign of opportunistic feeding behavior of the brown long-eared bat, which is known to exploit the peaks of moth diversity and abundance in July-August [29]. This hypothesis, however, should be tested properly with feeding choices in order to be validated.
When weighted occurrences perform better than relative read abundance
Comparisons of data treatments (Fig 4) showed that using quantitative methods based on sequence read counts (RRA) had also a dramatic effect on patterns of diet variation. Account-ing for read abundance (Fig 4D) completely blurred the strong seasonal and geographical sig-nature recovered with the wPOO approach (Fig 4A). Deagle et al. [38] suggested RRA approaches provide more accurate view of consumer’s diet when moderate amplification and recovery biases are present in the metabarcoding process. To show this, they simulated in silico biases ranging from 4× to 20× relatively to a standard amplification. Several lines of evidence indicate that much higher levels of recovery biases might actually occur in real metabarcoding analyses (up to 5000×[53]), and could therefore explain the poor performance of RRA in the case shown here (Fig 3,Fig 4). First, very few prey species received high relative read abun-dance, while most others were represented by extremely low values (<1‰; seeS3 File), drasti-cally downsizing the importance of the latter in measurements of niche overlap. Furthermore, several other potential biases due to the prey composition itself (e.g., presence of eggs) or to its digestibility certainly also influence the final outcome of read counts and can hardly be accounted for [34,36,87]. Other approaches, unexplored here, such as the use of multiple primer pairs [41,88], the use of primers known to provide quantitative results [37,43] or avoiding the PCR step by doing shotgun sequencing [89,90] may be used to overcome part of the mentioned biases. It is also possible that composition of simpler diets may be better esti-mated by RRA than in the situation here [91,92].
Supporting information
S1 Table. Taxonomic list of the 521 MOTUs recovered inP. auritus guano samples.
(DOCX)
S1 File. Seasonal trophic niche breadth variation (Shannon-Wiener index) measured inP. auritus.
S2 File. Multidimensional-scaling of trophic niche overlap (Pianka’s Ojkindex) measured
between fecal samples ofP. auritus from different colonies and collected in distinct sea-sons.
(DOCX)
S3 File. Impact of read numbers on frequency estimates.
(DOCX)
Acknowledgments
We thank Eric Verelst, who collected samples from the Sappey colony, and gratefully acknowl-edge the helpers during other guano sampling (alphabetically): Lucie Cauwet, Janik Pralong, Carlos Rouco, Cyril Scho¨nba¨chler, Emmanuel Tardy and Laurent Vallotton. We also thank the owners of buildings who rendered this study possible. Lise-Marie Pigneur (Universite´ de Liège) helped during laboratory work, and Adrien Andre´ (Universite´ de Liège) helped with Illumina raw data extraction. Bernard Landry (Muse´um d’histoire naturelle de Genève; MHNG) provided valuable literature on Lepidoptera. Raphae¨l Covain, Isabel Blasco-Costa and Jean Mariaux (MHNG) provided useful comments on an earlier version of the manuscript. TA also thanks Fre´de´ric Boyer, Eric Coissac, Eric Marcon, Pierre Taberlet and Lucie Zinger for fruitful discussions during the eighth DNA metabarcoding school held in French Guiana.
Author Contributions
Conceptualization: Tommy Andriollo. Data curation: Tommy Andriollo. Formal analysis: Tommy Andriollo.
Funding acquisition: Johan R. Michaux, Manuel Ruedi. Investigation: Tommy Andriollo.
Methodology: Tommy Andriollo, Franc¸ois Gillet, Manuel Ruedi. Project administration: Manuel Ruedi.
Resources: Franc¸ois Gillet. Software: Tommy Andriollo.
Supervision: Johan R. Michaux, Manuel Ruedi. Validation: Tommy Andriollo.
Visualization: Tommy Andriollo.
Writing – original draft: Tommy Andriollo.
Writing – review & editing: Tommy Andriollo, Franc¸ois Gillet, Johan R. Michaux, Manuel
Ruedi.
References
1. Valentini A, Miquel C, Nawaz MA, Bellemain E, Coissac E, Pompanon F, et al. New perspectives in diet analysis based on DNA barcoding and parallel pyrosequencing: the trnL approach. Mol Ecol Resour 2009; 9: 51–60.https://doi.org/10.1111/j.1755-0998.2008.02352.xPMID:21564566
2. Pompanon F, Deagle BE, Symondson WOC, Brown DS, Jarman SN, Taberlet P. Who is eating what: diet assessment using next generation sequencing. Mol Ecol 2012; 21: 1931–1950.https://doi.org/10. 1111/j.1365-294X.2011.05403.xPMID:22171763
3. Nielsen JM, Clare EL, Hayden B, Brett MT, Kratina P. Diet tracing in ecology: method comparison and selection. Methods Ecol Evol 2017; 9: 278–291.https://doi.org/10.1111/2041-210X.12869
4. Kamenova S, Mayer R, Rubbmark OR, Coissac E, Plantegenest M, Traugott M. Comparing three types of dietary samples for prey DNA decay in an insect generalist predator. Mol Ecol Resour 2018.https:// doi.org/10.1111/1755-0998.12775PMID:29509995
5. Mollot G, Duyck P-F, Lefeuvre P, Lescourret F, Martin J-F, Piry S, et al. Cover cropping alters the diet of arthropods in a banana plantation: a metabarcoding approach. PLoS ONE 2014; 9: e93740.https://doi. org/10.1371/journal.pone.0093740PMID:24695585
6. Piñol J, San Andre´ s V, Clare EL, Mir G, Symondson WOC. A pragmatic approach to the analysis of diets of generalist predators: the use of next-generation sequencing with no blocking probes. Mol Ecol Resour 2014; 14: 18–26.https://doi.org/10.1111/1755-0998.12156PMID:23957910
7. Kerley GIH, Landman M, Ficetola GF, Boyer F, Bonin A, Rioux D, et al. Diet shifts by adult flightless dung beetles Circellium bacchus, revealed using DNA metabarcoding, reflect complex life histories. Oecologia 2018; 188: 107–115.https://doi.org/10.1007/s00442-018-4203-6PMID:29961180 8. Leray M, Meyer CP, Mills SC. Metabarcoding dietary analysis of coral dwelling predatory fish
demon-strates the minor contribution of coral mutualists to their highly partitioned, generalist diet. PeerJ 2015; 3: e1047.https://doi.org/10.7717/peerj.1047PMID:26137428
9. Albaina A, Aguirre M, Abad D, Santos M, Estonba A. 18S rRNA V9 metabarcoding for diet characteriza-tion: a critical evaluation with two sympatric zooplanktivorous fish species. Ecol Evol 2016; 6: 1809– 1824.https://doi.org/10.1002/ece3.1986PMID:27087935
10. Guillerault N, Bouletreau S, Iribar A, Valentini A, Santoul F. Application of DNA metabarcoding on fae-ces to identify European catfish Silurus glanis diet. J Fish Biol 2017; 90: 2214–2219.https://doi.org/10. 1111/jfb.13294PMID:28345142
11. Brown DS, Burger R, Cole N, Vencatasamy D, Clare EL, Montazam A, et al. Dietary competition between the alien Asian Musk Shrew (Suncus murinus) and a re-introduced population of Telfair’s Skink (Leiolopisma telfairii). Mol Ecol 2014; 23: 3695–3705.https://doi.org/10.1111/mec.12445PMID: 24033506
12. Sullins DS, Haukos DA, Craine JM, Lautenbach JM, Robinson SG, Lautenbach JD, et al. Identifying the diet of a declining prairie grouse using DNA metabarcoding. The Auk 2018; 135: 583–608.https://doi. org/10.1642/auk-17-199.1
13. Shehzad W, Riaz T, Nawaz MA, Miquel C, Poillot C, Shah SA, et al. Carnivore diet analysis based on next-generation sequencing: application to the leopard cat (Prionailurus bengalensis) in Pakistan. Mol Ecol 2012; 21: 1951–1965.https://doi.org/10.1111/j.1365-294X.2011.05424.xPMID:22250784 14. Que´me´re´ E, Hibert F, Miquel C, Lhuillier E, Rasolondraibe E, Champeau J, et al. A DNA metabarcoding
study of a primate dietary diversity and plasticity across its entire fragmented range. PLoS ONE 2013; 8: e58971.https://doi.org/10.1371/journal.pone.0058971PMID:23527060
15. Kartzinel TR, Chen PA, Coverdale TC, Erickson DL, Kress WJ, Kuzmina ML, et al. DNA metabarcoding illuminates dietary niche partitioning by African large herbivores. Proc Natl Acad Sci USA 2015; 112: 8019–8024.https://doi.org/10.1073/pnas.1503283112PMID:26034267
16. Biffi M, Laffaille P, Jabiol J, Andre´ A, Gillet F, Lamothe S, et al. Comparison of diet and prey selectivity of the Pyrenean desman and the Eurasian water shrew using next-generation sequencing methods. Mamm Biol 2017; 87: 176–184.https://doi.org/10.1016/j.mambio.2017.09.001
17. Bohmann K, Monadjem A, Lehmkuhl Noer C, Rasmussen M, Zeale MRK, Clare E, et al. Molecular diet analysis of two african free-tailed bats (Molossidae) using high throughput sequencing. PLoS ONE 2011; 6: e21441.https://doi.org/10.1371/journal.pone.0021441PMID:21731749
18. Clare EL, Barber BR, Sweeney BW, Hebert PDN, Fenton MB. Eating local: influences of habitat on the diet of little brown bats (Myotis lucifugus). Mol Ecol 2011; 20: 1772–1780.https://doi.org/10.1111/j. 1365-294X.2011.05040.xPMID:21366747
19. Clare EL, Symondson WOC, Fenton MB. An inordinate fondness for beetles? Variation in seasonal die-tary preferences of night-roosting big brown bats (Eptesicus fuscus). Mol Ecol 2014; 23: 3633–3647. https://doi.org/10.1111/mec.12519PMID:25187921
20. Hope PR, Bohmann K, Gilbert MTP, Zepeda-Mendoza ML, Razgour O, Jones G. Second generation sequencing and morphological faecal analysis reveal unexpected foraging behaviour by Myotis nattereri (Chiroptera, Vespertilionidae) in winter. Front Zool 2014; 11: 39. https://doi.org/10.1186/1742-9994-11-39PMID:25093034
21. Salinas-Ramos VB, Herrera Montalvo LG, Leo´n-Regagnon V, Arrizabalaga-Escudero A, Clare EL. Die-tary overlap and seasonality in three species of mormoopid bats from a tropical dry forest. Mol Ecol 2015; 24: 5296–5307.https://doi.org/10.1111/mec.13386PMID:26369564
22. Iba´ñez C, Popa-Lisseanu AG, Pastor-Bevia´ D, Garcı´a-Mudarra JL, Juste J. Concealed by darkness: interactions between predatory bats and nocturnally migrating songbirds illuminated by DNA sequenc-ing. Mol Ecol 2016; 25: 5254–5263.https://doi.org/10.1111/mec.13831PMID:27575398
23. Aizpurua O, Budinski I, Georgiakakis P, Gopalakrishnan S, Ibañez C, Mata V, et al. Agriculture shapes the trophic niche of a bat preying on multiple pest arthropods across Europe: Evidence from DNA meta-barcoding. Mol Ecol 2018; 27: 815–825.https://doi.org/10.1111/mec.14474PMID:29290102 24. Bohmann K, Gopalakrishnan S, Nielsen M, Nielsen LdSB, Jones G, Streicker DG, et al. Using DNA
metabarcoding for simultaneous inference of common vampire bat diet and population structure. Mol Ecol Resour 2018.https://doi.org/10.1111/1755-0998.12891PMID:29673092
25. Vesterinen EJ, Puisto AIE, Blomberg AS, Lilley TM. Table for five, please: Dietary partitioning in boreal bats. Ecol Evol 2018; 8: 10914–10937.https://doi.org/10.1002/ece3.4559PMID:30519417
26. Kunz TH, Whitaker JO Jr. An evaluation of fecal analysis for determining food habits of insectivorous bats. Can J Zool 1983; 61: 1317–1321.https://doi.org/10.1139/z83-177
27. Arlettaz R, Ruedi M, Hausser J. E´ cologie trophique de deux espèces jumelles et sympatriques de chauves-souris: Myotis myotis et Myotis blythii (Chiroptera: Vespertilionidae). Premiers re´sultats. Mam-malia 1993; 57: 519–531.
28. Ashrafi S, Beck A, Rutishauser M, Arlettaz R, Bontadina F. Trophic niche partitioning of cryptic species of long-eared bats in Switzerland: implications for conservation. Eur J Wildl Res 2011; 57: 843–849. https://doi.org/10.1007/s10344-011-0496-z
29. Motte G. E´ tude compare´e de l’e´cologie de deux espèces jumelles de Chiroptères (Mammalia: Chirop-tera) en Belgique: l’oreillard roux (Plecotus auritus) (Linn., 1758) et l’oreillard gris (Plecotus austriacus) (Fischer, 1829). Thesis, Universite´ de Liège, 2011.
30. Andreas M, Reiter A, Benda P. Dietary composition, resource partitioning and trophic niche overlap in three forest foliage-gleaning bats in Central Europe. Acta Chiropt 2012; 14: 335–345.https://doi.org/ 10.3161/150811012x661657
31. Vesterinen EJ, Ruokolainen L, Wahlberg N, Peña C, Roslin T, Laine VN, et al. What you need is what you eat? Prey selection by the bat Myotis daubentonii. Mol Ecol 2016; 25: 1581–1594.https://doi.org/ 10.1111/mec.13564PMID:26841188
32. Galan M, Pons J-B, Tournayre O, Pierre E´ , Leuchtmann M, Pontier D, et al. Metabarcoding for the par-allel identification of several hundred predators and their prey: application to bat species diet analysis. Mol Ecol Resour 2018; 18: 474–489.https://doi.org/10.1111/1755-0998.12749PMID:29288544 33. Swift JF, Lance RF, Guan X, Britzke ER, Lindsay DL, Edwards CE. Multifaceted DNA metabarcoding:
validation of a noninvasive, next-generation approach to studying bat populations. Evol Appl 2018; 11: 1120–1138.https://doi.org/10.1111/eva.12644PMID:30026801
34. Alberdi A, Aizpurua O, Bohmann K, Gopalakrishnan S, Lynggaard C, Nielsen M, et al. Promises and pit-falls of using high-throughput sequencing for diet analysis. Mol Ecol Resour 2019; 19: 327–348.https:// doi.org/10.1111/1755-0998.12960PMID:30358108
35. Razgour O, Clare EL, Zeale MRK, Hanmer J, Schnell IB, Rasmussen M, et al. High-throughput sequencing offers insight into mechanisms of resource partitioning in cryptic bat species. Ecol Evol 2011; 1: 556–570.https://doi.org/10.1002/ece3.49PMID:22393522
36. Clare EL. Molecular detection of trophic interactions: emerging trends, distinct advantages, significant considerations and conservation applications. Evol Appl 2014; 7: 1144–1157.https://doi.org/10.1111/ eva.12225PMID:25553074
37. Krehenwinkel H, Wolf M, Lim JY, Rominger AJ, Simison WB, Gillespie RG. Estimating and mitigating amplification bias in qualitative and quantitative arthropod metabarcoding. Sci Rep 2017; 7: 17668. https://doi.org/10.1038/s41598-017-17333-xPMID:29247210
38. Deagle BE, Thomas AC, McInnes JC, Clarke LJ, Vesterinen EJ, Clare EL, et al. Counting with DNA in metabarcoding studies: how should we convert sequence reads to dietary data? Mol Ecol 2018.https:// doi.org/10.1111/mec.14734PMID:29858539
39. Taberlet P, Bonin A, Zinger L, Coissac E. Environmental DNA: for biodiversity research and monitoring: Oxford University Press; 2018. 253 p.
40. Clare EL, Chain FJJ, Littlefair JE, Cristescu ME. The effects of parameter choice on defining molecular operational taxonomic units and resulting ecological analyses of metabarcoding data. Genome 2016; 59: 981–990.https://doi.org/10.1139/gen-2015-0184PMID:27336462
41. Alberdi A, Aizpurua O, Gilbert MTP, Bohmann K. Scrutinizing key steps for reliable metabarcoding of environmental samples. Methods Ecol Evol 2018; 9: 134–147.https://doi.org/10.1111/2041-210X. 12849
42. Nichols RV, Vollmers C, Newsom LA, Wang Y, Heintzman PD, Leighton M, et al. Minimizing polymer-ase bipolymer-ases in metabarcoding. Mol Ecol Resour 2018; 18: 927–939.https://doi.org/10.1111/1755-0998. 12895PMID:29797549
43. Piñol J, Senar MA, Symondson WOC. The choice of universal primers and the characteristics of the species mixture determines when DNA metabarcoding can be quantitative. Mol Ecol 2018.https://doi. org/10.1111/mec.14776PMID:29939447
44. Huemer P, Mutanen M, Sefc KM, Hebert PDN. Testing DNA barcode performance in 1000 species of European Lepidoptera: large geographic distances have small genetic impacts. PLoS ONE 2014; 9: e115774.https://doi.org/10.1371/journal.pone.0115774PMID:25541991
45. Mata VA, Rebelo H, Amorim F, McCracken GF, Jarman S, Beja P. How much is enough? Effects of technical and biological replication on metabarcoding dietary analysis. Mol Ecol 2018.https://doi.org/ 10.1111/mec.14779PMID:29940083
46. Andriollo T, Ruedi M. Novel molecular tools to identify Plecotus bats in sympatry and a review of their distribution in Switzerland. Rev Suisse Zool 2018; 125: 61–72.https://doi.org/10.5281/zenodo. 1196013
47. Andriollo T, Ashrafi S, Arlettaz R, Ruedi M. Porous barriers? Assessment of gene flow within and among sympatric long-eared bat species. Ecol Evol 2018; 8: 12841–12854.https://doi.org/10.1002/ ece3.4714PMID:30619587
48. Racey PA, Entwistle AC. Life-history and reproductive strategies of bats (pp. 363–414). In: Crichton E, Krutzsch P, editors. Reproductive biology of bats: Academic Press; 2000. p. 510.
49. Zeale MRK, Butlin RK, Barker GLA, Lees DC, Jones G. Taxon-specific PCR for DNA barcoding arthro-pod prey in bat faeces. Mol Ecol Resour 2011; 11: 236–244.https://doi.org/10.1111/j.1755-0998.2010. 02920.xPMID:21429129
50. Hebert PDN, Ratnasingham S, deWaard JR. Barcoding animal life: cytochrome c oxidase subunit 1 divergences among closely related species. Proc R Soc Lond B Biol Sci 2003; 270: S96–99.https://doi. org/10.1098/rsbl.2003.0025PMID:12952648
51. Edgar RC. Search and clustering orders of magnitude faster than BLAST. Bioinformatics 2010; 26: 2460–2461.https://doi.org/10.1093/bioinformatics/btq461PMID:20709691
52. Andre´ A, Mouton A, Millien V, Michaux JR. Liver microbiome of Peromyscus leucopus, a key reservoir host species for emerging infectious diseases in North America. Infect Genet Evol 2017; 52: 10–18. https://doi.org/10.1016/j.meegid.2017.04.011PMID:28412525
53. Jusino MA, Banik MT, Palmer JM, Wray AK, Xiao L, Pelton E, et al. An improved method for utilizing high-throughput amplicon sequencing to determine the diets of insectivorous animals. Mol Ecol Resour 2018; 19: 176–190.https://doi.org/10.1111/1755-0998.12951PMID:30281913
54. Huson DH, Auch AF, Qi J, Schuster SC. MEGAN analysis of metagenomic data. Genome Res 2007; 17: 377–386.https://doi.org/10.1101/gr.5969107PMID:17255551
55. Johnson M, Zaretskaya I, Raytselis Y, Merezhuk Y, McGinnis S, Madden TL. NCBI BLAST: a better web interface. Nucleic Acids Res 2008; 36: W5–W9.https://doi.org/10.1093/nar/gkn201PMID: 18440982
56. Ratnasingham S, Hebert PDN. BOLD: The Barcode of Life Data System (http://www.barcodinglife.org). Mol Ecol Notes 2007; 7: 355–364.https://doi.org/10.1111/j.1471-8286.2007.01678.xPMID:18784790 57. Merz B. Liste annote´ e des insectes (Insecta) du canton de Genève. Genève: Instrumenta
Biodiversita-tis 8, Muse´um d’histoire naturelle; 2012. 532 p.
58. Andriollo T, Landry B, Guibert B, Pastore M, Baumgart P. Nouveaux ajoutsàla liste des Le´pidoptères du canton de Genève. Entomo Helvetica 2019; 12: 9–28.
59. de Jong Y, Verbeek M, Michelsen V, Bjørn PdP, Los W, Steeman F, et al. Fauna Europaea–all Euro-pean animal species on the web. Biodivers Data J 2014; 2: e4034.https://doi.org/10.3897/BDJ.2. e4034PMID:25349527
60. R Core Team. R: a language and environment for statistical computing. Vienna, Austria; 2017. 61. Wickham H, Franc¸ois R, Henry L, Mu¨ller K. dplyr: a grammar of data manipulation. 2018. Available:
https://CRAN.R-project.org/package=dplyr.
62. Wickham H, Henry L. tidyr: easily tidy data with "spread ()" and "gather ()" functions. 2018. Available: https://CRAN.R-project.org/package=tidyr.
63. Wickham H. ggplot2: elegant graphics for data analysis: Springer; 2016.
64. Hsieh TC, Ma KH, Chao A. iNEXT: an R package for rarefaction and extrapolation of species diversity (Hill numbers). Methods Ecol Evol 2016; 7: 1451–1456.https://doi.org/10.1111/2041-210x.12613 65. Chao A. Estimating the population size for capture-recapture data with unequal catchability. Biometrics
66. Colwell RK, Chao A, Gotelli NJ, Lin S-Y, Mao CX, Chazdon RL, et al. Models and estimators linking indi-vidual-based and sample-based rarefaction, extrapolation and comparison of assemblages. Journal of Plant Ecology 2012; 5: 3–21.https://doi.org/10.1093/jpe/rtr044
67. Colwell RK. EstimateS: Statistical estimation of species richness and shared species from samples. Version 9 and earlier. User’s Guide and application. University of Connecticut; 2013.
68. Levins R. Evolution in changing environments: some theoretical explorations: Princeton University Press; 1968. 120 p.
69. Morisita M. Measuring of the dispersion and analysis of distribution patterns. Memories of the Faculty of Science, Kyushu University Series E Biology 1959; 2: 215–235.
70. Horn HS. Measurement of "overlap" in comparative ecological studies. Am Nat 1966; 100: 419–424. 71. Dray S, Dufour A-B. The ade4 package: implementing the duality diagram for ecologists. J Stat Softw
2007; 22: 1–20.https://doi.org/10.18637/jss.v022.i04
72. Colwell RK, Futuyma DJ. On the measurement of niche breadth and overlap. Ecology 1971; 52: 567– 576.https://doi.org/10.2307/1934144PMID:28973805
73. Pianka ER. The structure of lizard communities. Annual Review of Ecology and Systematics 1973; 4: 53–74.https://doi.org/10.1146/annurev.es.04.110173.000413
74. Smith EP, Zaret TM. Bias in estimating niche overlap. Ecology 1982; 63: 1248–1253.https://doi.org/10. 2307/1938851
75. Mata VA, Amorim F, Corley MFV, McCracken GF, Rebelo H, Beja P. Female dietary bias towards large migratory moths in the European free-tailed bat (Tadarida teniotis). Biol Lett 2016; 12: 20150988. https://doi.org/10.1098/rsbl.2015.0988PMID:27009885
76. Czenze ZJ, Tucker JL, Clare EL, Littlefair JE, Hemprich-Bennett D, Oliveira HFM, et al. Spatiotemporal and demographic variation in the diet of New Zealand lesser short-tailed bats (Mystacina tuberculata). Ecol Evol 2018; 8: 7599–7610.https://doi.org/10.1002/ece3.4268PMID:30151174
77. Danks HV. The elements of seasonal adaptations in insects. Can Entomol 2007; 139: 1–44. Epub 2012/04/01.https://doi.org/10.4039/n06-048
78. Arrizabalaga-Escudero A, Clare EL, Salsamendi E, Alberdi A, Garin I, Aihartza J, et al. Assessing niche partitioning of co-occurring sibling bat species by DNA metabarcoding. Mol Ecol 2018; 27: 1273–1283. https://doi.org/10.1111/mec.14508PMID:29411450
79. Burgar JM, Murray DC, Craig MD, Haile J, Houston J, Stokes V, et al. Who’s for dinner? High-through-put sequencing reveals bat dietary differentiation in a biodiversity hotspot where prey taxonomy is largely undescribed. Mol Ecol 2014; 23: 3605–3617.https://doi.org/10.1111/mec.12531PMID: 24118181
80. Rostovskaya MS, Zhukova DV, Illarionova AE, Ustyugova SV, Borissenko AV, Sviridov AV. Insect prey of the Long-eared bat Plecotus auritus (L.) (Chiroptera:Vespertilionidae) in Central Russia. Russ Ento-mol J 2000; 9: 185–189.
81. Smith MA, Eveleigh ES, McCann KS, Merilo MT, McCarthy PC, Van Rooyen KI. Barcoding a quantified food web: crypsis, concepts, ecology and hypotheses. PLoS ONE 2011; 6: e14424.https://doi.org/10. 1371/journal.pone.0014424PMID:21754977
82. Gebremedhin B, FlagstadØ, Bekele A, Chala D, Bakkestuen V, Boessenkool S, et al. DNA metabar-coding reveals diet overlap between the endangered walia ibex and domestic goats—Implications for conservation. PLoS ONE 2016; 11: e0159133.https://doi.org/10.1371/journal.pone.0159133PMID: 27416020
83. Soininen EM, Zinger L, Gielly L, Yoccoz NG, Henden J-A, Ims RA. Not only mosses: lemming winter diets as described by DNA metabarcoding. Polar Biol 2017; 40: 2097–2103.https://doi.org/10.1007/ s00300-017-2114-3
84. Langton RW. Diet overlap between Atlantic cod, Gadus morhua, silver hake, Merluccius bilinearis, and fifteen other northwest Atlantic finfish. Fish Bull 1982; 80: 745–759.
85. Fechney LR. The summer diet of brook trout (Salvelinus fontinalis) in a South Island high-country stream. N Z J Mar Freshwater Res 1988; 22: 163–168.https://doi.org/10.1080/00288330.1988. 9516288
86. Schoeman MC, Jacobs DS. The relative influence of competition and prey defences on the trophic structure of animalivorous bat ensembles. Oecologia 2011; 166: 493–506. Epub 2010/12/04.https:// doi.org/10.1007/s00442-010-1854-3PMID:21128085
87. Deagle BE, Chiaradia A, McInnes J, Jarman SN. Pyrosequencing faecal DNA to determine diet of little penguins: is what goes in what comes out? Conserv Genet 2010; 11: 2039–2048.https://doi.org/10. 1007/s10592-010-0096-6
88. Deagle BE, Kirkwood R, Jarman SN. Analysis of Australian fur seal diet by pyrosequencing prey DNA in faeces. Mol Ecol 2009; 18: 2022–2038.https://doi.org/10.1111/j.1365-294X.2009.04158.xPMID: 19317847
89. Srivathsan A, Sha JCM, Vogler AP, Meier R. Comparing the effectiveness of metagenomics and meta-barcoding for diet analysis of a leaf-feeding monkey (Pygathrix nemaeus). Mol Ecol Resour 2015; 15: 250–261.https://doi.org/10.1111/1755-0998.12302PMID:25042073
90. Srivathsan A, Ang A, Vogler AP, Meier R. Fecal metagenomics for the simultaneous assessment of diet, parasites, and population genetics of an understudied primate. Front Zool 2016; 13: 17.https://doi. org/10.1186/s12983-016-0150-4PMID:27103937
91. Nakahara F, Ando H, Ito H, Murakami A, Morimoto N, Yamasaki M, et al. The applicability of DNA bar-coding for dietary analysis of sika deer. DNA Barcodes 2015; 3: 200–206. https://doi.org/10.1515/dna-2015-0021
92. Sato JJ, Shimada T, Kyogoku D, Komura T, Uemura S, Saitoh T, et al. Dietary niche partitioning between sympatric wood mouse species (Muridae: Apodemus) revealed by DNA meta-barcoding anal-ysis. J Mammal 2018; 99: 952–964.https://doi.org/10.1093/jmammal/gyy063