Publisher’s version / Version de l'éditeur:
Journal of Thermal Analysis and Calorimetry, 85, July 1, pp. 99-105, 2006-07-03
READ THESE TERMS AND CONDITIONS CAREFULLY BEFORE USING THIS WEBSITE. https://nrc-publications.canada.ca/eng/copyright
Vous avez des questions? Nous pouvons vous aider. Pour communiquer directement avec un auteur, consultez la première page de la revue dans laquelle son article a été publié afin de trouver ses coordonnées. Si vous n’arrivez pas à les repérer, communiquez avec nous à PublicationsArchive-ArchivesPublications@nrc-cnrc.gc.ca.
Questions? Contact the NRC Publications Archive team at
PublicationsArchive-ArchivesPublications@nrc-cnrc.gc.ca. If you wish to email the authors directly, please see the first page of the publication for their contact information.
NRC Publications Archive
Archives des publications du CNRC
This publication could be one of several versions: author’s original, accepted manuscript or the publisher’s version. / La version de cette publication peut être l’une des suivantes : la version prépublication de l’auteur, la version acceptée du manuscrit ou la version de l’éditeur.
For the publisher’s version, please access the DOI link below./ Pour consulter la version de l’éditeur, utilisez le lien DOI ci-dessous.
https://doi.org/10.1007/s10973-005-7353-9
Access and use of this website and the material on it are subject to the Terms and Conditions set forth at
Preparation, thermal, spectral and microscopic studies of calcium
silicate hydrate - poly(acrylic acid) nanocomposite materials
Mojumdar, S. C.; Raki, L.
https://publications-cnrc.canada.ca/fra/droits
L’accès à ce site Web et l’utilisation de son contenu sont assujettis aux conditions présentées dans le site LISEZ CES CONDITIONS ATTENTIVEMENT AVANT D’UTILISER CE SITE WEB.
NRC Publications Record / Notice d'Archives des publications de CNRC:
https://nrc-publications.canada.ca/eng/view/object/?id=92915429-ac25-40a7-b9b6-0873452d0c89 https://publications-cnrc.canada.ca/fra/voir/objet/?id=92915429-ac25-40a7-b9b6-0873452d0c89http://irc.nrc-cnrc.gc.ca
Pre pa rat ion, t he r m a l, spe c t ra l a nd
m ic rosc opic st udie s of c a lc ium silic at e
hydrat e -poly (a c r ylic a c id)
na noc om posit e m at e ria ls
N R C C - 4 7 3 6 1
M o j u m d a r , S . C . ; R a k i , L .
A version of this document is published in / Une version de ce document se trouve dans:
Journal of Thermal Analysis and Calorimetry, v. 85, 2006, pp. 99-105 doi:
Introduction
Calcium silicates hydrate (C–S–H) is the main hy-drated phase in cement paste. It has a nanocrystalline layered structure and possesses hydraulic proper-ties [1]. Poly(acrylic acid) (PAA), a carboxylic acids polymer, is known to react with multivalent metal cat-ions and forms crosslinks with metals, which are insol-uble in water and most of the organic solvents. For such polymers, Coulomb force, the strongest interac-tion, works between molecules and metal ions, hence it is considered to have an excellent potential as materials with high modulus, high strength and high heat resis-tance in the solid-state [2]. Therefore, PAA was used to synthesize C–S–HPN materials with improved proper-ties. Nanocomposite materials consisting of inorganic nanolayers of C–S–H and organic polymers have evoked intense research interest lately because their unique characteristics create many potentially com-mercial applications. The synthesis of C–S–H-based nanocomposites using a number of organic polymers was recently reported [3–7].
Composites are already widely used in such di-verse as transportation, construction, electronics and consumer products. They offer unusual combinations of stiffness, strength and mass that are difficult to attain separately from individual components [8]. On the other hand nanocomposites are a relatively new class
of materials and are defined as particle-filled polymers with ultrafine phase dimensions, typically of the order of a few nanometers [9]. Because of their nanometer size features nanocomposites possess unique proper-ties typically not shared by their more conventional microcomposite counterparts and, therefore offer new technology and business opportunities [7–16].
Organic–inorganic hybrid materials, composed of layered inorganic matrix with organic polyconjugated macromolecules in the interlayer space, have been the subjects of thorough attention of researchers for the past 5–15 years [17–46]. One of the very important materials of this type is so-called macro-defect-free (MDF) material at microscopic and nano-metric lev-els [47]. Polymers are very important additives in the manufacture and processing of various materials, where the modification of interfaces and particles sur-face functionalisations are largely influenced by the model of functional polymer. The theory of functional polymer, modification of a surface by grafting/reaction of polymer chains to/with the surface of and inorganic materials are discussed in [48, 49].
In this study the focus is on the design and synthe-sis of C–S–H-polymer nanocomposite materials with layered silicate as the inorganic phase. The approach exploits the ability of C–S–H (layered silicates) to in-tercalate between their layers a wide variety of poly-mers [5–7]. Due to the layer orientation,
polymer-sili-1388–6150/$20.00 Akadémiai Kiadó, Budapest, Hungary
© 2006 Akadémiai Kiadó, Budapest Springer, Dordrecht, The Netherlands
Journal of Thermal Analysis and Calorimetry, Vol. 85 (2006) 1, 99–105
PREPARATION, THERMAL, SPECTRAL AND MICROSCOPIC STUDIES
OF CALCIUM SILICATE HYDRATE–POLY(ACRYLIC ACID)
NANOCOMPOSITE MATERIALS
S. C. Mojumdar
*and L. Raki
Institute for Research in Construction, National Research Council of Canada, M-20, 1200 Montreal Road, Ottawa, Ontario K1A 0R6 Canada
A series of calcium silicate hydrate (C–S–H)-polymer nanocomposite (C–S–HPN) materials were prepared by incorporating poly(acrylic acid) (PAA) into the inorganic layers of C–S–H during precipitation of quasicrystalline C–S–H from aqueous solution. The as-synthesized C–S–HPN materials were characterized by X-ray fluorescence (XRF), X-ray diffraction (XRD), scanning electron microscopy-energy dispersive spectroscopy (SEM-EDS), Fourier-transform infrared (FTIR) spectroscopy, thermogravimetric analy-sis (TG) and differential scanning calorimetry (DSC). The XRD analyanaly-sis of C–S–HPN materials suggest the intermediate organiza-tions presenting intercalation of PAA within C–S–H and exfoliation of C–S–H. The SEM micrographs of C–S–H, PAA and C–S–HPN materials with different PAA contents exhibit the significant differences in their morphologies. The effect of the material’s composi-tion on the thermal stability of a series of C–S–HPN materials along with PAA and C–S–H were studied by TG, DTA and DSC. Three significant decomposition temperature ranges were observed on the TG curves of all C–S–HPN materials.
Keywords: C–S–H, C–S–HPN nanocomposites, DSC, DTA, FTIR spectroscopy, PAA, SEM, TG
cate nanocomposites also exhibit stiffness, strength and dimensional stability in two dimensions (rather than one). In addition, because of the length scale in-volved that minimizes scattering, nanocomposites are usually transparent. Furthermore, C–S–HPN materials exhibit a significant increase in thermal stability as well as self-extinguishing characteristics [1–16]. Or-ganic–inorganic nanocomposite materials are reported to promote thermal [50, 51], mechanical [52], molecu-lar barriers [53], flame retardant behavior [54–61] and corrosion protection properties [62–64]. Therefore, the systematic investigation of the reaction possibility of PAA with synthetic C–S–H at low Ca/Si ratio (0.7) as well as to characterize the nanocomposite materials by nanotechnological methods are the main interests of this contribution.
Experimental
Materials
Poly(acrylic acid)-partial Na-salt ([–CH2CH(CO2R)–]n,
R=H or Na), (MW=5000 (Aldrich Chemical Company,
Inc., Milwaukee, WI, USA), Na2SiO3·9H2O (National Silicates, Toronto Canada), Ca(NO3)2·4H2O and NaOH (Fisher Scientific, Fair Lawn, New Jersey, USA) were used to synthesize C–S–H and C–S–HPN materials. Synthesis of C–S–HPN materials
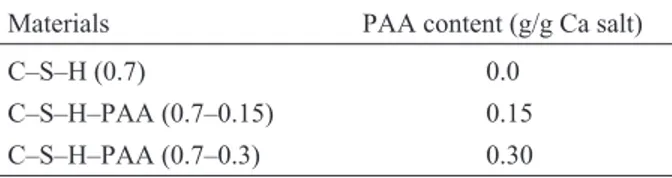
C–S–H and C–S–HPN materials with PAA contents of (0.0 and 0.15 or 0.3 g/g Ca salt) were synthesized by gradually adding calcium nitrate solution (1 mol L–1) with continual stirring under nitrogen to sodium silicate solution, which was predissolved with PAA (only for the synthesis of C–S–HPN materials) in CO2-free de-ionized water. The initial Ca/Si molar ratio was 0.7 for C–S–H and all C–S–HPN materials. The pH value was kept between 13.2–13.4 by adding NaOH solution (5.0 M) during the precipitation of C–S–H. After aging the suspension at 60°C for seven days with continuous stirring, the precipitate was separated by vacuum filtration and washed with CO2-free de-ionized water to remove sodium and nitrate ions and any residual PAA. The precipitates were then washed with acetone and dried at 60°C in a vacuum oven for 7 days. The synthetic C–S–H and C–S–HPN materials are summarized in Table 1.
Analytical methods
The powder X-ray diffraction (XRD) patterns were per-formed on a Scintag XDS 2000 X-ray diffractometer us-ing CuKa radiation at 45 kV and 35 mA between 4 and 65° (2q) with a graphite secondary monochromator. XRF analysis was performed on fusion beads made of 10 g of flux with a 66% lithium tetraborate 33% lithium metaborate fusion matrix and 1 g of sample. Beads were mounted into a Brukar AXS S4 Pioneer au-tomated XRF machine and analyzed for all elements as oxides. Samples were run under vacuum and using the default peak fitting program. Results were presented as percentages by mass of the oxide version of each ele-ment detected and normalized to 100%. Loss on igni-tion or material loss during the fusion process was ig-nored during the analysis of the results due to the highly variable polymer content of the materials being tested.
Thermal analyses (TG, DTA and DSC) on pow-der samples (~20 mg) were carried out using a simulta-neous SDT Q600 T.A.I. instrument at 10°C min–1from room temperature (rT) to 1000°C under nitrogen atmo-sphere using a flowing rate 100 mL min–1.
FTIR spectra were collected on a Bomem MB 100 spectrometer in direct transmission mode between 4000 and 400 cm–1as the average of 50 scans and a 4 cm–1 resolution. Samples were grounded to a fine powder with KBr and pressed into a disk with a 10-ton ring press. Air was used as a background for all measurements.
SEM images were acquired on a Hitachi S-4800 Field Emission Scanning Electron Microscope. Surface structure images were taken using a beam current of 2.0 keV at 10 mA. Images were acquired using an integrated frame capture with 32 frames to reduce random noise. Images were acquired at a working distance of 8 mm and each area of interest was captured a series of field magnifications from 5000 to 80000× magnification.
Energy dispersive spectrometry (EDS) was used to determine the elemental content of areas of interest. The EDS spectra were captured using a beam current of 20 keV at 10 mA. Spectral images and data were performed at a working distance of 15 mm. Semi-quan-titative results were based on ZAP software database reference values and are an indication of relative ele-mental content rather than absolute values as no refer-ence standards were used.
Results and discussion
Chemical analysis
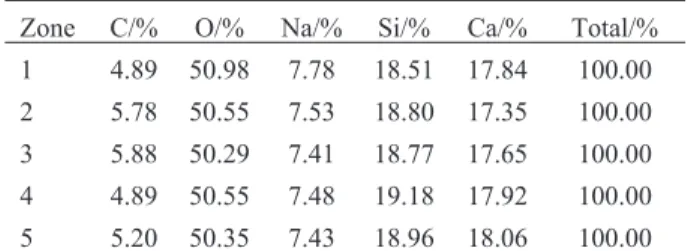
The chemical composition of C–S–H and C–S–HPN materials were determined by XRF (Table 2) and EDS (Table 3) analysis. The fusion process has been used for XRF analysis. The fusion process is an excellent
100 J. Therm. Anal. Cal., 85, 2006
MOJUMDAR, RAKI
Table 1 Synthetic C–S–H and C–S–HPN materials (Ca/Si=0.70)
Materials PAA content (g/g Ca salt)
C–S–H (0.7) 0.0
C–S–H–PAA (0.7–0.15) 0.15
way to get quantifiable elemental analysis and the fu-sion beads are resistant to change so they can be stored and reanalyzed at any time. However, the process re-quires heating the material to over 1000°C so any vola-tile components such as hydrate water, carbon, sulfur or nitrates are often burned off in the fusion process. It is a very good method to determine the Ca/Si ratio. The Ca/Si ratios of C–S–H and C–S–HPN materials con-firmed the theoretical expectation (0.7). But if the sam-ples contain polymer (carbon based), nitrates and sul-fates it is not a good method for quantification of all components especially carbon, nitrates and sul-fates. Therefore, EDS analysis has also been carried out on various zones of C–S–H and C–S–HPN materi-als to determine mainly the carbon content in C–S–HPN materials. The results of EDS analysis of a C–S–HPN material on various zones are given in Ta-ble 3 as an example. The EDS result for other samples are in the same accuracy range.
X-ray diffraction analysis
The XRD studies were performed for both C–S–H and C–S–HPN materials. The most important powder XRD peaks have been exhibited at 2q=5–9° (XRD patterns are not shown here) (interlayer spacing
d=1.22 nm for C–S–H and 1.30–1.40 nm for
C–S–HPN materials). The XRD peaks of C–S–HPN materials not only have shifted to the lower angles but also have broadened. This behavior suggests the intermediate organizations presenting both intercala-tion and exfoliaintercala-tion. The overall C–S–H layers expansion was smaller compared to PAA molecules diameter. The formation of these nanocomposites depends on the structure of the host material itself, the charge density on the surface (here the Ca/Si ratio), the method of preparation (in-situ or exchange), and
the type of organic polymers. The small expansion upon intercalation could only be explained by a single linear extension conformation of PAA molecules [2–4]. The intermediate organizations, which present both intercalation and exfoliation have also been confirmed by SEM.
SEM analysis
The SEM images of C–S–H and C–S–HPN materials are shown on Figs 1 and 2. Figure 1 represents a SEM image of pure C–S–H. The particles display a sinuous surface, typical for C–S–H [65]. A SEM mi-crograph of a C–S–HPN material, which highlights the intercalated structure, has been presented in Fig. 2 (PAA=0.15 g/g Ca salt).
FTIR spectral analysis
The most significant FTIR spectral bands of C–S–H, PAA and selected C–S–HPN materials have been given in Table 4. All FTIR spectra of C–S–H and C–S–HPN materials contain characteristic bands at the range 973–978 cm–1. These are the most intensive bands in all spectra and can be assigned to Si–O stretching vibration of the Q2 tetrahedra. The weak band at 811 cm–1in C–S–H spectra is assigned to Si–O stretching vibrations of the Q1tetrahedra (characteris-tic for monomeric structure). This peak is missing in all C–S–HPN materials suggesting the polymeric
struc-J. Therm. Anal. Cal., 85, 2006 101
CALCIUM SILICATE HYDRATE–POLY(ACRYLIC ACID) NANOCOMPOSITE MATERIALS
Table 2 XRF results of C–S–H and C–S–HPN materials
(Ca/Si=0.70) C–S–H C–S–H–PAA (0.7–0.15) C–S–H–PAA (0.7–0.3) SiO2 59.17 59.66 63.66 CaO 40.83 40.34 36.59
Ca/Si molar ratio 0.74 0.72 0.70
Table 3 EDS results of a C–S–HPN material (C–S–H–PAA
(0.7–0.3)) on various zones
Zone C/% O/% Na/% Si/% Ca/% Total/% 1 4.89 50.98 7.78 18.51 17.84 100.00 2 5.78 50.55 7.53 18.80 17.35 100.00 3 5.88 50.29 7.41 18.77 17.65 100.00 4 4.89 50.55 7.48 19.18 17.92 100.00 5 5.20 50.35 7.43 18.96 18.06 100.00
Fig. 1 SEM micrographs of synthetic C–S–H
Fig. 2 SEM micrographs of intercalated C–S–HPN material
ture. The Si–O–Si bands at 669–671 cm–1 have in-creased in intensity with the increasing polymer con-tents. The bands at 3740–3742 cm–1are due to Si–OH stretching in the isolated Si–OH species. The most striking feature of the FTIR spectra is the decreasing intensity of the bands with increasing polymer con-tents, suggests a progressively decreasing concentra-tion of Si–OH group. These are the key informaconcentra-tion of the structure of C–S–H and C–S–HPN materials. The stretching bands at 3390–3445 cm–1can be attributed to water molecules in C–S–H and C–S–HPN materials. The bands in the range of 1593–1645 cm–1are due to H–O–H bending vibrations of H2O molecules. Other bands at 448–452 cm–1are due to the internal deforma-tion of SiO4 tetrahedra. The bands in the range of 1417–1431 cm–1 correspond to the asymmetric stretching (n3) of CO3
2–
(it is not possible to prevent in-corporation of CO2during sample preparation) [66].
The characteristic vibration bands of PAA and C–S–HPN materials are observed at 3240–3337 cm–1 (–OH), 2857–2891 cm–1 (–CH2), 1410–1445 cm
–1 (O=C–OR), 1035–1093 cm–1 (C–O–C) and 831–844 cm–1 (–CH) [67]. Since the stretching vibra-tions of (O=C–OR) and CO32–
appear at very close re-gion, these two bands overlapped and become one peak in the spectra of C–S–HPN materials. The presence of PAA bands in C–S–HPN materials is the indication of the presence of PAA molecules within C–S–H, as it is also supported by XRD and SEM results.
TG, DTA and DSC studies of C–S–H, PAA and C–S–HPN materials
The most important thermoanalytical (TG, DTA and DSC) data of C–S–H, representative C–S–HPN mate-rials and bulk PAA are presented in Table 5. Figure 3 shows the TG curves of C–S–H, PAA and representa-tive C–S–HPN materials. There are significant
differ-ences in the thermal decomposition properties of C–S–H, PAA and C–S–HPN materials. C–S–HPN ma-terials exhibit higher thermal stability compared to starting materials (C–S–H and PAA).
In general, three (for PAA) and two (for C–S–H and C–S–HPN materials) significant temperature regions on TG curves have been observed:
• Region I (rT–350°C): this is the region of bound ter removal [63–68] due to the loss of molecular wa-ter with DTA peaks at 71–235°C (Table 5, Fig. 3). In the case of C–S–HPN materials, the decomposition temperature (Td) in this region is variable depending on the synthesis and material compositions (Table 5, Fig. 3). For pure PAA, this temperature region has di-vided into two regions: rT–150 and 150–250°C with two DTA peaks at 116 and 235°C, respectively. The first and second temperature regions and DTA peaks are due to the absorbed and bound water removal, re-spectively [69, 70].
102 J. Therm. Anal. Cal., 85, 2006
MOJUMDAR, RAKI
Table 4 The most important FTIR spectral data (4000–400 cm–1) of C–S–H, PAA and C–S–HPN materials
Assignments C–S–H/cm–1 C–S–H–PAA (0.7–0.15)/cm–1 C–S–H–PAA (0.7–0.3)/cm–1 PAA/cm –1 Si–O 973, 811 975 978 – Si–O–Si 670 669 671 – Si–OH 3742 3740 3741 – H–O–H 1645 1595 1593 – O–H 3390 3443 3445 3735 C–H – 2935 2934 2925 C=C – 2856 2857 2316 C=O – 1636 1639 1744 C–O – 1385 1385 1228 CO3 2– 1431 1417 1426 other bands 448 453 452
Fig. 3 TG curves of C–S–H, PAA and C–S–HPN materials
• Region II (250–550°C): this temperature region is attributed mainly to the polymeric material decom-position [68–74]. For PAA, two decomdecom-position steps are observed (Table 5, Fig. 3). DTA curve of PAA exhibits two DTA peaks at 402 and 496°C (Ta-ble 5). The first and second temperature regions and DTA peaks are due to the decomposition of car-boxyl groups [70]. However, C–S–HPN materials exhibit no significant decomposition step and no DTA peak in this region. This fact strongly suggests that carboxyl groups of PAA have reacted with C–S–H, and decomposition of carboxyl groups has not occurred in this temperature region.
• Region III (over 550°C): this temperature region is characteristic for rupture of the polymer chain [70] and structural water decomposition [71–78] with DTA peak temperature in 585–773°C range.
DSC traces of C–S–H, PAA and C–S–HPN mate-rials are presented in Fig. 4. PAA exhibits an endo-therm at 106°C corresponding to the glass transition temperature (Tg) of PAA. Tgdepends on the molecular structure of the polymer (chain stiffness, number and bulkiness of the side groups, and the inter- and intra-molecular interactions) and on the cross-link density of the polymer [79]. All the C–S–HPN materials are found to have higher Tg compared to that of C–S–H and bulk PAA, as shown in Table 5 and Fig. 4. This be-haviour is tentatively attributed to the confinement of
the intercalated polymer chains within the C–S–H gal-leries that prevents the segmental motions of the poly-mer chains. The DSC peaks of C–S–HPN materials shift to higher temperatures suggesting the intercala-tion of PAA into C–S–H. The largest shift of the endotherm (toward the higher temperature) occurs on the DSC curve of C–S–HPN material containing PAA 0.3 (g/g Ca salt). This fact suggests the greatest intercalation of the PAA molecules.
Conclusions
We have presented several examples of polymer nanocomposites with calcium silicate hydrate (layered silicate) as the inorganic phase. The materials design and synthesis rely on the ability of layered silicates to intercalate a wide range of polymers in the galleries be-tween their layers. Special emphasis has been given on a new, versatile and environmentally benign synthesis approach by solution intercalation. New calcium sili-cate hydrate/poly(acrylic acid) nanocomposite (C–S–HPN) materials, synthesized by solution tech-nique have been characterized by XRD, XRF SEM-EDS, TG, DTA, DSC and FTIR spectra. The XRD and SEM results suggest the intercalation of PAA within C–S–H. Significant differences in the morphologies of C–S–H and C–S–HPN materials with different PAA contents have been observed in SEM micrographs. The influence of the material’s composi-tions on the thermal decomposition of C–S–HPN ma-terials along with pure PAA and synthetic C–S–H has been studied by TG, DTA and DSC. The C–S–HPN materials exhibit significant increase in thermal stabil-ity compared to that of C–S–H and PAA.
This investigation introduces new routes for developing cement-based nanocomposite materials with various polymers for future potential applications in the construction field. A study to elucidate the effect of PAA molecules intercalation on Ca/Si ratio of C–S–HPN materials by means of thermal conductivity, TMA, XPS, NMR spectra, TEM and AFM microscopy will be presented in a future contribution.
J. Therm. Anal. Cal., 85, 2006 103
CALCIUM SILICATE HYDRATE–POLY(ACRYLIC ACID) NANOCOMPOSITE MATERIALS
Table 5 Summary of thermal analysis data for C–S–H, PAA and C–S–HPN materials
Compound Td/°C DTA peak/°C Tg/°C
C–S–H 250, over 550 71, 693 87
C–S–H–PAA (0.7–0.15) 250, 550, over 550 136, 761 142
C–S–H–PAA (0.7–0.3) 350, 550, over 550 143, 773 154
PAA 150, 250, 437, 550, over 550 116, 235, 402, 496, 585 106
Td=decomposition temperature, Tg=glass transition temperature
Fig. 4 DSC curves of C–S–H, PAA and C–S–HPN materials
Acknowledgements
The authors would like to thank Peter Collins for FTIR spectro-scopic analysis, Gordon Chan for TG-DTA-DSC measurements and Jim Margeson for performing XRF and SEM-EDS analysis.
References
1 H. Matsuyama and J. F. Young, J. Mater. Res., 14 (1999) 3379. 2 Y. Gotoh, Y. Ohkoshi and M. Nagura, Transaction,
55 (1999) 522.
3 H. Matsuyama and J. F. Young, J. Mater. Res., 14 (1999) 16. 4 H. Matsuyama and J. F. Young, Chem. Mater.,
11 (1999) 3389.
5 S. C. Mojumdar and L. Raki, J. Therm. Anal. Cal., 82 (2005) 89.
6 S. C. Mojumdar and L. Raki, Preparation and Properties of Calcium Silicate Hydrate Polymer Nanocomposite, 107thAmerican Ceramics Society Annual Meeting, Exposition and Technology Fair, Baltimore, MD, USA April 10–13, 2005.
7 S. C. Mojumdar and L. Raki, J. Therm. Anal. Cal., 82 (2005) 89.
8 E. P. Giannelis, Adv. Mater., 8 (1996) 29.
9 M. Alexandre and P. Dubois, Mater. Sci. Eng., 28 (2000) 1. 10 J. E. Mark, Polym. Eng. Sci., 36 (1996) 2905.
11 E. Reynaud, C. Gauthier and J. Perez, Rev. Metall./Cah. Inf. Tech., 96 (1999) 169.
12 T. Von Werne and T. E. Patten, J. Am. Chem. Soc., 121 (1999) 7409.
13 N. Heron and D. L. Thorn, Adv. Mater., 10 (1998) 1173. 14 P. Cavert, Potential application of nanotubes,
in: T. W. Ebbesen (Ed.), Carbon Nanotubes, CRC Press, Boca Raton, FL 1997, pp. 277–292.
15 V. Favier, G. R. Canova, S. C. Shrivastava and J. Y. Cavaille, Polym. Eng. Sci., 37 (1997) 1732.
16 L. Chazeau, J. Y. Cavalle, G. Canova, R. Dendievel and B. Boutherin, J. Appl. Polym. Sci., 71 (1999) 1797. 17 M. Delucchi and G. Cerisola, Constr. Build. Mater.,
15 (2001) 351.
18 M. G. Kanatzidis and L. M. Tonge, J. Am. Chem. Soc., 109 (1987) 3797.
19 M. Drábik, L. Gáliková, K. G. Varshney and M. A. Quraishi, J. Therm. Anal. Cal., 76 (2004) 91.
20 G. K. D. Pushpalal, J. Mater. Sci., 35 (2000) 981. 21 B. X. Li, W. Q. Liang, W. S. Zhang and Z. He,
J. Chin. Cer. Soc., 28 (2000) 325.
22 S. C. Mojumdar, J. Therm. Anal. Cal., 64 (2001) 1133. 23 J. D Birchal, A. J. Howard, K. Kendal and J. H. Raistrick,
1988, June, Cementitious Composition and Cementitious Product of High Flexural Strength, European Pat. Specifica-tion, B1, No. 0055035, pp. 1–17.
24 M. Drabik, S. C. Mojumdar and L. Galikova, Cem. Concr. Res., 31 (2001) 751.
25 J.A. Lewis and P.G. Desai, 1996, MAETA Workshop on High Flexural Polymer-Cement Composite, Sakata 3–4 October, pp. 49–58.
26 S. C. Mojumdar and M. Drabik, Science of cement and con-crete-Kurdowski Symposium (Akapit Scientific Publisher, Poland 2001).
27 S. C. Mojumdar, A. Ray, M. Drábik, A. Cigan, F. Hanic and P. Capek, Sol. Stat. Phenom., 90–91 (2003) 365. 28 M. Drabik, L. Galikova and S. C. Mojumdar,
Key Eng. Mater., 206–213 (2002) 1867.
29 S. C. Mojumdar, Thermophysics 2001, October 23–25, 2001, Ra¹ková Dolina, High Tatras, Slovakia, pp. 93–98. 30 K. Kendal, A. J. Howard and J. D. Birchal,
Philos. Trans. R. Soc., A310 (1983) 139. 31 M. Drábik, S. C. Mojumdar and R. C. T. Slade,
CERAMICS – Silikaty, 46 (2002) 68.
32 B. X. Li, W. Q. Liang and Z. He, J. Wuhan Univ. Technol., 16 (2001) 25.
33 S. C. Mojumdar and L. Raki, Res. J. Chem. Environ., submitted.
34 M. Delucchii and G. Cerisola, Constr. Build. Mater., 15 (2001) 351.
35 S. C. Mojumdar, Challenges for Coord. Chemistry in the new century, 5 (2001) 453.
36 R. Alfani, P. Colombet, A. D’Amore, N. Rizzo and L. Nicolais, J. Mater. Sci., 34 (1999) 5683.
37 S. C. Mojumdar, Res. J. Chem. Environ., 9 (2005) 23. 38 C. Y. Rha, J. W. Seong, C. E. Kim, S. K. Lee and W. K. Kim,
J. Mater. Sci., 34 (1999) 4653.
39 C. K. Park, J. Ceram. Soc. Jpn., 106 (1998) 268. 40 J. A. Lewis and M. A. Boyer, Adv. Cem. Bas. Mater.,
2 (1995) 2.
41 M. Tan, J. Lu and K. Wu, Cem. Concr. Res., 24 (1994) 1185. 42 P. G. Desai, J. A. Lewis and D. P. Bentz, J. Mater. Sci.,
29 (1994) 711.
43 I. A. A. Ibrahim, H. H. El Sersy and M. F. Abadir, J. Therm. Anal. Cal., 76 (2004) 713.
44 J. Dweck, P. F. Ferreira da Silva, R. Silva Aderne, P. M. Büchler and F. K. Cartledge, J. Therm. Anal. Cal., 71 (2003) 821.
45 S. C. Mojumdar, B. Chowdhury, K. G. Varshney and K. Mazanec, J. Therm. Anal. Cal., 78 (2004) 135. 46 T. Lan, P. D. Kaviratna and T. J. Pinnavaia, Chem. Mater.,
6 (1994) 573.
47 I. Odler, Special Inorganic Cement, Capter 13.3, MDF cement, E & F. N. Spon, London, New York 2000. 48 G. Wegner, Acta Materialia (The millennium special issue),
48 (2000) 253.
49 M. Drabik and R.C.T. Slade, Interf. Sci., 12 (2004) 375. 50 M. Zanetti, P. Bracco and L. Costa, Polym. Degrad. Stab.,
85 (2004) 657.
51 H.-L. Tyan, Y.-C. Liu and K.-H. Wei, Chem. Mater., 11 (1999) 1942.
52 Z. Wang and T. J. Pinnavaia, Chem. Mater., 10 (1998) 3769. 53 J. Liu, Y. Gao, F. Wang and W. Ming, J. Appl. Polym. Sci.,
75 (2000) 384.
54 J. W. Gilman, Appl. Clay Sci., 15 (1999) 31.
55 J. W. Gilman, C. L. Jackson, A. B. Morgan, J. R. Hayyis, E. Manias, E. P. Giannelis, M. Wuthenow, D. Hilton and S. H. Philips, Chem. Mater., 12 (2000) 1866.
56 D. Porter, E. Metcalfe and M. J. K. Thomas, Fire Mater., 24 (2000) 45.
57 J. Wang, J. Dua, J. Zhu and C. A. Wilkie, Polym. Degrad. Stab., 77 (2002) 249.
58 M. Zanetti, G. Camino, D. Canavese, A. B. Morgan, F. J. Lamelas and C. A. Wilkie, Chem. Mater., 14 (2002) 189. 59 M. Zanetti, T. Kashiwagi, L. Falqui and G. Camino,
Chem. Mater., 14 (2002) 881.
104 J. Therm. Anal. Cal., 85, 2006
60 J. Zhu, P. Start, K. A. Mauritz and C. A. Wilkie, Polym. Degrad. Stab., 77 (2002) 253.
61 J. Zhu, F. Uhl, A. B. Morgan and C. A. Wilkie, Chem. Mater., 13 (2001) 4649.
62 J. M. Yeh, S. J. Liou, C. Y. Lai, P. C. Wu and T. Y. Tsai, Chem. Mater., 13 (2001) 1131.
63 J. M. Yeh, C. L. Chen, Y. C. Chen, C. Y. Ma, K. R. Lee, Y. Wei and S. Li, Polymer, 43 (2002) 2729.
64 J. M. Yeh, S. J. Liou, C. Y. Lin, C. Y. Cheng, Y. W. Chang and K. R. Lee, Chem. Mater., 14 (2002) 154.
65 I. Pointeau, B. Piriou, M. Fedoroff, M. G. Barthes, N. Marmier and F. Fromage, J. Coll. Inter. Sci., 236 (2001) 252.
66 P. Yu, R. J. Kirkpatrick, B. Poe, P. F. McMillan and X. Cong, J. Am. Ceram. Soc., 82 (1999) 742.
67 G. Cardenas, C. Munoz and H. Carbacho, Eur. Polym. J., 36 (2000) 1091.
68 B. Chowdhury, J. Therm. Anal. Cal., 78 (2004) 215. 69 X.-D. Fan, Y.-L. Hsieh, J. M. Krochta and M. J. Kurth,
J. Appl. Polym. Sci., 82 (2001) 1921.
70 N. Sebastian, B. George and B. Mathew, Polym. Degrad. Stab., 60 (1998) 371.
71 M. Drabik, L. Galikova, F. Hanic and J. H. Sharp, Chem. Papers, 51 (1997) 363.
72 M. Drabik, L. Galikova and P. Zimermann, J. Therm. Anal. Cal., 56 (1999) 117.
73 I. Janotka and L’. Kraj¹i, Bul. Mater. Sci., 23 (2000) 521. 74 H. F. W. Taylor, Cement Chemistry, 2ndEdn. (Thomas
Telford Publ., London 1998).
75 I. Janotka, L’. Kraj¹i, A. Ray and S. C. Mojumdar, Cem. Concr. Res., 33 (2003) 489.
76 C. A. Strydom and J. H. Potgieter, An investigation into the chemical nature of the reactivity of lime, Proc. 10thInt. Congr. Chem. Cement (Ed. H. Justnes, Sweden 1997). 77 I. Janotka and S. C. Mojumdar, Sol. Stat. Phenom.,
90–91 (2003) 309.
78 I. Janotka, T. Nürnbergerová and L. Nad, Magaz. Concr. Res., 52 (2000) 399.
79 S. J. Kim, K. J. Lee, S. M. Lee, I. Y. Kim, Y. M. Lee and S. I. Kim, J. Appl. Polym. Sci., 88 (2003) 2670.
DOI: 10.1007/s10973-005-7353-9
J. Therm. Anal. Cal., 85, 2006 105