Contribution of the carbohydrate moiety to conformational
stability of the carboxypeptidase Y
High pressure study
Mireille Dumoulin1, Hiroshi Ueno1, Rikimaru Hayashi1and Claude Balny2
1Division of Applied Life Sciences, Graduate School of Agriculture, Kyoto University, Japan;2INSERM, Unite 128, IFR 24, CNRS 1919,
Montpellier, France
The process of pressure-induced denaturation of carboxypeptidase Y and the role of the carbohydrate moiety in its response to pressure and low temperature were investigated by measuring in situ the catalytic activity and, the intrinsic and 8-anilino-1-naphthalene sulfonic acid binding fluorescences.
Pressure-induced denaturation of carboxypeptidase Y is a process involving at least three transitions. Low pressures (below 150 MPa) induced slight conformational changes characterized by a slight decrease in the center of the spectral mass of intrinsic fluorescence, whereas no changes in 8-anilino-1-naphthalene sulfonic acid binding fluorescence were observed and 80% of the catalytic activity remained. Higher pressure (150±500 MPa) induced further conformational changes, characterized by a large decrease in the center of the spectral mass of intrinsic fluorescence, a large increase in the 8-anilino-1-naphthalene sulfonic acid binding fluorescence and the loss of all catalytic activity. Thus, this intermediate exhibited characteristics of molten globule-like state. A further increase, in pressure (above 550 MPa) induced transition from this first molten globule-like state to a second molten globule-like state. This two-stage denaturation process can be explained by assuming the existence of two independent structural domains in the carboxypeptidase molecule.
A similar three-transition process was found for unglycosylated carboxypeptidase Y, but, the first two transitions clearly occurred at lower pressures than those for glycosylated carboxypeptidase Y. These findings indicate that the carbohydrate moiety protects carboxypeptidase Y against pressure-induced denaturation. The origin of the protective effects is discussed based on the known crystallographic structure of CPY.
Keywords: carboxypeptidase Y; fluorescence spectrometry; high pressure; protein denaturation; unglycosylation. Carboxypeptidase Y (CPY), a 61-kDa vacuolar enzyme from
Saccharomyces cerevisiae belongs to the family of serine proteases [1]. Its catalytic triad is made of Ser146, Asp338 and His397. This monomeric enzyme, which consists of 421 amino-acid residues and five disulfide bonds, is a glycopro-tein [2]. The carbohydrate moiety accounts for about 16% of the molecular mass [3] and consists of four asparagine-linked phosphorylated oligosaccharide chains of roughly equal size [Man9±18(GlcNAc)2(PO42±)0±2] [4±7].
Although much is known about the structure and biosynthesis of the oligosaccharides in CPY, the definitive role of the associated sugar moiety in the structure and function of this enzyme has yet to be established. Studies carried out with carbohydrate-free CPY, obtained by growing yeast in the presence of an inhibitor of N-linked glycosylation or by mutation, showed that the carbohydrate moiety does not affect the processing of the CPY precursor, its accurate vacuolar targeting, or its transport, but the rate of transport of unglycosylated CPY through secretory pathway to the vacuole was reduced [5,8]. Complete removal of carbohydrate by endo
b-N-acetylglucosaminidase H increased the respective rates of SDS-induced inactivation and proteolytic degradation by two and threefold, compared to the rates for glycosylated CPY [9]. However, neither the in-vivo nor the in-vitro stability and activity of unglycosylated CPY obtained by mutation were significantly different than that of wild-type CPY (WtCPY) [8]. High pressure is increasingly used as a `reagentless denaturant' to study the protein denaturation [10]. This tool is especially well adapted to the study of cold denaturation of protein because pressure decreases the freezing point of water [11]. Therefore, cold denaturation can be studied without using a cryoprotectant (which may interact with the protein, making interpretation more complicated).
Intrinsic and 8-anilino-1-naphthalene sulfonic acid (ANS)-binding fluorescence spectroscopies are useful tech-niques to study structural changes during protein denaturation. The intrinsic fluorescence of protein is mainly due to tryptophan and tyrosine residues [12]. The wavelength at maximum fluorescence, thus the center of the spectral mass, depends on the polarity of the environment around these residues, i.e. the center of the spectral mass decreases as the polarity of the environment increases [13]. On the basis of this characteristic, the environment of the tryptophan and tyrosine residues can be monitored experimentally upon protein denaturation. CPY is composed of nine tryptophan and 23 tyrosine residues evenly distributed throughout the entire protein molecule. The intrinsic fluorescence of CPY therefore can be used to trace the overall denaturation. ANS is a fluorescent probe specific for the hydrophobic regions of a protein molecule. It is used to monitor
Correspondence to R. Hayashi, Division of Applied Life Sciences, Graduate School of Agriculture, Kyoto University, Sakyo-ku, Kyoto 606-8502, Japan. Fax: + 81 75 753 6128, Tel.: + 81 75 753 6111.
Abbreviations: ANS, 8-anilino-1-naphthalene sulfonic acid; ATEE, N-acetyl l-tyrosine ethyl ester; CPY, carboxypeptidase Y; DglyCPY, unglycosylated CPY; WtCPY, wild-type CPY.
Enzymes: carboxypeptidase Y (EC 3.4.16.1). (Received 27 January 1999, accepted 10 March 1999)
protein denaturation because its fluorescence is enhanced when it is bound to solvent-exposed hydrophobic areas of proteins [13,14]. Both techniques have been adapted for use in high-pressure studies [10].
Some effects of high pressure on the activity and structure of CPY have been published [15]; but, in those studies the conformational transition could not be fully observed because of technical limitations. Moreover, CPY is very resistant to cold denaturation, i.e. several freezing-thawing cycles at atmospheric pressure do not inactivate this enzyme [1,16]. In our opinion, this unique property of CPY arises from its high oligosaccharide content. For this reason, high pressure appeared to be of special interest for investigating the role of the carbohydrate moiety in the conformational stability and activity of CPY in the low-temperature range. We describe the pressure-induced denatura-tion process and discuss the possible role of the carbohydrate moiety in the response to high pressure and low temperature based on in-situ intrinsic CPY and ANS-binding fluorescence spectroscopy findings and measurements of enzymic activity. MATERIALS AND METHODS
Enzymes
WtCPY was purified as described previously [1] with modifi-cations [17]. Unglycosylated CPY (DglyCPY) was obtained by site-directed mutagenesis. In this mutant enzyme, the asparagine residues of the four Asn-Xaa-Thr glycosylation sites have been replaced by alanine residues. The enzyme was expressed in S. cerevisiae and purified by a modification of the procedure used for WtCPY. The main modifications were disruption of the cells by glass beads and the lack of the activation step, not required because DglyCPY was already in the active state after cell disruption [18]. Some of the DglyCPY we used was prepared by H. Shimizu [18]. Both enzyme preparations were electrophoretically pure. The specific activity of DglyCPY was similar to that of WtCPY, therefore it was assumed that complete unglycosylation has no effect on the tertiary structure of the enzyme. Both enzymes were stored in solution in 10 mm potassium phosphate buffer, pH 7, at 220 8C and at concen-trations of at least 2 mg´mL21. Under these conditions WtCPY
is stable for at least 2 years [1], and DglyCPY at least for the duration of this experiment.
Buffer and chemicals
Tris buffer, ANS (lot M6B9346) and N-acetyl l-tyrosine ethyl ester (ATEE; lot M3K6958) were obtained from Nacalai Tesque (Kyoto, Japan). Tris/HCl buffer was chosen because its pK does not change significantly as a function of pressure [19]. Activity measurement
In-situ effects of pressure on the catalytic activity of CPY were investigated by measuring the apparent second-order rate of ATEE hydrolysis. Absorbance changes at 237 nm were recorded under pressure using a high-pressure optical cell (Teramecs, Kyoto, Japan) set inside a Shimidzu UV-2500 spectro-photometer [20]. The activation volumes (DV±) were derived
from the pressure dependence of the apparent second-order rate constant according to the equation:
DV± ±RT 2ln k/2P
T DG0/2PT 1
where k is the relative apparent second-order rate constant kcat/Km.
Fluorescence spectroscopy
Both intrinsic and ANS-binding fluorescence measurements were made with a AB2 fluorospectrophotometer (SLM Co.), modified in the INSERM laboratory to measure the fluorescence in the pressure range from 0.1 to 700 MPa through a thermostated high-pressure cell as described previously [21,22]. Each spectrum was the result of three accumulations. Fluorescence intensities were first corrected by subtracting the fluorescence spectra of the buffer (for intrinsic fluorescence) or the free ANS in buffer (for ANS-binding fluorescence) at each pressure. Then, they were corrected for volume contraction under high pressure based on the published compressibility of water and solutions [23].
The excitation wavelength was 280 nm for intrinsic fluores-cence measurements, therefore recorded spectra (between 300 and 400 nm) were the sum of the tryptophan and tyrosine contributions. The center of the spectral mass, defined below, was used to quantify the spectra [13,24]:
n Sni£ Fi/SFi 2
where ni is the wave number and Fi the fluorescence
intensity at ni.
The excitation wavelength was 350 nm for ANS-binding fluorescence, and emission spectra were recorded between 420 and 600 nm. The fluorescence intensity at the peak wavelength (475 nm) was used to quantify the pressure-induced changes. The ANS concentration was 65 mm in 50 mm Tris/HCl buffer, pH 7, as determined spectrophotometically at 350 nm using 5000 cm21´m21as the molar absorption coefficient.
Experimental procedures. The enzyme concentration in all the experiments was 0.1 mg´mL21(1.60 mm for WtCPY or 1.95 mm
for DglyCPY). After each change of temperature or pressure, the system was allowed to equilibrate for 5 min before the spectral recording. When experiments were performed at 25 8C, the sample was pressurized to about 100 MPa at 25 8C then, the temperature was lowered to 25 8C. When experiments were performed at 212.5 8C, the sample was pressurized to about 200 MPa at 5 8C then the temperature was lowered to 212.5 8C. Under these conditions, the sample solution remained in the liquid state. The equilibrium temperature of the solid and liquid of type I ice is lowered as pressure increases up to 200 MPa, pressure at which the freezing temperature of water is about 222 8C [11]. The highest pressure that could be applied at a given temperature was derived from the water phase-transition diagram, i.e. about 500 MPa below 25 8C [11]. Water condensation and ice formation on the sapphire windows were avoided by flushing them with a fine, dry-nitrogen gas flow. Determination of thermodynamic parameters. The thermo-dynamic parameters DG0 and DV of the pressure-induced
spectral transitions were determined by analyzing the center of the spectral mass (intrinsic fluorescence) or fluorescence intensity at 475 nm (ANS-binding fluorescence). A two-state transition with a constant reaction volume was assumed [25]. If a physical parameter is assumed to take distinct values in these two states, A1 and A2, and an increase of pressure to cause a
transition from one to the other state, then the equilibrium constant at a given pressure (K(P)) is
K P A2±A P/ A P±A1 3
where A(P)is the intermediate value of the parameter at a given
The pressure dependence of K(P) is related to DG at
P = 0.1 MPa (DG0) and DV as follows:
±RT ln K P DG0 P £ DV 4
Combining Eqns (3) and (4),
A P A2 A1±A2/{1 e± DG0P£DV/ RT} 5
The fit of A = F(P) in Eqn (5) was used to determine the thermodynamic parameters.
The pressure of half transition (P1/2) is given by:
P1/2 ±DG0/DV 6
RESULTS
Effect of pressurization at 25 8C on the intrinsic fluorescence of WtCPY and DglyCPY
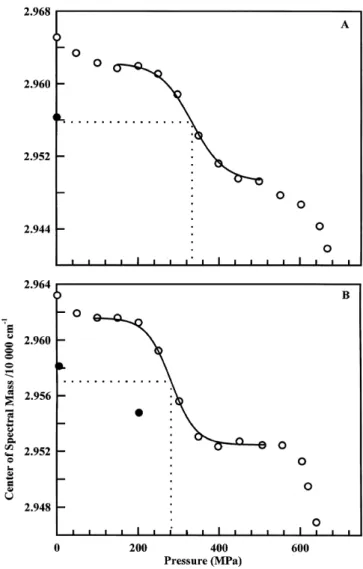
A gradual decrease in the center of the spectral mass of the intrinsic fluorescence spectrum of WtCPY occurred with increas-ing pressure at 25 8C (Fig. 1A), indicatincreas-ing that the tryptophan and tyrosine residues become more exposed to the solvent (water) due to the pressure-induced unfolding of the WtCPY molecule (pressure limited at 650 MPa). The transition curve did not follow a simple two-state transition, but WtCPY unfolding seemed to occur through a multistep process, of at least three transitions (or four states) although the final state of the third transition was not reached. The first transition was completed at about 130 MPa, the second transition occurred between roughly 200 and 500 MPa and the last transition began at a pressure higher than 540 MPa. After pressure release from the highest pressure tested, changes in the center of the spectral mass of the intrinsic fluorescence were only partially reversible, as shown by the closed circle in Fig. 1A. Based on the clear sigmoidal shape of the second transition, its pseudo-thermodynamic parameters, DG0app and DVapp, were
calculated assuming a two-step transition (the superscript app means the apparent and pseudo-thermodynamic parameters for fundamentally nonequilibrium (irreversible) transition [15]). These parameters were DG0app= 20.6 kJ´mol21 and
DVapp = 261 mL´mol21. The pressure of half transition was
334 MPa.
Effects of pressure increases at 25 8C on the intrinsic fluorescence of DglyCPY were similar to those for WtCPY (Fig. 1B); the unfolding of DglyCPY also proceeded via at least three transitions. This suggests that the carbohydrate moiety does not affect the global unfolding pathway of CPY. After pressure release from the highest pressure applied, the changes observed were only partly reversible, as shown by the closed circle. The main difference between WtCPY and DglyCPY is that the first and second transitions clearly occurred at lower
pressures for DglyCPY, suggesting that its conformation is more easily perturbed by the pressure. Indeed, the pressure of the half-second transition was P1/2= 282 MPa; 52 MPa lower than that
of WtCPY. The pseudo-thermodynamic parameters were DG0app= 22.9 kJ´mol21 and DVapp=280 mL´mol21. The
Fig. 1. In-situ pressure-induced changes in the center of the spectral mass (intrinsic fluorescence) of WtCPY (A) and DglyCPY (B). Pressure increase (W); pressure release from the highest pressure (X). Temperature, 25 8C; [Enzyme] = 0.1 mg´mL21in 50 mm Tris/HCl buffer, pH 7.
Excita-tion wavelength, 280 nm. Curves fitted to the second transiExcita-tion were drawn for WtCPY (A) using, DG0app= 20.6 kJ´mol21, DVapp= 261 mL´mol21;
and for DglyCPY (B), DG0app= 22.9 kJ´mol21, DVapp= ±80 mL´mol21.
Dotted lines show the half of the second transition.
Table 1. Apparent pseudo-thermodynamic parameters of pressure-induced transition between 150 and 500 MPa for WtCPY and DglyCPY measured at different temperatures. Standard errors are approximately ^ 5%. ND, not determined because transition was not complete (see text). NM, not measured.
WtCPY DglyCPY Temperature (8C) DG0 app (kJ´mol21) DV app (mL´mol21) P(MPa)1/2 DG0 app (kJ´mol21) DV app (mL´mol21) P(MPa)1/2 25 20.6a ±61a 334a 22.9a ±80a 282a 16.5b ±47b 344b 18.7b ±59b 309b ±5 15.0a ±64a 229a 24.8a ±129a 190a 19.6b ±93b 208b 19.0b ±102b 183b ±12.5 ND ND 165a ND ND 135a NM NM NM NM NM NM
lower P1/2-value than WtCPY was due to a larger negative
DVapp(Table 1).
Effect of pressurization at 25 8C on the ANS-binding fluorescence of WtCPY and DglyCPY
ANS-binding fluorescence was also used to study confor-mational changes induced by pressure. Figure 2A shows the
fluorescence intensity at 475 nm (wavelength peak of bound ANS) of ANS-WtCPY as a function of pressure. At 0.1 MPa, the fluorescence intensity was relatively low, indicating that ANS has only very low affinity for native WtCPY. As pressure increased, ANS-binding fluorescence was progressively enhanced (open circle) indicating that ANS binds progressively to WtCPY as the pressure increases, in other words the
Fig. 2. In-situ pressure-induced changes in the ANS-CPY binding fluorescence of WtCPY (A) and DglyCPY (B). Pressure increase (W); pressure release from the highest pressure (X). Temperature, 25 8C; [Enzyme] = 0.1 mg´mL21in 50 mm Tris/HCl buffer pH 7; [ANS] = 65 mm
in 50 mm Tris/HCl buffer, pH 7. Excitation wavelength, 350 nm. Curves fitted to the second transition were drawn for WtCPY (A) using, DG0app= 16.5 kJ´mol21, DVapp= 247 mL´mol21; and for DglyCPY (B),
DG0app= 18.7 kJ´mol21, DVapp= ±59 mL´mol21. Dotted lines show the
half of the second transition.
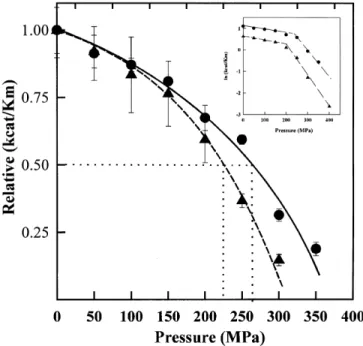
Fig. 3. In-situ pressure-induced changes in the apparent second-order rate constant of ATEE hydrolysis. (X), WtCPY; (O) DglyCPY. Temperature, 25 8C; [ATEE] = 0.2 mm in 50 mm Tris/HCl buffer, pH 7; [Enzyme] = 20±60 nm (depending on the activity). Apparent rate constants are relative to that at 0.1 MPa and 25 8C. A new enzyme/substrate solution was used for each pressure. Measurements were repeated under each condition at least twice. Error bars are smaller than the symbols when not visible. Dotted lines show the pressure causing 50% inactivation. Inset, ln(kcat/Km) vs. pressure.
Table 2. Activation volume DV³ determined from pressure dependence of the apparent second-order rate of ATEE hydrolysis by WtCPY and DglyCPY measured at 25 8C. Standard errors are approximately 5%. Pressure DV³ (mL´mol21)
(MPa) WtCPY DglyCPY
, 200 3.3 4.5
. 200 21.8 34.3
Fig. 4. Temperature dependence of the pressure of half the transition (P1/2) that occurred between 150 and 500 MPa. [Enzyme] = 0.1 mg´mL21
in 50 mm Tris/HCl buffer, pH 7. From intrinsic fluorescence: (W), WtCPY; (X), DglyCPY. From ANS-binding fluorescence: (A), WtCPY; (B), DglyCPY.
hydrophobic core of WtCPY becomes more exposed to solvent due to pressure-induced unfolding. Upon pressure release, the fluorescence intensity at 475 nm decreased but did not return to the initial value (closed circle). The transition curve of ANS-binding fluorescence did not follow a single two-state transition, but occurred through two transitions (or three states). This differs from the three-transition process found with intrinsic fluorescence spectroscopy (Fig. 1A). Indeed, at pressures lower than 200 MPa, where the first transition occurred with intrinsic fluores-cence, there was almost no ANS-binding fluorescence increase. The first ANS-binding fluorescence transition occurred roughly between 200 and 540 MPa. The pseudo-thermodynamic parameters for this transition were DG0app16.5 kJ´mol21 and DVapp= 247 mL´mol21. The
pressure of half transition was 344 MPa. The good agreement of this latter value with that of the second transition determined from the intrinsic fluorescence of WtCPY (334 MPa) suggests that they correspond to the same conformational transition. The second transition of ANS-binding fluorescence started at a pressure higher than 540 MPa and no saturation was observed even at the highest pressure applied (630 MPa).
The pressure increase induced similar changes in ANS-DglyCPY fluorescence (Fig. 2B), but the first transition occurred at a pressure lower than that for WtCPY (P1/2was 309
and 344 MPa, respectively). After pressure release, the changes in ANS-binding fluorescence were also only partly reversible (Fig. 2B, closed circle). The pseudo-thermodynamic para-meters for this transition were DG0app= 18.7 kJ´mol21 and
DVapp= 259 mL´mol21.
Effects of pressurization at 25 8C on catalytic activity of WtCPY and DglyCPY
Figure 3 shows the pressure dependence (compared to that at 0.1 MPa) of the relative apparent second-order rate of the hydrolysis of ATEE for both WtCPY and DglyCPY at 25 8C and pH 7. A fresh enzyme/substrate solution was used for each pressure treatment. The substrate concentration was kept at 0.2 mm (roughly , 10% of Km) in order to access the apparent
second order rate. The activation volumes (DV±) were
calculated from Eqn (1). As shown in Fig. 3 inside, the plot of ln(kcat/Km) vs. pressure was linear but biphasic. This behavior
may be related to the multistep process observed with intrinsic fluorescence spectroscopy. The pressure producing a 50% decrease in the activity was 260 MPa for WtCPY and 230 MPa for DglyCPY. To calculate DV³, two pressure ranges were considered: from 0.1 to 200 MPa and pressures above 200 MPa. Table 2 gives the values obtained. The extent of inactivation was limited for WtCPY and DglyCPY at pressures lower than 200 MPa, DV³ was 3.3 and 4.5 mL´mol21,
respectively, for WtCPY and DglyCPY. At higher pressures, both enzymes were more extensively inactivated. In the pressure domain above 200 MPa, DV³ was 21.8 and 34.3 mL´mol21,
respectively, for WtCPY and DglyCPY. Under 400 MPa, the maximum pressure for absorption measurement in our labora-tory, the remaining activity of DglyCPY was 3.3%. As 400 MPa coincides only just to the end of the second transition (slight changes of ANS-binding fluorescence occurred up to 450 MPa), it is likely that a small amount of nondenatured protein remains under this pressure. Thus, the remaining activity is likely to be associated with the nondenatured protein, whereas the denatured protein is fully inactive. The same conclusion can be inferred for WtCPY.
Effects of temperature on pressure-induced conformational changes
The effects of pressure at subzero temperatures (25 and 212.5 8C) on the conformation of WtCPY and DglyCPY were investigated. To keep the sample in the liquid state, the pressure was first set near the target value then, the temperature was lowered to the desired value (see Materials and methods).
Because of the technical restraints described above, the transition that occurred at about 100 MPa at 25 8C in the intrinsic fluorescence studies was not observable in experiments at subzero temperatures. At 25 8C, the second transition was completed (both initial and final plateaus were observed) and the pseudo-thermodynamic parameters could be calculated, but the final point of the third transition could not be reached. At 212.5 8C, the first point was determined under 200 MPa and was located on the exponential transition. In other words, roughly half the second transition was reached. Therefore, P1/2
could only be estimated. The third transition was not completed. Studies of ANS-binding fluorescence were also performed at 25 8C.
Table 1 gives all the pseudo-thermodynamic parameters determined for the transition that occurs between 150 and 500 MPa. The P1/2-values found for the intrinsic and
ANS-binding fluorescence at a given temperature are quite similar (Table 1). For both enzymes, in both intrinsic and ANS-binding fluorescence studies, there is the tendency for P1/2
to decrease with a decrease in temperature (Fig. 4). This is consistent with the elliptical shape for enzyme inactivation and denaturation reported by others [26,27]. In general, the decrease in P1/2with the decrease in temperature was due to marked drop
in DVapp (Table 1). Figure 4 also indicates that P 1/2 for
DglyCPY is about 45 MPa lower than that for WtCPY at any given temperature of pressurization. This difference is mainly due to a larger negative DVapp for DglyCPY than for WtCPY
(Table 1), whereas DG0appseems to be less affected.
DISCUSSION
Pressure-induced denaturation process of CPY
Results of in-situ intrinsic and ANS-binding fluorescence and those of enzymic inactivation under pressure showed that pressure-induced denaturation of CPY at 25 8C underwent the same global pathway whether or not the enzyme was glycosylated. A process of at least three transitions is inferred.
Relatively low pressures (below 150 MPa) induced confor-mational changes as shown by the decrease in the center of the spectral mass of the intrinsic fluorescence spectra (Fig. 1). These conformational changes are probably small as the amplitude of the changes in the center of the spectral mass is small and the hydrophobic core of the protein is not affected (no increase in ANS-binding fluorescence, Fig. 2). Moreover, in that pressure range, almost 80% of the catalytic activity of both enzymes remained (Fig. 3). Because the structural changes in this pressure region are small, this slight decrease in activity might be due to direct pressure effects on catalytic phenomena. Higher pressures, between 150 and 500 MPa, induced greater change in the intrinsic fluorescence spectra with a concomitant increase in the exposure of the CPY hydrophobic core to the solvent (Figs 1 and 2). In that pressure range, denatured enzymes lost all their activity. Therefore, conformational changes observed in this pressure range probably correspond to alterations of the active-site structure. Moreover, it is likely
that this pressure-induced intermediate is a molten globule-like state because the loss of activity and capacity to bind ANS are two characteristic properties of a molten globule structure. Previous reports also support the evidence of a molten globule-like state [15].
The high pressures of up to 650 MPa applied showed an additional transition in the fluoresence spectra at pressures higher than <540 MPa (Figs 1 and 2). The question of whether this new transition corresponds to conversion from the molten globule-like state to the completely denatured state or to a second molten globule-like state is addressed. Because this transition is characterized by a marked enhancement of ANS-binding fluorescence, it is likely that this transition leads to the formation of a second molten globule-like state. Thus, at least two intermediates exhibiting molten globule-like structure are sequentially obtained upon pressure-induced denaturation. Such `multiple molten globule-like state transitions' processes have also been reported for other proteins [28,29], however, it differs completely from results reported for the tetrameric carboxypeptidase A and the tetrameric carboxypeptidase from Sulfolobus solfataricus [21,30].
The following plausible denaturation pathway accounting for the data presented above can be given:
N Y N0Y MG
1Y MG2
where N is the native state; N0, the native-like state; MG 1, the
first molten globule-like state; and MG2, the second molten
globule-like state. After the pressure release from highest pressure applied, the conformational changes were only partly reversible. However, the results presented here do not allow one to determine which stage is responsible for irreversibility. Indeed, the reversibility was checked after pressure release from a pressure at which the third transition has already started. Besides, irreversibility may be due to the fact that a pro-region in the pre-matured protein is required for the correct refolding of CPY [31,32], although a possible aggregation of the (partially) unfolded molecule can not be ruled out.
The state N0has a conformation similar to that of the native
state: the environment of the aromatic residues is only slightly more polar and the hydrophobic core is not affected. Thus, N0
can be the equilibrium intermediate counterpart of the most structured folding (kinetic) intermediate.
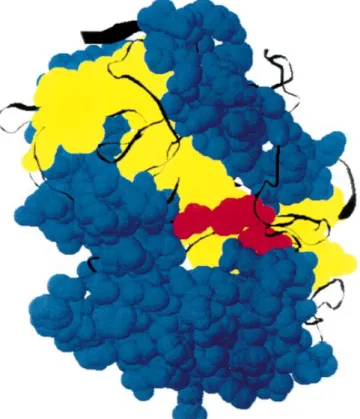
Fig. 5. Space-filling model of CPY showing the two substructural domains of CPY molecule. Based on X-ray crystallographic data of Endrizzi et al. [4]. Helixes are shown in blue, b-sheets in yellow and catalytic triad in red.
Fig. 6. Ribbon diagram of CPY. Based on X-ray crystallographic data of Endrizzi et al. [4] and viewed on a SGI Indigo2-EX computer. Residues of active site are colored blue, and carbohydrate chains red. a-Helixes are shown in purple and b-sheets in yellow. Carbohydrate chain attached to Asn13 is not available from the data base.
N0 is further successively unfolded into MG
1 and MG2 as
pressure increases. Two models can be proposed to explain a two-step transition process.
(a) Each of the transition embraces the whole molecule in two successive partial melting processes. Or in other words, the molten globule-like properties in both MG1and MG2encompass
the entire polypeptide chain: the whole molecule is melted into a first molten globule, which is then melted into a second molten globule state. Such a pathway has been suggested for other proteins [29]. In such cases, the second molten globule state is less compact than the first molten globule state; it still has a partial secondary structure and binds ANS but less than the first molten globule state. Thus, our results do not support this model because MG2binds more ANS than MG1.
(b) Alternately, the two-step pathway can be explained by a sequential unfolding of at least two structural domains. In other words, the protein molecule is assumed to be composed of at least two domains and each of which unfolds independently. According to this model, MG1corresponds to the melting of one
domain into a molten globule-like state, whereas the second domain preserves its native conformation. The MG2corresponds
to the melting of the second domain into a molten globule-like state.
Structural inspection of the tertiary structure of CPY gives evidences consistent with this latter model. Figure 5 shows that the secondary elements of CPY form two clear domains: the central core is formed by b-sheets, whereas helices are on the external part of the molecule. Thus, it is likely that these two structural domains of CPY undergo conformational changes nonsimultaneously, showing that they are indepen-dent and differ in stability against high pressure-induced denaturation. The next question is: which domain unfolds first upon pressurization? We showed that the transition leading to MG1 is concomitant with the loss of activity, thus
with the alteration of the active site. However, because the catalytic triad is located at the interface of the two domains, results presented here do not yet allow one to definitely answer the above question.
Role of the carbohydrate moiety of CPY, in pressure-induced denaturation
In the absence of the carbohydrate moiety, the pressure of the half transition of the center of the spectral mass was lowered by about 50 MPa at 25 8C (Table 1). Although the difference is small, it was consistently observed at all the temperatures investigated. Results of ANS-binding fluorescence (Table 1) and enzyme inactivation (Fig. 3, Table 2) closely parallel the finding of intrinsic tryptophan fluorescence and provide additional evidence that glycosylation enhances the conformational stability of the active site against pressure. Whereas a distinct difference, in pressure stability was found, our results do not explain the molecular basis by which carbohydrate affects CPY properties.
CD spectra in the far UV indicated that the secondary structure of DglyCPY is similar to that of WtCPY [18]. Moreover, unglycosylation does not affect the tertiary structure of CPY (DglyCPY has the same specific activity as WtCPY), this is consistent with the fact that the four glycosylation sites are located on the protein surface, and none is close to the active site of the enzyme [4] (Fig. 6). However, WtCPY was less easily perturbed than DglyCPY. Consequently, although glycosylation has negligible effects, if any, on CPY overall secondary and tertiary structure, it induces local rearrangements, which enhance the stability of the enzyme. The view of local
reorganization in the vicinity of glycosylation sites is supported by results reported for other glycoproteins [33,34].
The lower P1/2may be due to a lower DG0app and/or larger
DVapp (see Eqn 6). From the data in Table 1, the DG 0app
for DglyCPY is generally slightly larger than that for WtCPY. The lower P1/2-values observed for DglyCPY were
therefore due to a markedly larger negative DVapp, and
only the effects of the carbohydrate moiety on the changes in volumes are discussed below, neglecting the changes in DG0app. Changes in the reaction volume on pressurization are
commonly explained in terms of (a) intrinsic contribution and (b) solvent contribution [10].
(a) Effects of the carbohydrate moiety on cavities (intrinsic contribution). The intrinsic contribution is mainly due to reduction of the internal cavities associated with the imperfect packing of amino-acid residues [10]. Because all the carbo-hydrate chains are located on the surface of the protein molecule, we believe that their removal does not form additional internal cavities, which would have, in turn, led to a larger volume decrease under pressure. Although we cannot rule out the possibility that protective effects described below indirectly influence the effect of pressure on the compressibility of normal CPY cavities, we assume that protection arises mainly from different hydration properties (solvent contribution) due to local rearrangements in the vicinity of the glycosylation chains. (b) Effects of carbohydrate moieties on the protein hydration (solvent contribution). Local rearrangements by which a carbohydrate moiety protects CPY may consist in the formation of noncovalent interactions between the carbohydrate moiety and the peptide backbone. These interactions will decrease the protein conformational mobility and thus stabilize the protein. NMR studies performed on a variety of glycoproteins have shown that the carbohydrate moiety forms not only hydrogen bonds but also hydrophobic interactions and van der Waals contacts with the protein moiety [33,35,36]. For example, in the crystal structure of glucose oxidase it was shown that the N-linked mannose residue forms strong hydrogen bonds with the backbone nitrogen and carbonyl oxygen of glutamic acid [35]. Rearrangements in the fucosylated proteinase inhibitor probably originate from hydrophobic interaction between the methyl group of Thr16 and that of fucose, as well as from hydrophobic and hydrogen-bond interactions involving Arg18 and the fuco-sylated Thr9 [33]. A diagram of CPY (Fig. 6) shows that Asn13 is located in a loop, Asn87 at the last residue of an 310-helix,
Asn168 between an a-helix and one residue before a b-sheet, and Asn368 in the middle of a b-sheet. Carbohydrate chains at position 87, 168, and 368 may stabilize, via noncovalent interactions, the secondary structure they are close to. It is important to emphasize that the helix containing Asn87 is located in front of a-helix 404±415, which is connected both to the C-terminal residue and His397, a constitutive amino acid of the catalytic site (Fig. 6). The carbohydrate attached to Asn87 therefore may link these two helices via noncovalent inter-actions thereby stabilizing the active site region. Because hydrogen bonds are stable under pressure, whereas hydrophobic interactions are disrupted [10,37], our results suggest that carbohydrate moiety may enhance CPY stability mainly via the formation of hydrogen bonds between the protein and carbohydrate moieties.
Protection by carbohydrate may also be due to steric hindrance between the sugar and the protein molecule, resulting in reduced solvent accessibility or differential ordering of the water structure around the glycosylation site [38±40]. Again,
this effect might be of special importance around the carbohydrate chain linked to Asn87. This chain may form a bridge, via hydrogen bonding, between the helix containing Asn87 and the facing a-helix 404±415. Such linkage would result in reduced accessibility of water into the crevice (which is shown by the gray arrow in Fig. 6) that separates these two domains of the CPY molecule. The fact that hydration changes associated with the diffusion of water into cavities contribute to the volume decrease observed during protein unfolding [10,37] supports our assumption.
Finally, we stress the efficacy of using this high-pressure technique to show the contribution of the carbohydrate moiety to CPY conformational stability, which is not possible using the usual denaturation studies [18].
ACKNOWLEDGMENTS
We thank N. Bec, Dr J. Connelly, J. L. Saldana and C. Valentin (INSERM U 128) for their expert technical assistance, and are grateful to Prof. A. H. Hooper (University of Minnesota) and Dr E. Mombelli (INSERM U 128) for their critical reading of the manuscript. This work has been partly supported by a grant from the Institut National de la Sante et de la Recherche MeÂdicale and the Japan Society for the Promotion of Science, and a Grant-Aid for Scientific Research from the Ministry of Education, Science, Culture and Sports, Japan.
REFERENCES
1. Hayashi, R. (1976) Carboxypeptidase Y. Methods Enzymol 45, 568±587.
2. Hata, T., Hayashi, R. & Doi, E. (1967) Purification of yeast proteinases. Part III. Isolation and physicochemical properties of yeast proteinase A and C. Agric. Biol. Chem. 31, 357±367.
3. Aribara, S., Hayashi, R. & Hata, T. (1971) Physical and chemical properties of yeast proteinase C. Agric. Biol. Chem. 35, 658±666. 4. Endrizzi, J.A., Breddam, K. & Remington, S.J. (1994) 2.8-AÊ Structure
of yeast serine carboxypeptidase. Biochemistry 33, 11106±11120. 5. Hasilik, A. & Tanner, W. (1978) Biosynthesis of the vacuolar yeast
glycoprotein carboxypeptidase Y. Conversion of precursor into the enzyme. Eur. J. Biochem. 85, 599±608.
6. Hashimoto, C., Cohen, R.E., Zhang, W.-J. & Ballou, C.E. (1981) Carbohydrate chains on yeast carboxypeptidase Y are phosphorylated. Proc. Natl Acad. Sci. USA 78, 2244±2248.
7. Trimble, R.B., Maley, F. & Chu, F.K. (1983) Glycoprotein biosynthesis in yeast. J. Biol. Chem. 258, 2562±2567.
8. Winther, J.R., Stevens, T.H. & Kielland-Brandt, M.C. (1991) Yeast carboxypeptidase Y requires glycosylation for efficient intracellular transport, but not for vacuolar sorting, in vivo stability, or activity. Eur. J. Biochem. 197, 681±689.
9. Chu, F.K. & Maley, F. (1982) Stabilization of the structure and activity of yeast carboxypeptidase Y by its high-mannose oligosaccharide chains. Arch. Biochem. Biophys. 214, 134±139.
10. Mozhaev, V.V., Heremans, K., Frank, J., Masson, P. & Balny, C. (1996) High pressure effects on protein structure and function. Proteins 24, 81±91.
11. Bridgman, P.W. (1912) Water in the liquid and fine solid forms under pressure. Proc. Am. Acad. Arts Sci. 47, 441±558.
12. Hamaguchi, K. (1992) Physico-chemical properties of amino acid side chains. In The Protein Molecule. Conformation, Stability and Folding (Hamaguchi, K., ed), pp. 1±19. Japan Scientific Society Press, Tokyo. 13. Ruan, K., Lange, R., Bec, N. & Balny, C. (1997) A stable partly denatured state of trypsin induced by high hydrostatic pressure. Biochem. Biophys. Res. Commun. 239, 150±154.
14. CleÂry, C., Renault, F. & Masson, P. (1995) Pressure-induced molten globule state of cholinesterase. FEBS Lett. 370, 212±214.
15. Kunugi, S., Yanagi, Y., Kitayaki, M., Tanaka, N. & Uehara-Kunugi, Y. (1997) Effects of high-pressure on the activity and spectroscopic
properties of carboxypeptidase Y. Bull. Chem. Soc. Jpn. 70, 1459± 1463.
16. Hayashi, R., Kinsho, T. & Ueno, H. (1998) Combined application of sub-zero temperature and high pressure on biological materials. In High Pressure Food Science, Bioscience and Chemistry (Isaacs, N.S., ed.), pp. 166±174. Royal Society of Chemistry, England.
17. Jung, G., Ueno, H., Hayashi, R. & Liao, T.-H. (1995) Identification of the catalytic histidine residue participating in the charge-relay system of carboxypeptidase Y. Protein Sci. 4, 2433±2435.
18. Shimizu, H., Ueno, H. & Hayashi, R. (1999) Role of carbohydrate moiety in carboxypeptidase Y: structural study of mutant enzyme lacking carbohydrate moiety. Biosci. Biotechnol. Biochem. in press. 19. Neumann, R.C., Kauzmann, W. & Zipp, A. (1973) Pressure dependence
of weak acid ionization in aqueous buffers. J. Phys. Chem. 77, 2687±26911.
20. Morishita, M., Tanaka, T. & Kawai, S. (1997) High pressure optical cell and its pump for spectrophotometer. In High Pressure Bioscience and Technology (Suzuki, A. & Hayashi, R., eds), pp. 187±194. San-ei Shuppan Co., Kyoto, Japan (in Japanese).
21. Bec, N., Villa, A., Tortora, P., Mozhaev, V.V., Balny, C. & Lange, R. (1996) Enhanced stability of carboxypeptidase from Sulfolobus solfataricus at high pressure. Biotechnol. Lett. 18, 482±488. 22. Lange, R., Frank, J., Saldana, J.-L. & Balny, C. (1996) Fourth derivative
UV-spectroscopy of proteins under high pressure. I. Factors affecting the fourth derivative spectrum of the aromatic amino acids. Eur. Biophys. J. 24, 277±283.
23. Gibson, R.E. & Loeffler, O.H. (1941) Pressure±volume±temperature relations in solutions. V. The energy±volume coefficients of the carbon tetrachloride, water and ethylene glycol. J. Am. Chem. Soc. 63, 898±906.
24. Silva, J.L., Miles, E.V. & Weber, G. (1986) Pressure dissociation and conformational drift of the b-dimer of tryptophan synthase. Biochemistry 25, 5780±5786.
25. Balny, C., Travers, F., Barman, T. & Douzou, P. (1987) Thermo-dynamics of the two-step formation of horseradish peroxidase coumpound I. Eur. Biophys. J. 14, 375±383.
26. Hawley, S.A. (1971) Reversible pressure-temperature denaturation of chymotrypsinogen. Biochemistry 10, 2436±2442.
27. Taniguchi, Y. & Suzuki, K. (1983) Pressure inactivation of a-chymotrypsin. J. Phys. Chem. 87, 5185±5193.
28. Masson, P. & CleÂry, C. (1996) Pressure-induced molten globule states of proteins. In High Pressure Bioscience and Biotechnology (Hayashi, R. & Balny, C., eds), pp. 114±126. Elsevier Science B.V., the Netherlands.
29. Ptitsyn, O.B. (1995) Molten globule and protein folding. Adv. Prot. Chem. 47, 83±229.
30. Mombelli, E., Bec, N., Tortora, P., Balny, C. & Lange, R. (1996) Pressure and temperature control of a thermophilic carboxypeptidase from Sulfolobus solfataricus. Food Biotech. 10, 131±142.
31. Winther, J.R. & Sùrensen, P. (1991) Propeptide of carboxypeptidase Y provides a chaperone-like function as well as inhibition of the enzyme activity. Proc. Natl Acad. Sci. USA 88, 9330±9334.
32. Sùrensen, P., Winther, J.R., Kaarsholm, N.C. & Poulsen, F.M. (1993) The pro region required for folding of carboxypeptidase Y is a partially folded domain with little regular structural core. Biochemistry 32, 12160±12166.
33. Mer, G., Hietter, H. & LefeÁvre, J.-F. (1996) Stabilization of protein by glycosylation examined by NMR analysis of a fucosylated proteinase inhibitor. Nat. Struct. Biol. 3, 45±53.
34. Wang, F.-F.C. & Hirs, C.H.W. (1977) Influence of the heterosaccharides in porcine pancreatic ribonuclease on the conformation and stability of the protein. J. Biol. Chem. 23, 8358±8364.
35. Hetch, H.J., Kaliz, H.M., Hendle, J., Schmid, R.D. & Schomburg, D. (1993) Crystal structure of glucose oxidase from Aspergilus niger refined at 2.3 AÊ resolution. J. Mol. Biol. 229, 153±172.
36. Dwek, R.A. (1995) Glycobiology: more function for oligosaccharides. Science 269, 1234±1235.
and Biotechnology (Balny, C., Hayashi, R., Heremans, K. & Masson, P., eds), Vol. 224, pp. 89±99. John Libbey Eurotext, France. 38. Joao, H.C. & Dwek, R.A. (1993) Effects of glycosylation on protein
structure and dynamics in ribonuclease B and some of its individual glycoforms. Eur. J. Biochem. 218, 239±244.
39. Rudd, P.M., Joao, H.C., Coghill, E., Fiten, P., Saunders, M.R.,
Opedenakker, G. & Dwek, R.A. (1994) Glycoforms modify the dynamic stability and functional activity of an enzyme. Biochemistry 33, 17±22.
40. Tams, J.W. & Welinder, K.G. (1998) Glycosylation and thermodynamic versus kinetic stability of horseradish peroxydase. FEBS Lett. 421, 234±236.