HAL Id: hal-00174455
https://hal.archives-ouvertes.fr/hal-00174455
Submitted on 24 Sep 2007HAL is a multi-disciplinary open access
archive for the deposit and dissemination of sci-entific research documents, whether they are pub-lished or not. The documents may come from teaching and research institutions in France or abroad, or from public or private research centers.
L’archive ouverte pluridisciplinaire HAL, est destinée au dépôt et à la diffusion de documents scientifiques de niveau recherche, publiés ou non, émanant des établissements d’enseignement et de recherche français ou étrangers, des laboratoires publics ou privés.
Crystallization of carbon tetrachloride in confined
geometries
Adil Meziane, Jean-Pierre Grolier, Jean-Marie Nedelec, Mohamed Baba
To cite this version:
Adil Meziane, Jean-Pierre Grolier, Jean-Marie Nedelec, Mohamed Baba. Crystallization of carbon tetrachloride in confined geometries. Faraday Discussions, Royal Society of Chemistry, 2007, 136, pp.370-381. �10.1039/b616128f�. �hal-00174455�
Crystallization of carbon tetrachloride in
confined geometries
Adil Meziane
1, Jean-Pierre E. Grolier
2, Mohamed Baba
2and
Jean-Marie Nedelec
3*1
Laboratoire de Photochimie Moléculaire et Macromoléculaire, UMR CNRS
6005
2
Laboratoire de Thermodynamique des Solutions et des Polymères,
UMR CNRS 6003
3
Laboratoire des Matériaux Inorganiques, UMR CNRS 6002
TransChiMiC
Ecole Nationale Supérieure de Chimie de Clermont Ferrand
& Université Blaise Pascal,
24 Avenue des landais 63177 Aubière Cedex, FRANCE.
* Corresponding author : E-mail j-marie.nedelec@univ-bpclermont.fr Phone 00 33 (0)4 73 40 71 95 Fax 00 33 (0)4 73 40 71 08
Abstract
The thermal behaviour of carbon tetrachloride confined in silica gels of different porosity was
studied by differential Scanning Calorimetry. Both the melting and the phase transition at low
temperature were measured and found to be inextricably dependant upon the degree of
confinement. The amount of solvent was varied through two sets of experiments, sequential
addition and original progressive evaporation allowing the measurement of the DSC signals
for the various transitions as a function of the amount of CCl4. These experiments allowed the
determination of transition enthalpies in the confined state which in turn allowed the
determination of the exact quantities of solvent undergoing the transitions. A clear correlation
was found between the amounts of solvent undergoing the two transitions (both free and
confined) demonstrating that the formation of the adsorbed layer t does not interfere with the
second transition. The thickness of this layer and the porous volumes of the two silica samples
were measured and found to be in very close agreement with the values determined by gas
sorption.
1. Introduction
The peculiar behaviour of liquids in confined geometry has attracted a lot of interest in
particular during the past ten years. A comprehensive review has been published in 2001 [1].
The case of water [2,3] is particularly relevant because of the numerous works dealing with
water and also because of obvious practical applications. The revival in the interest in
transitions in confined geometry undoubtedly comes from the considerable progress in the
preparation of nanoporous materials with controlled pore size and with spatially controlled
pore distribution and connectivity. In this context discovery of MCM type materials [4] has
played an important role. The use of organized molecular systems (surfactants) to limit
spatially the condensation of alkoxide precursors is now common and has been extended to
various systems and various pore organizations. The availability of such porous materials
with controlled porosity, and to some extent with tuneable porosity, has lead to an increased
interest for the study of crystallisation in confined geometry. Practical interest of liquids in
porous materials is also very widespread and the case of oil recovery is a major example. The
chemistry of water in clouds is also greatly affected by confinement effects.
More importantly, the research devoted to the preparation of nanocrystals with a good control
of both crystal size and size distribution has been incredibly expanding in the last twenty
years [5]. In particular semi-conducting nanocrystals or quantum dots have been the subject of
many research papers [6,7] due to the possible observation in these materials of a direct
quantum effect correlated to the size of the crystals.
Porous materials appeared to be ideal candidates for the preparation of such nanocrystals,
utilizing the pores as nanoreactors where the crystallization of the desired material could be
confined. In particular abundant examples concerning MCM-41 and SBA-15 mesoporous
silicas templates can be found in the literature, see [8,9] for instance. Another very interesting
Biomineralization is a complex process in which the solution conditions, organic template,
and crystal confinement coordinate to yield nanostructured composite materials with
controlled morphology and mechanical and structural properties. Over the past few decades,
research has examined various aspects of this mineralization process both by characterizing
those found in nature and by creating synthetic composites.
Another field in which crystallization in confined geometries play a major role is polymer
science. Numerous examples demonstrate how the confinement can modify the kinetics of
crystallization of polymers and also the morphology of the crystals [12].
All these selected examples demonstrate how crucial it is to get information concerning
crystallization in confined geometries. In particular the energetic of crystallization in
confining media is not well documented.
The well known modification of the freezing point temperature of liquids in confined
geometry has led to the development of characterization techniques for the measurement of
porosity in solids. Such techniques are based upon the Gibbs-Thomson equation [13,14]
which relates the shift ∆T of the crystallization temperature to the pore size of the confining material according to [15]: p m p s m SL p R H k R H T Cos T T T ∆ ≈ ∆ = − = ∆ ρ θ σ 0 0 . 2 (Equation 1)
where Tp is the melting temperature of a liquid confined in a pore of radius Rp, T0 is the
normal melting temperature of the liquid, σSL is the surface energy of the solid/liquid
interface, θ the contact angle, ∆Hm is the melting enthalphy, ρS the density of the solid and k a
constant.
The measurement of ∆T by calorimetry or NMR technique leads to thermoporosimetry [16] and NMR cryoporometry [17] respectively. The advantages of both techniques have been
As first proposed by Kuhn [19] in the 1950’s, thermoporosimetry can also be of great value
for soft networks characterization like polymeric gels [20]. In this case, the confinement is
created by the meshes defining the 3-dimensional polymer network. The study of polymer
architecture modification by thermoporosimetry requires knowledge of the behaviour of
liquids able to swell these organic materials. We recently developed reference porous
materials for calibration of thermoporosimetry with various solvents [21,22]. In our
systematic work, we observed that some solvents presenting a low temperature phase
transition in the solid state offered even more interest [23]. Indeed, this transition is also
affected by the confinement and is an interesting alternative to the use of liquid to solid
transition since it is usually much more energetic. From a practical point of view the use of
these transitions does not change the procedure requiring the calibration of the technique with
samples of known porosity. But from a fundamental point of view, this observation raises
some questions about the underlying thermodynamics. The objective of this paper is to
discuss the transitions of carbon tetrachloride in confined geometry because CCl4 is an
effective solvent for polymer swelling and also presents this solid state phase transition as
observed before. [24,25].
2 Theoretical considerations
According to Equation (1), the shift of the transition temperature of a confined liquid ∆T is inversely proportional to the radius of the pore in which it is confined. In fact it is well known
that not all the solvent takes part in the transition and that a significant part of it remains
adsorbed on the surface of the pore. The state of this adsorbed layer has been discussed
extensively in the case of water. Consequently, the radius measured by application of the
Gibbs-Thomson equation should be written R=Rp-t where t is the thickness of the adsorbed
t T H k R m p + ∆ ∆ = (Equation 2)
The value of t can be determined by the calibration procedure using materials of various pore
sizes and this is the traditionally adopted procedure. The problem in doing so is that the
underlying hypothesis is that the thickness of the adsorbed layer t does not vary with pore
size. For small pores, the error on t can lead to large errors on the measurement of Rp.
We proposed an alternative method to measure t by adding sequentially various amounts of
liquid in the porous material [26]. As stated before this layer t represents the part of the
solvent which does not crystallize. For solvents like CCl4 which exhibit a further transition at
low temperature the behaviour of this adsorbed layer is an open question. Does this solvent
participate in the second transition? Is a new adsorbed layer created on the top of the first
one? To get further insight into these questions we studied the behaviour of CCl4 in
mesoporous silica gels in this paper as described in the following section.
3. Experimental section
3.1 Mesoporous silica gels
Mesoporous monolithic silica gels (2.5 mm × 5.6 mm diameter cylinders) were prepared by the acid catalysed hydrolysis and condensation of a silicon alkoxide, following procedures
reviewed elsewhere [27]. Careful control of the aging time performed at 900°C allowed the
production of samples with controlled textural properties. In this study two samples (A and B)
with different textural properties (Specific Surface Area (SSA), total pore volume (Vp) and
pore size distribution (PSD)) were used. The textural characteristics of the samples were
determined by N2 sorption.
3.2 Gas sorption measurements
Textural data of the silica gels were determined on a Quantachrome Autosorb 1 apparatus.
method at 77.4 K. The adsorptive gas was nitrogen with a purity of 99.999%. The cross
sectional area of the adsorbate was taken to be 0.162 nm2 for SSA calculations purposes. Prior
to N2 sorption, all samples were degassed at 100°C for 12 h under reduced pressure. The
masses of the degassed samples were used in order to estimate the SSA. The BET [28] SSA
was determined by taking at least 4 points in the 0.05<P/P0<0.3 relative pressure range. The
pore volume was obtained from the amount of nitrogen adsorbed on the samples up to a
partial pressure taken in the range 0.994<P/P0<0.999. Pore size distributions were calculated
from the desorption isotherm by the BJH method [29]. The mean pore radius Rav was
calculated according to BET p av S V R = 2 (Equation 3)
corresponding to a cylindrical shape for the pores which is also the underlying hypothesis in
equation (1).
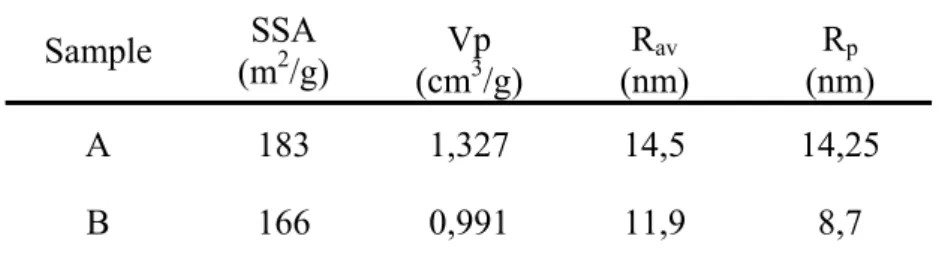
Textural data for the two samples are displayed in Table 1. In this table, the modal pore
diameter Rp is also shown. This value fairly matches the Rav derived from SBET measurement
with cylindrical shape assumption thus confirming the validity of the hypothesis on the pore
shape.
Sample SSA
(m2/g) (cmVp 3/g) (nm) Rav (nm) Rp
A 183 1,327 14,5 14,25
B 166 0,991 11,9 8,7
2.3 DSC measurements
A Mettler-Toledo DSC821 instrument calibrated (both for temperature and enthalpy) with
metallic standards (In, Pb, Zn) and with n-heptane was used to record the thermal curves. It
was equipped with an intracooler set allowing a scanning range of temperature between -70
and 600 °C. About 10 or 20 mg of the studied material was introduced into an aluminium
DSC pan to undergo an appropriate temperature program. To allow the system to be in an
equilibrium state, a slow freezing rate is required [30]. A rate of -0.7 °C/min was chosen.
Other slower cooling rates were tested which did not show any significant discrepancy. CCl4
(Aldrich) of HPLC quality was used without any supplementary purification.
3. Results and discussion
3.1 Thermal behavior of free CCl4
Bulk CCl4 was studied before and its thermal phase transitions were well characterized
-60
-50
-40
-30
-20
-10
-15
-10
-5
0
5
10
15
20
25
30
35
-47.6 °C -22.6 °C(R)
(M)
(Liquid)
(Liquid)
(Liquid)
(M)
(M)
(R)
(R)
(FCC)
(FCC)
Heat Flow
(mW
.g
-1)
T (°C)
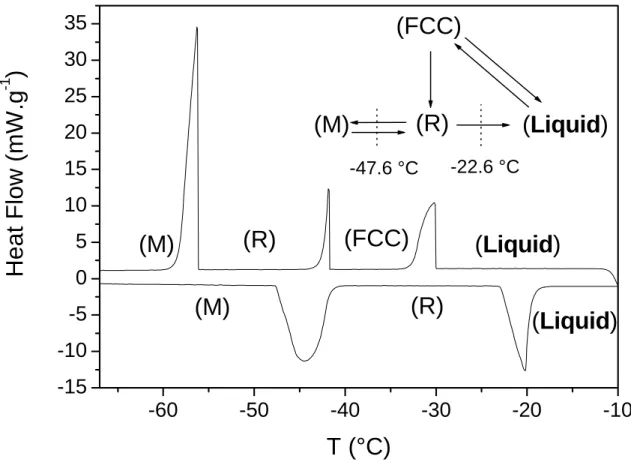
Figure 1: DSC thermogram of pure CCl4 showing the different transitions.
As it is cooled down, liquid CCl4 crystallizes into Face-Centered-Cubic phase (FCC) which
follows a phase transition upon further cooling to a Rhombohedral one (R) which, in turn,
transforms to Monoclinic crystalline structure (M) around -48°C. Heating the (M) phase leads
to (R) in a reversible way but upon heating (R) melts directly without transforming into the
(FCC) phase. Observing the transition heat values (Figure 1), it can be pointed out that the R
to-liquid transition releases an enthalpy (13.6 J/g) equivalent to the total heat liberated by the
liquid-to-FCC (9.6 J/g) together with the FCC-to-R (3.8 J/g). Takei et al. [24] showed that
both solid-to-solid and liquid-to-solid transitions of CCl4 were strongly dependent on the
demonstrated that the FCC-to-R transition is no longer observed when the pore radius is
smaller than 16.5 nm, which is the case for our silica samples (see Table 1).
Because of the complex behaviour of CCl4 upon cooling, we chose to use the heating of the
solvent to limit the study to the M-to-R and R-to liquid transitions.
The two transitions were studied for CCl4 confined in the two porous samples A and B.
3.2 Thermal behaviour of CCl4 confined in sample A
The objective is to get quantitative information on the solvent undergoing both transitions
(both confined and free solvent). In order to do so, we performed sequential addition of
precise quantities of CCl4 in the sample as described in [26]. Briefly, a known mass of silica
gel (about 20 mg) is set in the DSC pan which is sealed. A small hole is drilled in the cover
allowing further injection of known masses of carbon tetrachloride. This procedure allows a
precise control of the added mass of solvent. After each thermal cycle, a new injection is
performed.
For the first time to our knowledge, we also performed some experiments in the reverse way,
by progressively evaporating the solvent starting from a large excess. This was performed by
inert gas flushing in the DSC pan at 25 °C. The subsequent evaporation of the solvent is
controlled by the flushing time. Obviously in this case we do not know the remaining mass of
CCl4, but we can calculate it from the measured enthalpies.
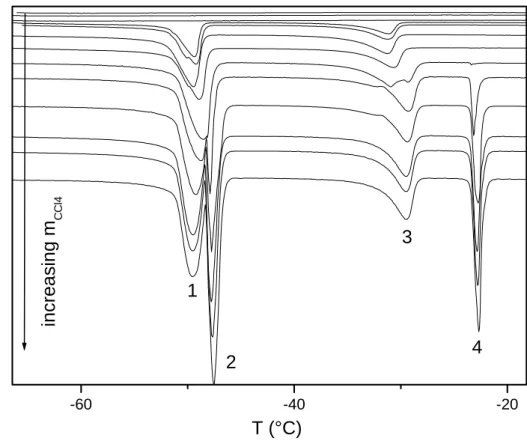
The thermograms recorded for various quantities of CCl4 added to sample A are shown in
Figure 2. In this figure, 4 peaks can be observed which are labelled from 1 to 4 starting from
low temperature to room temperature. The assignment of all peaks is presented in Table 2.
Peak 1 Peak 2 Peak 3 Peak 4
M Æ R confined solvent M Æ R free solvent Melting of R Confined solvent Melting of R free solvent
Table 2: Labelling of the different peaks observed in the DSC curves.
Figure 3 presents the DSC curves recorded upon desorbing the CCl4 by gas flushing. As can
be seen in the figure, the control of the flushing time allows a slow evaporate of the liquid and
a discrimination of all the steps. What is interesting in this experiment is that the whole set of
experiments can be programmed automatically thus giving a considerable amount of
experimental data. -60 -40 -20 2 3 4 1 in crea sin g m CC l4 H e at Fl ow ( a .u .) T (°C)
-60 -40 -20 2 4 3 1 In creasing F lushing tim e Heat F low (a. u.) T (°C)
Figure 3: Thermograms recorded for various flushing times for sample A filled with CCl4.
In Figure 2, it can be seen that for small quantities of added CCl4, no transition is observed.
This first step corresponds to the creation of the adsorbed layer t onto the surface of the
porous silica gel. For higher amounts of CCl4, peak 3 appears at a temperature shifted with
respect to the normal melting temperature of solid CCl4. At about the same time, peak 1 also
appears corresponding to the M-to-R transition for the confined solvent. The intensities of
these two peaks increase upon further addition of solvent until they remain constant
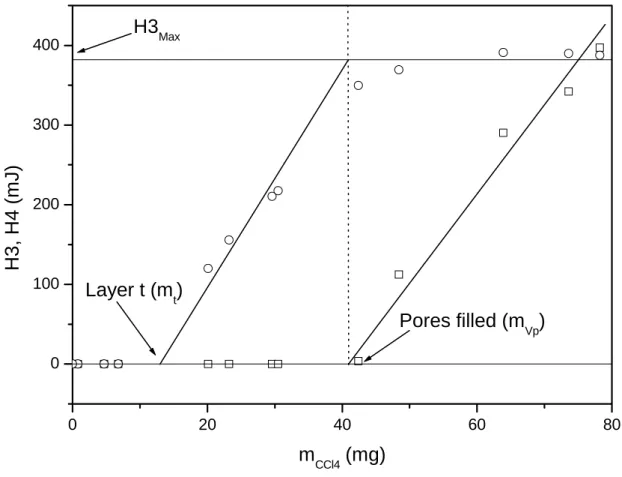
coinciding with the appearance of peaks 2 and 4 corresponding to excess free solvent. A plot
of the heats corresponding to peaks 3 and 4 (H3 and H4) as a function of the mass of CCl4
added (mCCl4) is presented in Figure 4. The different steps are clearly observable. The point
allowing the determination of the quantity of solvent (mt) participating in the formation of this
layer. At a given point, H3 remains constant and this point corresponds to the total filling of
the pores (H3Max) thus allowing the determination of the porous volume of the sample (see
section 3.4). 0 20 40 60 80 0 100 200 300 400 Pores filled (mVp) Layer t (m t) H3Max H3, H4 (m J) mCCl4 (mg)
Figure 4: Evolution of H3 (circles) and H4 (squares) as a function of the mass of CCl4
added in sample A.
To measure the amounts of CCl4 involved in each transition precisely, we need to know the
transition enthalpy at the given temperature. These values are known for free solvent
transiting at regular temperatures but not for confined solvent which undergoes transitions at
filled in the constant part of the curve. In this case the enthalpy corresponds to a mass of
solvent equal to the total mass added (mvp) minus the mass required for the creation of the
adsorbed layer (mt) namely m=mvp-mt. We can then deduce the enthalpy of melting per gram
for the confined solvent ∆H3 = 13.67 J.g-1.
For the M-to-R transition, the situation is different. Because of the overlapping of peaks 1
and 2 we can only use the sum H1+H2. If we plot the evolution of H3 and H4 as a function of
(H1+H2) we obtained the curves presented in Figure 5.
0 500 1000 1500 2000 0 50 100 150 200 250 300 350 400 450 500 550 600 650 700 H3Max H1Max H3, H4 (m J ) (H1+H2) (mJ)
Figure 5: Evolution of H3 (circles) and H4 (squares) for progressive filling (full symbols) and
It is worth noting that the points corresponding to desorption experiments complete nicely the
points corresponding to sequential addition of solvent (empty and full symbols respectively).
The point where H4 differs from zero corresponds to the H1Max value corresponding to the
totality of solvent undergoing the transition (in this case H2=0). The enthalpy of transition
∆H1 can then be deduced ∆H1= 27.22 J.g-1. Knowing ∆H1 and ∆H3, we can now calculate
the masses of solvent which undergo the various transitions for all points. Figure 6 presents
the correlation between these masses M3 and M1 (the indexes correspond to the different
peaks). 0 2 4 6 8 10 12 14 16 18 20 22 24 26 28 30 0 2 4 6 8 10 12 14 16 18 20 22 24 26 28 30 M3 ( m g ) M1 (mg)
Figure 6: Evolution of the mass of confined solvent undergoing transition M-to-R (M1) as a
function of the mass of confined solvent undergoing the R-to-liquid transition (M3).
A clear correlation is observed between the confined solvent which undergoes the R-t-
liquid and the M-to-R transitions. This correlation is observed both for addition and
evaporation experiments. This clearly confirms that all solvent undergoing the first transition
also undergoes the second one.
This observation is further confirmed by the plot of Figure 7 showing the correlation
between M2 and M4, the masses of free solvent which undergo the transitions 2 and 4. M2 is
determined through the following equation:
(
)
2 1 2 1 2 H H H H M Max ∆ − + = Equation (4)where H1Max is the enthalpy required for the M-to-R transition of the liquid totally filling the
pores (see Figure 5) and ∆H2=46.6 J.g-1 the specific enthalpy for the M-to-R transition of free
CCl4. 0 5 10 15 20 25 30 0 5 10 15 20 25 30 M4 ( m g ) M2 (mg)
Figure 7: Correlation between the masses of free solvent undergoing the R-to-liquid (M2)
and the M-to-R transitions (M4). Progressive filling (■) and desorption (□) experiments. The
y=x line is also plotted.
Once again a clear correlation is observed between the two quantities confirming that all the
solvent which has crystallised outside the pores undergoes the second transition at a regular
temperature (no confinement). These conclusions also demonstrate that the layer t remains
adsorbed and does not participate in the low temperature transition.
3.3 Thermal behaviour of CCl4 confined in sample B
The same experiments and calculations were applied to sample B which presents smaller
pores i.e. higher confinement.
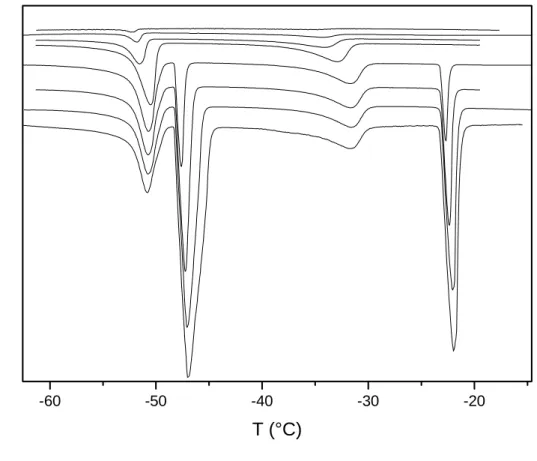
The thermograms recorded for sample B filled with CCl4 upon progressive evaporation are
displayed in Figure 8. Because of the higher degree of confinement, the two peaks 1 and 2 are
-60 -50 -40 -30 -20 H e at Fl ow (a.u.) T (°C)
Figure 8: Thermograms recorded for various flushing times for sample B filled with CCl4.
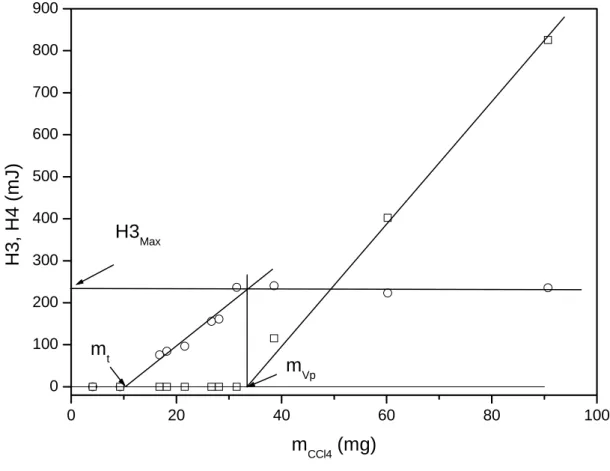
Following the same procedure, we can plot the evolution of H3 and H4 as a function of
0 20 40 60 80 100 0 100 200 300 400 500 600 700 800 900 mt mVp H3 Max H3 , H 4 ( m J) mCCl4 (mg)
Figure 9: Evolution of H3 (circles) and H4 (squares) as a function of the mass of CCl4
added in sample B.
The plot of H1 and H2 as a function of mCCl4 (not shown here) can also be performed.
From these curves, ∆H1 and ∆H3 for sample B can be derived (∆H1=22.19 J.g-1 and
∆H3=10.13 J.g-1). Together with the known values of ∆H2 (46.6 J.g-1) and ∆H4 (25.07 J.g-1)
they allow the calculation of the quantities of solvent which undergo the different transitions
0 5 10 15 20 25 0 5 10 15 20 25 0 10 20 30 40 50 60 70 80 0 10 20 30 40 50 60 70 80
(b)
M3
, M4
(
m
g
)
M1, M2 (mg)
(a)
Figure 10: Correlation between M3 and M1 (circles) and M2 and M4 (squares) for
The quantities M1, M2 M3 and M4 are plotted in Figure 10 both for progressive filling and
evaporation experiments. A clear correlation between M3 and M1 on the one hand and
between M4 and M2 on the other hand is observed confirming the conclusions drawn from
the study of sample A. Scheme 1 depicts the global behaviour of CCl4 inside the porous silica
recapitulating the different steps and the main conclusions of this work.
m increases T decreases t R M Liquid Pore m increases T decreases t R M Liquid Pore
Scheme 1: Global behaviour of confined CCl4 in porous materials, R is the Rhombohedral
phase, M the monoclinic one, t the adsorbed layer.
3.4 Calculation of porous volumes and thicknesses of adsorbed layers
Considering the curves of Figure 4 and 9, we can measure the mass of solvent
2 . siO v p m m V p ρ = Equation (5)
ρ being the density of CCl4. We took the value at -20°C ( ρ=10.85 kmol.m-3) [31].
From the same figures, we can also measure the mass of the adsorbed layer mt, the
thickness of this layer can be calculated according to:
2 . . SiO t m SSA m t ρ = Equation (6)
SSA being the specific surface area of the silica sample given in Table 1.
The results are summarized in Table 3.
Sample Vp (cm3.g-1) VN2 (cm3.g-1) t (nm)
A 1.35 1.327 2.3
B 0.99 0.991 1.9
The calculated value of Vp are in very good agreement with the value measured by nitrogen
sorption, the error is less than 2%. The values of t determined for samples A and B are also in
good agreement with average value given in [25] after calibration procedure with samples of
various pore size.
All calculations were performed with a constant value of ρCCl4 measured at -20°C.
Obviously no information can be found in the literature for densities of carbon tetrachloride at
lower temperatures since it is usually solid at these temperatures. Nevertheless using the value
at -20°C, the error must be small. Furthermore, with the validity of such an approach
demonstrated, we can now consider the exact porous volume to calculate the exact density of
4 Conclusions
The thermal behavior of carbon tetrachloride confined in two mesoporous silica gels of
different porosity was studied. The two transitions (solid to liquid and Monoclinic to
Rhombohedral) were measured and are affected by the confinement. The enthalpies of these
two transitions were determined for the first time at the temperatures corresponding to
confined solvent. Using these enthalpies, a clear correlation has been shown between the
solvent undergoing the first and the second transitions. Consequently, the adsorbed layer
which is created during the intrusion of CCl4 inside the porosity of the silica gels is kept
constant and does not participate in the two transitions. The thickness of this layer was
measured for both samples and is found to be slightly dependant on the pore radius. Finally
the porous volumes of the silica gels have been measured and the values agree very closely
with those derived from nitrogen sorption isotherm. It has been demonstrated that using
porous samples of known porosity (measured by mercury intrusion porosimetry or gas
sorption analysis) could allow the measurement of thermodynamical data of confined liquids
(Enthalpy of transition, density,….).
Acknowledgements
Financial support from the French ANR under project Nanothermomécanique (ACI
Nanosciences N°108) is gratefully acknowledged. The authors would like to thank A. Gordon
Contact author for correspondence and return of proofs:
Dr Jean-Marie Nedelec
TransChiMiC, Laboratoire des Matériaux Inorganiques (CNRS UMR 6002)
Université Blaise Pascal, 24 Avenue des Landais, 63177 Aubière, FRANCE
Tel : 00 33 4 73 40 71 95
Fax 00 33 4 73 40 71 08
References
[1] H.K. Christenson, J. Phys.: Condens. Matter,13, 95, (2001)
[2] J. Dore, Chem. Phys., 258, 327, (2000).
[3] B. Webber and J. Dore, J. Phys. Condens. Matter, 16, 5449, (2004).
[4] C.T. Kresge, M.E. Leonowicz, W.J. Roth, J.C. Vartuli, J.S. Beck, Nature., 359, 710, (1992)
[5] M.P. Pileni, J. Phys. Chem. B, 105 (17), 3358, (2001).
[6] C.B.Murray, C.R. Kagan, M.G.Bawendi, Ann. Rev. Mat. Sci., 30, 545, (2000).
[7] B. Capoen, T. Gacoin, J.M. Nedelec, S. Turrell, M. Bouazaoui, J. Mat. Sci., 36(10), 2565, (2001).
[8] F. Gao, Q.Y. Lu, X.Y. Liu, Y.S. Yan and D.Y. Zhao, Nano Letters, 1 (12), 743, (2001)
[9] J. Kim, J.E. Lee, J. Lee, J.H. Yu, B.C. Kim, K. An, Y. Hwang, C.H. Shin, J.G. Park, J. Kim, T. Hyeon, J. Am. Chem. Soc., 128 (3), 688, (2006).
[10] S. Mann, Nature, 365(6446), 499, (1993).
[11] A.P. Alivisatos, Science, 289 (5480), 736, (2000).
[12] X.N. Yang, A. Alexeev, M.A.J. Michels, J. Loos, Macromolecules, 38 (10), 4289, (2005).
[13] J. Gibbs, Collected works, New Haven, CT : Yale University Press, (1928).
[14] S.W. Thomson, Phil. Mag., 42, 448, (1871).
[15] C.L. Jackson and G.B. Mc Kenna, J. Chem. Phys., 93(12), 9002, (1990).
[16] M. Brun, A. Lallemand, J-F. Quinson and C. Eyraud. Thermochim. Acta, 21, 59, (1977). [17] J. Strange, M. Rahman and E. Smith, Phys. Rev. Lett., 71(21), 3589, (1993).
[18] J.M. Nedelec, J.P.E. Grolier and M. Baba, J. Sol-Gel Sci. Techn., 40, 191, (2006). [19] W. Kunh, E. Peterli and H. Majer, J. Polymer Sci., 16, 539, (1955).
[20] M. Baba, J.M. Nedelec, J. Lacoste, J.L. Gardette, M. Morel, Polym. Degrad. Stabil.,
80(2), 305, (2003).
[21] N. Billamboz, M. Baba, M. Grivet and J.M. Nedelec, J. Phys. Chem. B, 108, 12032, (2004).
[23] M. Baba, J.M. Nedelec, J. Lacoste and J.L. Gardette, J. Non-Cryst. Solids, 315, 228, (2003).
[24] T. Takei, Y. Ooda, M. Fuji, T. Watanabe, M. Chikazawa, Thermochim. Acta, 352-353, 199, (2000).
[25] B. Husár, S. Commereuc, L. Lukáč, S. Chmela, J.M. Nedelec and M. Baba, J. Phys. Chem. B, 110, 5315, (2006).
[26] M. Baba, J.M. Nedelec and J. Lacoste, J. Phys. Chem. B, 107, 12884, (2003).
[27] L.L. Hench, in Sol-gel silica : processing, properties and technology transfer, Noyes Publications, New York, (1998).
[28] S. Brunauer, P.H. Emmet and E. Teller, J. Am. Chem. Soc., 60, 309, (1938).
[29] E.P. Barret, L.G. Joiner and P.P. Halenda, J. Am. Chem. Soc., 73, 373, (1951).
[30] R. Landry, Thermochim. Acta, 433(1-2), 27, (2005).