HAL Id: hal-03053577
https://hal-enpc.archives-ouvertes.fr/hal-03053577
Submitted on 11 Dec 2020HAL is a multi-disciplinary open access archive for the deposit and dissemination of sci-entific research documents, whether they are pub-lished or not. The documents may come from teaching and research institutions in France or abroad, or from public or private research centers.
L’archive ouverte pluridisciplinaire HAL, est destinée au dépôt et à la diffusion de documents scientifiques de niveau recherche, publiés ou non, émanant des établissements d’enseignement et de recherche français ou étrangers, des laboratoires publics ou privés.
An experimental investigation on methane hydrate
morphologies and pore habits in sandy sediment using
synchrotron X-ray computed tomography
Thi Xiu Le, Michel Bornert, Patrick Aimedieu, Baptiste Chabot, Andrew
King, Anh Minh Tang
To cite this version:
Thi Xiu Le, Michel Bornert, Patrick Aimedieu, Baptiste Chabot, Andrew King, et al.. An experi-mental investigation on methane hydrate morphologies and pore habits in sandy sediment using syn-chrotron X-ray computed tomography. Marine and Petroleum Geology, Elsevier, 2020, 122, pp.104646. �10.1016/j.marpetgeo.2020.104646�. �hal-03053577�
An experimental investigation on methane hydrate
morphologies and pore habits in sandy sediment using
synchrotron X-ray computed tomography
Thi-Xiu Le1, Michel Bornert1, Patrick Aimedieu1, Baptiste Chabot1, Andrew King2, Anh-Minh Tang1*
1
Ecole des Ponts ParisTech, France 2
Synchrotron SOLEIL, France
*Corresponding author: anh-minh.tang@enpc.fr (A.M. Tang).
Abstract
As pore-scale morphologies and spatial distribution (pore habits) of natural gas hydrates in marine sediments considerably affect their physical/mechanical properties, they have extensively been investigated by X-ray computed tomography (XRCT) and especially synchrotron X-Ray computed tomography (SXRCT). While both image spatial and scan temporal resolutions are being improved over time, it is still challenging to distinguish water from methane hydrate in an image due to their low absorption contrast. In this study, methane hydrate formation and growth in wet sand were observed at submicron/micron scale using SXRCT. Saline water (Potassium iodide - KI) was used in order to improve the image contrast. Evolutions of methane hydrate morphologies and distribution at both the pore and sample scales were observed. Results are discussed based on various mechanisms related to material behaviors and experimental conditions, e.g. suction variation during methane hydrate formation, local temperature gradient in the sample, and particularly the interaction of X-rays with the sample. Methane hydrate formation is interpreted as a dynamic process, favoring the Ostwald ripening. Furthermore, morphologies and
pore habits of methane hydrates under excess-gas and excess-water conditions are discussed. Some recommendations are finally given for further studies on methane hydrates-bearing sediments via XRCT or SXRCT.
Keywords: methane hydrate; sandy sediments; morphology; pore habits; synchrotron X-ray computed tomography.
1. Introduction
Natural gas hydrates (mainly methane hydrates - MH), ice-like compounds of methane gas and water, are most often located in marine and permafrost settings (Collett et al., 2009). They represent a great potential energy resource but also a source of greenhouse gas and geo-hazards (Boswell and Collett, 2011). Different MH appearances, e.g. nodules/chunks, lenses/veins have been identified in fine-grained sediments (Dai et al., 2012; Lei and Santamarina, 2018). Yet, for sandy sediments, MH were found in non-displacive pore habit and at high hydrate saturation, i.e. with a so-called “pore-filling” distribution as defined later (Masui et al., 2008; Dai et al., 2012; Konno et al., 2015). Because of technical feasibility limits, only methane hydrate-bearing sands (MHBS) are the actual target for potential methane gas exploration (Collett et al., 2009; Boswell and Collett, 2011; Le et al., 2018). The formation of MH in sandy sediments modifies the microstructure and as a result the physical/mechanical properties of MHBS. Therefore, the study of the microstructure of MHBS is essential for the interpretations of geophysical data and reservoir-scale simulations in the scope of methane gas production (Gabitto and Tsouris, 2010).
While recent technical developments permit to extract intact methane hydrate-bearing cores from natural settings, preserving their in situ pressure-temperature
conditions, and to efficiently extrude such samples into triaxial cells for mechanical characterization (Priest et al., 2015; Yamamoto, 2015; Yoneda et al., 2015 & 2017), these procedures are still highly challenging and improvements are still needed to increase the proportion of successful sample extractions. That explains why most of the existing experimental works focus on synthetic samples produced in the laboratory. Various methods have been proposed to form methane hydrates in sandy sediments in the laboratory. Comparisons between seismic velocities measured on real samples and those calculated via conceptual models have been used to indirectly assess the MH pore habits in sandy sediments (Dvorkin & Nur, 1996&1998; Helgerud et al., 1999; Dvorkin et al., 2000). Four idealized arrangements of MH at the pore scale in sediment, referred to as “pore habits”, have been considered: “grain-grain contact cementing”, “mineral coating cementing”, “load-bearing” and “pore-filling” (Dvorkin et al., 2000). MH were supposed to be located at the contacts of sand grains (grain-grain contact cementing) when the excess-gas or the ice-seeding methods are used to produce them (Waite et al., 2004; Priest et al., 2005). Load-bearing MH were inferred in sandy sediments when the excess-water method was adopted (Priest et al., 2009). Finally, MH initially formed following the excess-gas method (with grain-grain contact cementing morphology), were supposed to be redistributed within the pore space between sand grains (i.e. “pore-filling” morphology) when excess methane gas was replaced by water. This method is referred to as “water saturation”, and can be done with or without an additional temperature cycle (Choi et al., 2014; Le et al., 2019).
As MH morphologies and pore habits considerably affect physical/mechanical behaviors of MHBS (Waite et al., 2009; Lei et al., 2019a), their direct observation at
pore scale is of major importance. X-ray computed tomography (XRCT) has been used in several studies to investigate the microstructure of gas hydrate-bearing sediments, mostly under excess-gas conditions. The spatial resolution of image has been well improved over time (Yang et al., 2015; Zhao et al., 2015; Lei et al., 2019a). In addition, hydrate growth and pore habits in sediments at the pore scale were followed by 4D time–lapse imaging thanks to the higher temporal resolution of synchrotron X-Ray computed tomography (SXRCT) (Chaouachi et al., 2014; P. Kerkar et al., 2009; P. B. Kerkar et al., 2014). However, the contrast between water and methane hydrate in a XRCT image is rather poor so that it is challenging to distinguish both phases. Indeed the grey level in an XRTC image reflects the material X-ray attenuation difference and mainly depends on the material density and atomic number. That is why other types of gas or saline water solutions have been used in most studies to enhance the XRCT/ SXRCT image contrast (Kerkar et al., 2009; Kerkar et al., 2014; Chaouachi et al., 2014; Sahoo et al., 2018). To this respect, it should be noted that the methane hydrate formation phase boundary is shifted depending on the concentration of salt in the water (Sloan, 2008) and that salt exclusion during the hydrate formation results in a salt concentration increase in the remaining water (Chen et al., 2020). Furthermore, morphologies of gas hydrates depend on the type of gas used.
Chen et al. (2018), observed via XRCT Ostwald ripening-type changes of the spatial distribution in the pores space of sediments of Xenon hydrate formed following the excess-gas method, at both the pore and sample scales. Lei et al. (2019b) observed similar water migration during the formation of carbon dioxidehydrate in sediments. However, their image spatial resolution was low, with a voxel size larger than 10 µm.
Discontinuous water migrations during MH formation in wet sand with saline solution (10 wt% of Sodium Bromide - NaBr) were observed by Nikitin et al. (2019) who used SXRCT imaging at higher image spatial resolution (voxel size was about 2 µm) and higher temporal resolution.
In order to mimic natural MHBS in saline water saturated media, Kerkar et al. (2014) formed MH in saline water saturated media (5 wt% of BaCl2) following the
excess-water method. Patchy methane hydrate distributions and heterogeneous hydrate accumulations were observed via SXRCT. However, the image interpretation was based on standard filtering and segmentation methods to compensate for low image resolution (voxel size = 7.5 µm), making direct observations of MH morphologies and pore habits delicate. Recently, methane hydrate morphologies and pore habits in sandy sediments, initially under excess-gas conditions and then subjected to saline water injection, or directly under excess-water conditions, were investigated at high image spatial resolution (about 2 µm) by Lei et al. (2019a). An XRCT technique developed by Lei et al. (2018), taking advantage of both X-Ray attenuation and phase contrasts, was used to improve image contrast. However, due to the low temporal resolution of XRCT, the kinetics of methane hydrate formation could not be fully observed.
In the present study, the progressive formation and the evolution of methane hydrates under excess gas conditions were observed by using time resolved SXRCT imaging with submicron/micron voxel size. MH morphologies and pore habits, together with water migrations, at both pore and sample scales, were investigated.
Saline water (Potassium iodide - KI) was used. Experimental conditions are detailed in section 3, while section 4 summarizes main observations. Morphologies and pore habits of MHs under excess-gas conditions and under saline water conditions are discussed in section 5, where some recommendations are also formulated for further studies on MH via XRCT/SXRCT imaging.
2.
Experimental method
2.1. Materials
The sediment used in this study was Fontainebleau silica sand (NE34), which consists of poor-graded sub-rounded quartz grains whose diameter ranges from 100 to 300 micrometers. Saline solution (3.5 % of KI by weight) and methane gas with standard purity of 99.995 % were used.
2.2. Experimental setup and imaging conditions
Figure 1 provides a sketch of the experimental setup used in this study, while figure 2 shows a picture of it. Wet sand was manually compacted into an aluminum tube with an outside diameter of 6.45 mm, a thickness of 0.89 mm and a total length of about 200 mm. The sample temperature was controlled by cooled air circulated at a constant flow rate through a Poly-methyl-methacrylate (PMMA) tube, with an outside diameterof 23 mm and a thickness of 2 mm, from its top to its bottom. Note that the PMMA tube was fixed during CT scan and that the aluminum tube freely rotated inside it. The air temperature at the air inlet and outlet was measured with two thermocouples inserted into the PMMA tube. It should be noted that a preliminary experiment, with additional thermocouples in the wet sand inside the aluminum tube and on the latter, showed an identical temperature at the same height in the PMMA tube, the aluminum tube and in the sand at the center of the aluminum tube. As for
the gas pressure control, a small methane gas bottle (internal volume of 40 mL) associated with a pressure reducer was connected to the gas inlet at the lower end of the aluminum tube. This ensured a constant methane gas pressure of 7 MPa (±0.1 MPa) in the sample during the MH formation and the SXRCT scans.
SXRCT scans were performed at the PSICHE beamline of the French Synchrotron SOLEIL. A pink X-ray beam with a mean energy of 44 keV was used. X-rays were converted into visible photons by means of a 50µm thick LuAg scintillator crystal, which was observed with a Hamamatsu ORCA camera equipped with a 2048x2048 pixels CCD sensor, with a pixel size of 6.5µm, through an optical microscope based on a objective lens from Mitutoyo. Two types of scans were performed as shown in Figure 1. The high-resolution scans were focused on two central zones (Z0_HR, Z1_HR), marked with a green line. They were 1.75 mm in height and 1.75 mm in diameter and had a voxel size of 0.9 µm. The 180° scan duration was 12 minutes (0.2 hour). The low-resolution scans, marked with a blue line were 3.47 mm in diameter and 1.75 mm in height. They were performed to investigate MH distribution all along the sample height. Their voxel size was 1.8 µm and the scan duration was 15 minutes (0.25 hour). Note that the same objective lens was used for both scans. In the low-resolution scans pixels of the camera were 2x2 binned but scans were performed over 360 degrees to virtually double the 1024x1024 image resolution of the binned sensor along the horizontal direction. The PyHst software (https://software.pan-data.eu/software/74/pyhst2) was used to reconstruct the 3D images. The Paganin’s filter option was activated and its parameters were optimized to limit the phase contrast at the interfaces so that gray levels within each phase in the image remained almost homogeneous. Therefore, contrast in the obtained
SXRCT images depended mainly on the difference of X-ray material attenuation. The brightness of the different phases in the images reflects the material density, with the following order ranging from brighter to darker: sand > saline water > methane hydrate > methane gas.
2.3. Test procedure
Wet sand was manually compacted into the aluminum tube. The average porosity was about 0.40. The initial moisture content and the average water degree of saturation were evaluated to about 15% and 60%, respectively. After the installation of the system (Figure 1) onto the rotation table of the beamline, residual air was removed from the aluminum tube by using a vacuum pump prior to the application of methane gas at a pressure of 7 MPa. Afterward, MH were formed by circulating cooled air to reduce the temperature inside the PMMA tube from room temperature down to 1-2 °C. The first CT scan was performed when the temperature measured by the first thermocouple (shown in Figure 1) reached the target temperature T = 2 °C. The temperature measured by the second thermocouple was then 4 °C. The distance between the two sensors being about 150 mm, the average temperature gradient along the tube was thus 0.013 °C/mm. Figure 3 shows the type and position of the scans performed to follow the MH formation as a function of time, with t = 0 corresponding to the moment when the temperature of the cell reached the target value. During the first 17 hours, high-resolution scans were performed continuously and alternatively at the positions Z0_HR and Z1_HR. That allowed us to follow the growth of MH at grain scale in these zones. Afterwards, low-resolution scans at various positions (from Z-7 to Z9) were performed in order to investigate the MH distribution at sample scale.
3. Results
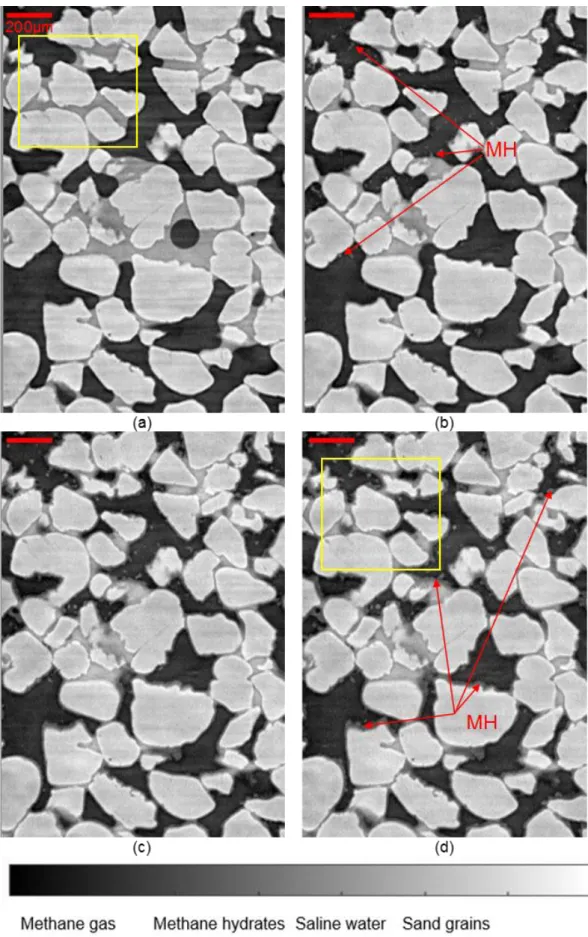
The vertical cross-section through the 3D image of zone Z0_HR recorded at the beginning of the test shown in Figure 4a and Figure 5a shows that water was located at contacts between sand grains because of capillary suction. Menisci at the interfaces between the liquid phase (water, intermediate grey level in figure 5 and yellow/green color in figure 5) and the gas phase (methane gas, dark grey in figure 4 or blue color in figure 5) can be easily identified. At t=0.58 h after the application of methane hydrate formation conditions (Figure 4b), methane hydrates were already formed and took the form of small needle-shaped MH crystals, called “filaments” in the following, located at the surface of grains or at the interface between water and gas (Figure 4b). The volume of liquid at the grain contacts was reduced compared to that shown in Figure 4a (vertical cross section are taken at the same position in the 3D image). This can be explained by the formation of methane hydrates in this zone but also in other zones (outside of the observed zone) which absorbed water. Note that no MH layer (which may have been already formed at grain surfaces and at water/ gas interfaces) could not be clearly evidenced, probably because of both their thin thickness and the partial volume effect of CT images. In these 2D cross-sections, some MH seem to be suspended in pore space but in reality they are all connected to either water/gas interfaces or grain surfaces, as evidenced when one browses the full 3D image. Unfortunately, no additional scan has been conducted between t = 0 and t = 0.58h to investigate the very beginning of MH formation. Figures 4c and 4d show MH morphologies and pore habits in zone Z0_HR at t = 4 and 4.5 h, respectively. MH filaments became bigger and thicker over time at grain surfaces and gas/water interfaces. Coarser nodular MH crystals with similarly increasing size can also be
observed. Furthermore, two different grey levels can clearly be observed in the water/hydrate areas: darker areas correspond to hydrates (or hydrate rich zones) while the brighter ones correspond to saline water, whose brightness indeed increases due to ion exclusion during MH growth (Chen et al., 2020). These areas appear respectively in light blue and yellow/orange colors in the false color representation in figure 5b. Hydrates seem to be preferentially located in the outer areas, at the interface between gas and water.
Images of the same vertical cross-section through zone Z1_HR at t = 3.8, 4.3, 8 and 12.4 h are shown in Figure 6. At t = 3.8 h (Figure 6a), MH nodular crystals/filaments and layers can be observed at grain surfaces and at gas/water interfaces. However, it seems that the MH saturation (volume of MH divided by the volume of void) was significantly lower than the average initial water saturation (i.e. 60 %). At t = 4.3 h, water and MH hydrates invaded the pore space on the top of the image while MH in the other zones were barely changed (Figure 6b and Figure 7a). At t = 8 h (Figure 6c), on the top of the image, additional MH were formed inside the pore space filled with water, corresponding to a pore-filling habit. Actually, the gray level of these zones changed from a bright level (corresponding to water) to a darker gray level (corresponding to MH). In the other zones of the image where pore spaces were filled with methane gas, MH continued to grow with respect to the image obtained at t = 4.3 h (Figure 6b). Additional grow of MH in both highly or moderately saturated pore spaces in zone Z1_HR were observed from 8 to 12.4 hours (see Figures 6c, 6d and Figure 7b).
From 8 hours, the lower part of zone Z1_HR which is shared with zone Z0_HR (red boxes in Figures 6c and 6d) was perturbated by some intense ring artefacts (which
indeed appear as rings in transverse cross-sections). Indeed, the PMMA tube which does not rotate during the scans is continuously irradiated at the same position for a given vertical position of the sample, with some overlap for scans of zones Z0 and Z1. More precisely, Figure 8 shows the images over the zone Z0_HR at subsequent times t = 12.2, 13.4 and 16.3 h. At t = 12.2 h (Figure 8a), large MH can be observed but now the whole image was influenced by such ring artefacts. We checked the PMMA tube and noted that the zone crossed by the X-ray beam, of square shape delimited by adjusted slits, was strongly damaged throughout the whole thickness of the tube: the initially transparent PMMA became a heterogeneous porous material. As stated above, in the used experimental setup, the PMMA tube was fixed during the scans, with the aluminum tube rotating inside it. As a consequence, the same PMMA zone has been continuously irradiated during all previous scans at the same height and the accumulated irradiation would have caused such damage, even more intensively in the overlapping areas. The PMMA tube was then manually rotated so that the X-ray beam no longer passed through the damaged zone to avoid such intense ring artefacts during the subsequent scans. The image obtained at t = 13.6 h (Figure 8b) shows no more such ring artefacts. However, the proportions of MH and water were well reduced compared to time t = 12.2 h. This trend was confirmed by the image obtained at t = 16.3 h (Figure 8c) where MH can no longer be observed in this zone. Only a small quantity of water remained at grain contacts. The comparison with Figure 4 shows that there were no large relative motions of the grains. However some small relative motions can be qualitatively observed when images are compared in details, showing that MH formation and dissolution may induce grain motion. A quantitative analysis of the latter, for instance with adapted discrete digital volume correlation techniques, is left for further investigations. For the purpose of the
qualitative discussion of the present study, such motions will be neglected. It should however be noted that such small motions make it difficult to quantify MH saturation by simple image subtraction techniques.
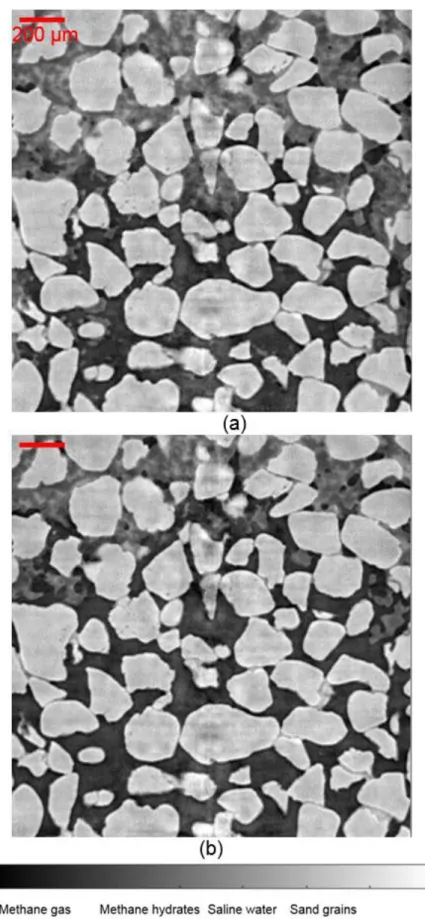
The results obtained in zone Z1_HR at t = 13.6 and 16.5 h are shown in Figure 9. The ring artefacts observed at t = 12.4 h (Figure 6d) were no longer observed at t = 13.6 h (Figure 9a). Furthermore, the quantity of MH and water seems to decrease at the bottom similarly to what was observed in zone Z0_HR (Figure 8). This reduction trend is confirmed by the image obtained at t = 16.5 h where MH could no longer be observed in the lower half part of the image (Figure 9b). Moreover, as in zone Z0_HR shown in Figure 8c, only a small quantity of water was found at grain contacts in this area. These observations in both ZR0_HR and ZR1_HR zones suggest that MH under local excess-water conditions as in the top part of the images were more stable than MHs under local excess-gas conditions as in the lower part of the image.
For a better understanding of the observed results, which suggests a strong macroscopic heterogeneity of MH volume fraction in the sample, scans at a lower resolution (voxel size: 1.8 µm) were used to enlarge the horizontal size of the investigated area of a single scan. The larger scanned zone was then 1.75 mm in height (limited by sensor size and X-ray beam height) and 3.47 mm in diameter for each scan. Furthermore, several scans were superposed to explore the sample along its length. But due to the limited beamline time, the pitch between subsequent scans was double their height (i.e. scans at intermediate heights were skipped), as shown in Figure 1. These scans were performed along the sample over a distance of 290 mm in total, with zones labelled from Z-7 to Z9 (see Figure 1 and Figure 3).
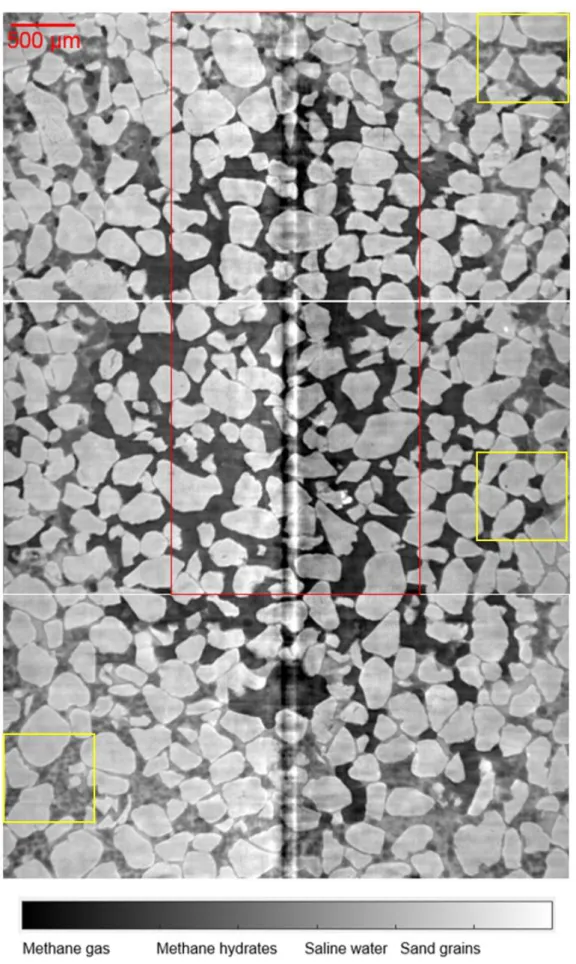
Figure 10 shows the images obtained in zones Z-1 (t = 19.2 h), Z0 (t = 21.5 h), Z1 (t = 19.5 h). The observation of the common zone of the three scans show that MH and water distributions did not change significantly during these scans. For this reason, the images were merged into a bigger image of 3.47 mm in width and 5.15 mm in height. The red box corresponds to the zones Z0_HR and Z1_HR scanned at high resolution previously. It is obvious that in the central zone (i.e. the top of zone Z-1_HR, the whole zone Z0_HR and the bottom of zone Z1_HR), no hydrates were present and the quantity of water was really small. Both MH and water in much larger amount were found in the periphery zones. Furthermore, it seems that the top of zone Z1 and the bottom of zone Z-1 have similar pore space distribution, with MH mixed with saline water together with some gas pockets. However, the quantity of MH was larger at the top of zone Z1 compared to that at the bottom of zone Z-1 which contained more water (Figure 10 and Figure 11a,c). Note that a slight ring artefact was found in the center of the images, as commonly observed in XRCT images.
Figure 12 shows vertical cross-section through images recorded at positions Z-3, Z-5 and Z-7, with details provided in Figure 13 in false colors. In some areas in these images, the granular medium was still under local gas-saturated conditions. MH were found in form of nodular crystals and layers around sand grains and at water/gas interfaces. On the other hand, in some local areas saturated with water (mostly in zones Z-3 and Z-5), some round MH particles were found.
Images of zones Z3, Z5, Z7 and Z9 are shown in Figure 14 and Figure 15. It shows that methane gas, methane hydrates and saline water were mixed in the pore space of all these zones.
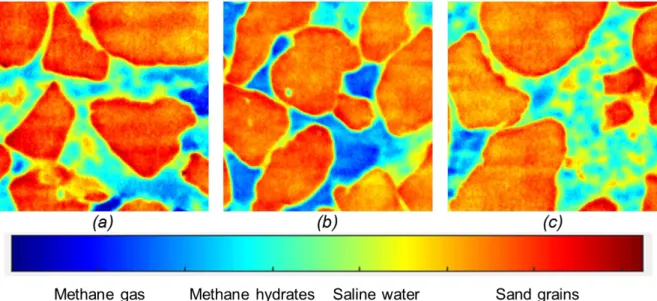
Figure 16 presents some examples of images showing various MH morphologies and pore habits. Their corresponding gray level histograms are shown in Figure 17, with a maximum count of grey level (corresponding to sand grains) of each image normalized to 1. Gray level ranges for the four phases in Figure 17 overlap as a combined consequence of partial volume effect and image noise. Both the images and their corresponding gray level histograms confirm that MH were in local gas-saturated conditions in Figure 16a, under local excess saline water conditions with some methane gas bubbles in Figure 16b and in local excess water-saturated conditions in Figure 16c. MH were found in angular nodular crystal or layer forms around sand grains and at water/ gas interfaces in local gas-saturated zones in figure 16a while they mainly took the form of round particles mixed in saline water in excess-water zones in Figure 16a, Figure 16b and in the whole Figure 16c. It seems that round MH particles of 20-30 µm were found mixed heterogeneously with saline water to create local saline water-saturated zones (pore-filling/load-bearing habit).
4. Discussions
These aforementioned results show multiple water migration mechanisms at the grain scale during MH formation in sandy sediment following the excess-gas method. That results in heterogeneous MH distributions at both pore and sample scales. Note that the excess-gas method is a common method used to create synthetic MHBS in
laboratory for both macroscopic characterizations (Miyazaki et al., 2011a & b; Hyodo et al., 2013; Le et al., 2019; Le et al., 2020) and pore-scale observations by means of XRCT or SXRCT (Chaouachi et al., 2014; Lei et al., 2019a).
Water and/or gas hydrate movement during gas hydrate formation were observed by XRCT/SXRCT (Chen et al., 2018; Lei et al., 2019a&b; Nikitin et al., 2019). Chen et al. (2018) observed a hydrate coarsening over some ten days which was explained by the reduction of the specific interfacial surfaces (Ostwald ripening). XRCT experiments were performed with Xenon hydrates while methane hydrate growth on water droplets was observed with optical microscopy. However, no water migration was observed. In the work of Lei et al. (2019b), fast water migration was found after MH nucleation, became slower after 24 h and water remained stable after 81 h. In addition, progressive methane hydrate migrations were observed by XRCT scans over the whole duration of the test. Lei et al. (2019a) observed CO2 hydrates forming
preferentially toward the periphery of the sample. In addition, sediment particles moved toward the sample center. These two phenomena were explained by cryogenic suction governed by temperature gradient generated during gas hydrate formation. Furthermore, Nikitin et al. (2019) performed SXRCT scans to observe MH formation in sandy sediment and found multiple fast water movements. That once again was explained by cryogenic suction.
In the present study, water was observed to move out of zone Z0_HR at 0.58 h (Figure 4). However, it migrated into zone Z1_HR at 3.8 h (Figure 6). In addition, both methane hydrates and water were moved out of zone Z0_HR (at t = 13.4 h, Figure
8b) and the bottom of zone Z1_HR (at t = 13.6 h, Figure 9a). The two first events would be explained by the cryogenic suction governed by a local temperature gradient during the MH formation. Vertical temperature gradient was obvious (about 0.013 °C/mm). Furthermore, both events could be interpreted as Haines jumps (i.e. sudden jumps of the fluid interfaces accompanied by fluid redistribution and a transient pressure response) when pressure-volume response was multi-value across pore throats due to the MH formation (Sun and Santamarina, 2019). It should be noted that Haines jumps are fast phenomena and that their dynamic evolution could not be captured by our high-quality images with limited temporal resolution (12’-15’ for one image). As a small quantity of small methane hydrates might be mixed in pore space with methane gas and saline solution, they could be moved together with the saline solution if they are not attached to grains or if their connection with grains is weak enough. The third event (MH and water disappearance) can be explained by the Haines jump mechanism and/or the energy supplied by X-rays that locally heated the sample. This X-ray-induced heating has been evidenced by some theoretical models and experiments when studying biological molecules with macromolecular crystallography (Helliwell, 1984; Kriminski et al., 2003; Wallander & Wallentin, 2017; Warren et al., 2019). These works showed that the increase of temperature induced by X-rays depended not only on the absorbed energy but also on the heat transfer to the surrounding medium. In the present study, zones Z0_HR and Z1_HR were exposed to X-rays continuously during the first twelve hours. Actually, within a beam power of 0.118 W/mm2, the volume
fractions of quartz, saline water and air are 0.60, 0.24 and 0.16, respectively, the heat flux provided to the this zone was estimated at 0.0015 W/mm3. By considering a simplified one-dimensional heat diffusion along the sample’s axis, the maximum
temperature increase (related to beam-induced heating) was estimated at 4 °C. That could explain the MH dissociation in these zones as shown in Figure 10. In addition, most of the water released after MH dissociation can reasonably be assumed to have moved to other zones for further MH formation. The zone Z0_HR was more sensitive to beam-induced heating than the zone Z1_HR because the zone Z0_HR was exposed to X-rays 2 hours before the scans were switched between these two zones. Furthermore, the temperature in the zone Z1_HR was slightly lower than that in the zone Z0_HR due to the vertical temperature gradient. MH still existed at the periphery of the zone Z0 (Figure 10). That could be explained by the existence of a radial temperature gradient, which was negligible for the case of wet sand in the preliminary test without MH as aforementioned, but could exist in the case of MH formation as the tube periphery was in direct contact with cooled air: the MH formation can increase sample temperature locally because it is an exothermic process and this increase of temperature in the zones nearby the tube periphery could be compensated more easily by cooled-air circulation than in the center of the tube. In addition, X-rays irradiated continuously the central part of the sample, and only intermittently the periphery. Besides, it seems that zones Z-3, Z-5 and Z-7 corresponded to the expected excess-gas media (Figure 11 and Figure 12) while the zones Z3, Z5, Z7 and Z9 (situated at higher positions) were modified due to multiple water migrations during the MH formation (Figure 14 and Figure 15). That can be explained by the vertical temperature gradient and water condensation which favored the MH formation on the top of the sample. That can also be related to the stochastic nature of Haines jump, the unstable nature of the MH formation and/or the temperature increase induced by X-ray irradiation.
The MH formation naturally is a dynamic process that favored Ostwald ripening as well as the appearance of local excess-water conditions. However, it seems that sample temperature gradient and X-rays-induced heating favored more water migrations. It should be noted that the ratio of sample height/diameter is generally close to two for macroscopic tests (e.g. triaxial tests) while it is much larger for XRCT/SXRCT studies. That involves important vertical temperature gradients. Temperature control shows an important role for MH stabilization. Furthermore, studies on MH should pay attention to the interaction of X-rays and the sample (beam-induced heating).
To mimic natural methane hydrate-bearing marine sediments, the dissolved gas method is considered as a good method. However it is time consuming, especially at high hydrate saturation, due to the low solubility of methane gas in water (Spangenberg et al., 2005). The water-excess method, proposed by Priest et al. (2009), was supposed to create load-bearing MH in sandy sediments at hydrate saturation lower than 40%, according to sonic wave velocity measurements. However, MH were observed to be formed heterogeneously inside these samples via XRCT (Kneafsey et al., 2010). Note that pore-filling MH begin bridging sediment grains and behaving as load-bearing distributions when MH saturation exceeds 25 – 40 % (Waite et al., 2009). Kerkar et al. (2014) confirmed patchy methane hydrate distribution and heterogeneous accumulations with XRCT at higher image spatial resolution. Via measurements of sonic wave velocities, MH created following the excess-gas method were supposed to be converted/redistributed from the grain contacts to the pore space between grains when sample was saturated with water (with or without an additional temperature cycle) (Choi et al., 2014; Le et al., 2019). In
the work of Lei et al. (2019b), the effect of water injection on this conversion/redistribution of MH was confirmed by XRCT scans at high image spatial resolution. Furthermore, the obtained images showed round MH particles under excess-water conditions. In the present study, MH were initially formed following the excess-gas method. However, after multiple water migrations, MH in both local excess-gas and local excess-water media were observed in the sample. MH in local excess-gas media were in cementing forms (mineral-coating and/or grain-contacts) while round MH particles were mixed with water in the pore space under local excess-water conditions (Figure 10). The faster MH formation under excess-gas conditions could explain why methane hydrates were less stable than that under excess-water conditions where MH were formed slowly (mostly via methane gas diffusion). These observations confirmed the pore-filling/load-bearing distribution of MH in excess-water media (round MHs particles mixed with water in the pore space of porous media) that are being widely used for numerical simulations (Waite et al., 2004 & 2009). It is supposed that MH distribution at the grain scale of MHBS after the water saturation at low MH saturation and after the temperature cycle in the work of Le et al. (2019 & 2020) looks alike and resembles to natural MHBS.
5. Conclusions
In the present work, methane hydrate-bearing sand was created first by pressurizing methane gas (at 7 MPa) in wet sand (with saline water, KI 3.5 wt%), followed by decreasing the sample temperature (excess-gas method). SXRCT scans were used to observe the MH formation. The following conclusions can be drawn:
MH were initially formed following the excess-gas method. However after multiple water migrations in the sample, both local excess-gas and local
excess-water media can co-exist. Water migrations can modify MH morphologies and pore habits in the pore space. The MH distribution was heterogeneous at the grain scale as well as the sample scale.
Under local excess-water conditions, round MH particles were found mixed with water in the pore space (pore-filling/load-bearing habit) while MH cement sand grains under local excess-gas conditions (grain-grain contacts and/or mineral-coating). Actually, pore-filling and load-bearing models could be used to simulate MH, at the grain scale in synthetic sandy sediments, under excess-water conditions as well as natural MHBS for numerical studies on physical/mechanical behaviors of MHBS.
MH formation in porous media is naturally a dynamic process. However, it seems that sample temperature gradient and X-ray-induced heating favor more water migrations during the MH formation observed by XRCT/SXRCT.
Acknowledgements
The present study was funded by the French National Research Agency via the project HYDRE “Mechanical behavior of gas-hydrate-bearing sediments” –ANR-15-CE06-0008. The authors would also like to express their great thanks to Synchrotron Soleil for access to the Psiché beamline via the Proposal 20181629 “Morphology and evolution of methane hydrates in granular sediment”. The technical support from Marine Lemaire and Emmanuel Delaure was highly appreciated. We also would like to thank Ross Brown (IPREM) for our interesting discussions.
Boswell, R., & Collett, T. S. (2011). Current perspectives on gas hydrate resources. Energy & Environmental Science, 4(4), 1206-1215. https://doi.org/10.1039/C0EE00203H
Chaouachi, M., Falenty, A., Sell, K., Enzmann, F., Kersten, M., Haberth, D., & Werner, F. K. (2014). Microstructural evolution of gas hydrates in sedimentary matrices observed with synchrotron X-ray computed tomographicmicroscopy. Geochemistry, Geophysics, Geosystems, 1009–1020. https://doi.org/10.1002/2013GC005162
Chen, X. and Espinoza, D. N. (2018). Ostwald ripening changes the pore habit and spatial variability of clathrate hydrate. Fuel, 214, 614–622. https://doi.org/10.1016/j.fuel.2017.11.065.
Chen, X., Espinoza, D. N., Luo, J. S., Tisato, N., & Flemings, P. B. (2020). Pore-scale evidence of ion exclusion during methane hydrate growth and evolution of hydrate pore-habit in sandy sediments. Marine and Petroleum Geology, 117, 104340. https://doi.org/10.1016/j.marpetgeo.2020.104340.
Choi, J.-H., Dai, S., Cha, J.-H., & Seol, Y. (2014). Laboratory formation of noncementing hydrates in sandy sediments. Geochemistry, Geophysics, Geosystems, 15, 1648–1656. https://doi.org/10.1002/2014GC005287
Collett, T. S., Johnson, A. H., Knapp, C. C., & Boswell, R. (2009). Natural gas hydrates: A review. The American Association of Petroleum Geologists, 89, 146–219. https://doi.org/10.1306/13201101M891602
Dai, S., Santamarina, J. C., Waite, W. F., & Kneafsey, T. J. (2012). Hydrate morphology: Physical properties of sands with patchy hydrate saturation. Journal of Geophysical Research B: Solid Earth, 117, B11205. https://doi.org/10.1029/2012JB009667
Dvorkin, J., & Nur, A. (1996). Elasticity of high-porosity sandstones: Theory for two North Sea data sets. Geophysics, 61(5), 890–893. https://doi.org/10.1190/1.1444059 Dvorkin, J., & Nur, A. (1998). Acoustic signatures of patchy saturation. International Journal of Solids and Structures, 35(34–35), 4803–4810. https://doi.org/10.1016/S0020-7683(98)00095-X
Dvorkin, J., Helgerud, M. B., Waite, W. F., Kirby, S. H., & Nur, A. (2000). Introduction to Physical Properties and Elasticity Models. In: Max M.D. (eds) Natural Gas Hydrate. Coastal Systems and Continental Margins, vol 5. Springer, Dordrecht. https://doi.org/10.1007/978-94-011-4387-5_20.
Gabitto, J. F., & Tsouris, C. (2010). Physical properties of gas hydrates: A review. Journal of Thermodynamics, 2010, 271291. https://doi.org/10.1155/2010/271291 Helgerud, M. B., Dvorkin, J., & Nur, A. (1999). Elastic-wave velocity in marine sediments with gas hy-drates: Effective medium modeling. Geophysical Research Letters, 26(13), 2021–2024. https://doi.org/http://dx.doi.org/10.1029/1999GL900421 Helliwell, J. R. (1984). Synchrotron X-radiation protein crystallography: Instrumentation, methods and applications. Reports on Progress in Physics, 47(11), 1403–1497. https://doi.org/10.1088/0034-4885/47/11/001
Hyodo, M., Yoneda, J., Yoshimoto, N., & Nakata, Y. (2013). Mechanical and dissociation properties of methane hydrate-bearing sand in deep seabed. Soils and Foundations, 53(2), 299-314. https://doi.org/10.1016/j.sandf.2013.02.010.
Kerkar, P., Jones, K. W., Kleinberg, R., Lindquist, W. B., Tomov, S., Feng, H., & Mahajan, D. (2009). Direct observations of three dimensional growth of hydrates hosted in porous media. Applied Physics Letters, 95(2), 2007–2010. https://doi.org/10.1063/1.3120544
Kerkar, P. B., Horvat, K., Jones, K. W., & Mahajan, D. (2014). Imaging methane hydrates growth dynamics in porous media using synchrotron X-ray computed tomography. Geochemistry Geophysics Geosystems, 15, 4759–4768. https://doi.org/10.1002/2014GC005373
Kneafsey, T. J., Rees, E. V. L., Nakagawa, S., & Kwon, T. (2010). Examination of Hydrate Formation Methods: Trying to Create Representative Samples. https://escholarship.org/uc/item/7v23q5mw.
Konno, Y., Yoneda, J., Egawa, K., Ito, T., Jin, Y., Kida, M., … Nagao, J. (2015). Permeability of sediment cores from methane hydrate deposit in the Eastern Nankai Trough. Marine and Petroleum Geology, 66, 487–495. https://doi.org/10.1016/j.marpetgeo.2015.02.020
Kriminski, S., Kazmierczak, M., & Thorne, R. E. (2003). Heat transfer from protein crystals: Implications for flash-cooling and X-ray beam heating. Acta Crystallographica, 59(4), 697–708. https://doi.org/10.1107/S0907444903002713 Le, T. X., Tang, A. M., Aimedieu, P., Bornert, M., Chabot, B., & Rodts, S. (2018). Methane Hydrate-Bearing Sand - An Energy Resource?. In: Randolph M., Doan D., Tang A., Bui M., Dinh V. (eds) Proceedings of the 1st Vietnam Symposium on Advances in Offshore Engineering. VSOE 2018. Lecture Notes in Civil Engineering, vol 18. Springer, Singapore. https://doi.org/10.1007/978-981-13-2306-5_20.
Le, T. X., Aimedieu, P., Bornert, M., Chabot, B., Rodts, S., & Tang, A. M. (2019). Effect of temperature cycle on mechanical properties of methane hydrate-bearing sediment. Soils and Foundations, 59(4), 814-827. https://doi.org/10.1016/j.sandf.2019.02.008.
Le, T. X., Rodts, S., Hautemayou, D., Aimedieu, P., Bornert, M., Chabot, B., & Tang, A. M. (2020). Kinetics of methane hydrate formation and dissociation in sand sediment. Geomechanics for Energy and the Environment, 23, 100103. https://doi.org/10.1016/j.gete.2018.09.007.
Lei, L., & Santamarina, J. C. (2018). Laboratory strategies for hydrate formation in fine‐grained sediments. Journal of Geophysical Research: Solid Earth, 123(4), 2583-2596. https://doi.org/10.1002/2017JB014624.
Lei, L., Seol, Y., & Jarvis, K. (2018). Pore-Scale Visualization of Methane Hydrate-Bearing Sediments With Micro-CT. Geophysical Research Letters, 45(11), 5417– 5426. https://doi.org/10.1029/2018GL078507
Lei, L., Seol, Y., Choi, J. H., & Kneafsey, T. J. (2019a). Pore habit of methane hydrate and its evolution in sediment matrix–Laboratory visualization with phase-contrast micro-CT. Marine and Petroleum Geology, 104, 451-467. https://doi.org/10.1016/j.marpetgeo.2019.04.004.
Lei, L., Liu, Z., Seol, Y., Boswell, R., & Dai, S. (2019b). An investigation of hydrate formation in unsaturated sediments using X‐ray computed tomography. Journal of Geophysical Research: Solid Earth, 124(4), 3335-3349. https://doi.org/10.1029/2018JB016125.
Masui, A., Kuniyuki, M., Hironori, H., Yuji, O., & Kazuo, A. (2008). Mechanical Properties of Natural Gas Hydrate Bearing Sediments Retrieved from Eastern Nankai Trough. In Offshore Technology Conference (OTC). Houston, Texas. https://doi.org/10.4043/19277-MS
Miyazaki, K., Masui, A., Sakamoto, Y., Aoki, K., Tenma, N., Yamaguchi, T. (2011a). Triaxial compressive properties of artificial methane-hydrate-bearing sediment. Journal of Geophysical Research: Solid Earth, 116(6), B06102. https://doi.org/10.1029/2010JB008049.
Miyazaki, K., Tenma, N., Aoki, K., Sakamoto, Y., Yamaguchi, T. (2011b). Effects of confining pressure on mechanical properties of artificial methane-hydrate-bearing sediment in triaxial compression test. Int. J. Offshore Polar Eng. 21, 148–154. https://doi.org/10.4043/20721-MS.
Nikitin, V. V., Geser, N., Dugarov, A., Duchkov, A.A., Fokin, M.I., Arkady, Drobchik, N., Shevchenko, P.D., De Carlo, F., & Mokso, R. (2020). Dynamic in-situ imaging of methane hydrate formation and self-preservation in porous media. Marine and Petroleum Geology, 115, 104234. https://doi.org/10.1016/j.marpetgeo.2020.104234 Priest, J. A., Best, A. I., & Clayton, C. R. I. (2005). A laboratory investigation into the seismic velocities of methane gas hydrate-bearing sand. Journal of Geophysical Research: Solid Earth, 110(4), B04102. https://doi.org/10.1029/2004JB003259
Priest, J. A., Rees, E. V. L., & Clayton, C. R. I. (2009). Influence of gas hydrate morphology on the seismic velocities of sands. Journal of Geophysical Research: Solid Earth, 114(11), B11205. https://doi.org/10.1029/2009JB006284
Priest, J.A., Druce, M., Roberts, J., Schultheiss, P., Nakatsuka, Y., Suzuki, K. (2015). PCATS Triaxial: A new geotechnical apparatus for characterizing pressure cores from the Nankai Trough, Japan. Marine and Petroleum Geology, 66, 460–470. https://doi.org/10.1016/j.marpetgeo.2014.12.005.
Sahoo, S. K., Madhusudhan, B. N., Marín-Moreno, H., North, L. J., Ahmed, S., Falcon-Suarez, I. H., … Best, A. I. (2018). Laboratory Insights Into the Effect of Sediment-Hosted Methane Hydrate Morphology on Elastic Wave Velocity From Time-Lapse 4-D Synchrotron X-Ray Computed Tomography. Geochemistry,
Geophysics, Geosystems, 19(11), 4502–4521.
https://doi.org/10.1029/2018GC007710
Sun, Z., & Santamarina, J. C. (2019). Haines jumps: Pore scale mechanisms. Physical Review E, 100(2), 023115. https://doi.org/10.1103/PhysRevE.100.023115. Spangenberg, E., Kulenkampff, J., Naumann, R., & Erzinger, J. (2005). Pore space hydrate formation in a glass bead sample from methane dissolved in water. Geophysical Research Letters, 32(24), L24301. https://doi.org/10.1029/2005GL024107
Waite, W. ., Winters, W. J., & Mason, D. H. (2004). Methane hydrate formation in partially water-saturated Ottawa sand. American Mineralogist, 89, 1202–1207. https://doi.org/10.2138/am-2004-8-906.
Waite, W. F., Santamarina, J. C., Cortes, D. D., Dugan, B., Espinoza, D. N., Germaine, J., … Yun, T. S. (2009). Physical properties of hydrate-bearing sediments. Reviews of Geophysics, 47(4), 1–38. https://doi.org/10.1029/2008RG000279
Wallander, H., & Wallentin, J. (2017). Simulated sample heating from a nanofocused X-ray beam. Journal of Synchrotron Radiation, 24(5), 925–933. https://doi.org/10.1107/S1600577517008712
Warren, A. J., Axford, D., & Owen, R. L. (2019). Direct measurement of X-ray-induced heating of microcrystals. Journal of Synchrotron Radiation, 991–997. https://doi.org/10.1107/S1600577519003849
Yang, L., Zhao, J., Liu, W., Li, Y., Yang, M., & Song, Y. (2015). Microstructure Observations of Natural Gas Hydrate Occurrence in Porous Media Using Microfocus X-ray Computed Tomography. Energy & Fuels, 29(8), 4835–4841. https://doi.org/10.1021/acs.energyfuels.5b00881
Yamamoto, K. (2015). Overview and introduction: Pressure core-sampling and analyses in the 2012-2013 MH21 offshore test of gas production from methane hydrates in the eastern Nankai Trough. Marine and Petroleum Geology, 66, 296– 309. https://doi.org/10.1016/j.marpetgeo.2015.02.024.
Yoneda, J., Masui, A., Konno, Y., Jin, Y., Egawa, K., Kida, M., Ito, T., Nagao, J., Tenma, N. (2015). Mechanical properties of hydrate-bearing turbidite reservoir in the first gas production test site of the Eastern Nankai Trough. Marine and Petroleum Geology, 66, 471–486. https://doi:10.1016/j.marpetgeo.2015.02.029
Yoneda, J., Masui, A., Konno, Y., Jin, Y., Kida, M., Katagiri, J., Nagao, J., Tenma, N. (2017). Pressure-core-based reservoir characterization for geomechanics: Insights from gas hydrate drilling during 2012–2013 at the eastern Nankai Trough. Marine and Petroleum Geology, 86, 1–16. https://doi:10.1016/j.marpetgeo.2017.05.024 Zhao, J., Yang, L., Liu, Y., & Song, Y. (2015). Microstructural characteristics of natural gas hydrates hosted in various sand sediments. Royal Society of Chemistry, 17(35), 22632–22641. https://doi.org/10.1039/c5cp03698d
Figure 1. Experimental setup showing pressure and temperature controls for SXRCT tests and the positions of the low- and high-resolution CT scans.
Figure 2. Picture of the experimental setup
Figure 4. Vertical cross-section through Z0_HR: (a) t = 0; (b) t = 0.58 h; (b) t = 4 h; (c) t = 4.5h.
Figure 6. Vertical cross-section through Z1_HR: (a) t = 3.8 h; (b) t = 4.3 h; (c) t = 8 h; (d) t = 12.4 h.
Figure 8. Vertical cross-section through Z0_HR: (a) t = 12.2 h; (b) t = 13.4 h; (c) t = 16.3 h.
Figure 10. Vertical cross-section through Z1 (t = 19.5 h), Z0 (t = 21.5 h), and Z-1 (t = 19.2 h). Image dimensions: 3.47 mm x 5.15 mm.
Figure 12. Vertical cross-section through 3 (a, t = 19.0 h), 5 (b, t = 18.8 h), and Z-7 (c, t = 18.5 h). Image dimensions: 3.4Z-7 mm x 1.Z-75 mm.
Figure 14. Vertical cross-section through Z9 (a, t = 20.5 h), Z7 (b, t = 20.2 h), Z5 (c, t = 20 h) and Z3 (d, t = 19.7 h). Image dimensions: 3.47 mm x 1.75 mm.
Figure 16. Possible morphologies and pore habits of MHs: (a) image in Z-3 (t = 19 h); (b) image in Z1 (t = 19.5 h; (c) image in Z-1 (t = 19.2 h).