HAL Id: hal-02884945
https://hal.archives-ouvertes.fr/hal-02884945
Submitted on 30 Jun 2020
HAL is a multi-disciplinary open access
archive for the deposit and dissemination of
sci-entific research documents, whether they are
pub-lished or not. The documents may come from
teaching and research institutions in France or
abroad, or from public or private research centers.
L’archive ouverte pluridisciplinaire HAL, est
destinée au dépôt et à la diffusion de documents
scientifiques de niveau recherche, publiés ou non,
émanant des établissements d’enseignement et de
recherche français ou étrangers, des laboratoires
publics ou privés.
Development and validation of a mass spectrometry
binding assay for mGlu5 receptor
Maria Ricart-Ortega, Alice Berizzi, Juanlo Catena, Fanny Malhaire, Lourdes
Muñoz, Carmen Serra, Guillaume Lebon, Cyril Goudet, Amadeu Llebaria
To cite this version:
Maria Ricart-Ortega, Alice Berizzi, Juanlo Catena, Fanny Malhaire, Lourdes Muñoz, et al..
Devel-opment and validation of a mass spectrometry binding assay for mGlu5 receptor. Analytical and
Bioanalytical Chemistry, Springer Verlag, In press, �10.1007/s00216-020-02772-9�. �hal-02884945�
Analytical Bioanalytical Chemistry (2020) DOI: 10.1007/s00216-020-02772-9
Development and validation of a Mass Spectrometry binding assay for mGlu5
receptor
Maria Ricart-Ortegaa,c, Alice E. Berizzic, Juanlo Catenaa, Fanny Malhairec, Lourdes Muñoza,b, Carmen Serraa,b,
Guillaume Lebonc, Cyril Goudetc,* and Amadeu Llebariaa,b*
aMCS, Laboratory of Medicinal Chemistry & Synthesis, Department of Biological Chemistry, Institute for
Advanced Chemistry of Catalonia (IQAC-CSIC), Barcelona, Spain; bSIMchem, Service of Synthesis of High
Added Value Molecules, Institute for Advanced Chemistry of Catalonia (IQAC-CSIC), Barcelona, Spain; cIGF,
CNRS, INSERM, University of Montpellier, F-34094 Montpellier, France.
* Amadeu Llebaria (ORCID: 0000-0002-8200-4827) and Cyril Goudet (ORCID: 0000-0002-8255-3535)
Email: amadeu.llebaria@iqac.csic.es and cyril.goudet@igf.cnrs.fr
Abstract
Mass spectrometry (MS) binding assays are a label‐free alternative to radioligand or fluorescence binding assays, so the readout is based on direct mass spectrometric detection of the test ligand. The study presented here describes the development and validation of a highly sensitive, rapid and robust MS binding assay for the quantification of the binding of the metabotropic glutamate 5 (mGlu5) negative allosteric modulator (NAM),
MPEP (2-Methyl-6-phenylethynylpyridine) at the mGlu5 allosteric binding site. The LC-ESI-MS/MS (Liquid
Chromatography - Electrospray Ionization - Tandem Mass Spectrometric) analytical method was established and validated with a deuterated analogue of MPEP as an internal standard. The developed MS binding assay described here allowed for the determination of MS binding affinity estimates that were in agreement with affinity estimates obtained from a tritiated MPEP radioligand saturation binding assay; indicating the suitability of this methodology for determining affinity estimates for compounds that target mGlu5 allosteric binding sites.
Keywords
MPEP, mGlu5 receptor, MS binding assays, radioligand binding assays, saturation assay
Introduction
Understanding and quantifying the binding kinetics of ligand-target interactions is critical to any carefully considered drug discovery project [1-5]. To
date, conventional methods for measuring drug-receptor binding interactions are based on
5
fluorescently labeled ligands [8] that can be quantified with high sensitivity. Despite the robustness of radioligand binding assays, they carry some inherent drawbacks in terms of safety
10
precautions, expensive synthesis, special lab requirements and waste disposal. Alternatively, the addition of fluorescent moieties to ligands considerably modifies its chemical structure, which may affect their pharmacological properties and
15
their synthesis can be challenging and costly. In many cases, the protein being investigated also needs to be altered to allow for the measurement of FRET (Förster resonance energy transfer) between a donor (the ligand’s fluorescent scaffold) and an
20
acceptor (the fluorophore attached to the target), which can lead to additional complications [9]. These approaches have been applied successfully to many different receptors, but assays have not been developed for all target proteins [10].
25
The development of mass spectrometry (MS) binding assays by several teams attempts to circumvent some of these limitations by directly measuring the binding kinetics of a ligand of interest to its target receptor in conditions that are more
30
physiologically relevant [11-23]. In this way, the quantification of binding estimates for a ligand by the MS binding technique does offer some advantages over conventional radioligand and fluorescent binding techniques. Alike with labeled
35
ligands though, ligands for MS binding are still required to fulfill a set of criteria to allow for accurate detection in an assay. Ligands should have high affinity and selectivity for their target and have low nonspecific binding. The compound should have
40
appropriate physicochemical properties to allow for suitable atmospheric ionization and quantification by HPLC-MS (High Pressure Liquid Chromatography - Mass Spectrometry) with high sensitivity.
45
The metabotropic glutamate 5 receptor (mGlu5) is
one of eight mGlu receptors that belongs to the class C G protein-coupled receptor (GPCR) family, which preferentially couple to Gq/11 proteins [24]. Its
essential role in regulating neuronal synaptic
50
activity identifies the mGlu5 as an important
therapeutic target in neurological and psychiatric disorders such as Alzheimer’s disease, pain, depression and schizophrenia [25-27]. To date, a number of allosteric modulators are available for
55
targeting the mGlu5 [27-31]. They offer greater
opportunity for selectivity at a receptor subtype owing to their ability to target a topographically distinct and non-overlapping allosteric site to that of the orthosteric (endogenous) ligand binding site,
60
which tends to be less well conserved [27-28]. In this study, we report the development and validation of a label-free MS binding assay for the mGlu5 receptor, which allows for the investigation of
the binding kinetics of mGlu5 allosteric ligands that
65
target the common allosteric site, without the need of a competing ligand. To allow for a straightforward validation of the MS binding assay, we employed a ligand that has already been validated as a
radioligand, namely,
2-Methyl-6-70
(phenylethynyl)pyridine (MPEP) - a potent mGlu5
negative allosteric modulator (NAM) [32-33]. This study describes the first equilibrium saturation MS binding assay for MPEP at the mGlu5. To achieve
this aim, MCS0455, a deuterated derivative of
75
MPEP, was synthesized to serve as an internal standard (IS). We developed a LC-ESI-MS/MS (Liquid Chromatography - Electrospray Ionization - Tandem Mass Spectrometric) method for the quantification of MPEP, MCS0455 and VU0409106,
80
a competing mGlu5 allosteric ligand [34] required for
the determination of nonspecific binding (Figure 1). This method was analytically validated and the MS binding estimates were compared to [3H]MPEP
saturation radioligand binding estimates.
Results and Discussion
Synthesis of MCS0455
The synthesis of MCS0455 is outlined in scheme 1. The mono Br/Li exchange reaction of 2,6-dibromopyridine (4) with n-Buthyllithium followed by
90
reaction with deuterated iodomethane (CD3I)
provided the monoalquilated pyridine 5 [36]. Then, compound 5 reacted with the triple bond of the ethynylbenzene via a Sonogashira cross-coupling reaction to give MCS0455 (2).
95
LC-ESI-MS/MS analytical method development
A LC-ESI-MS/MS method was initially developed enabling MPEP, MCS0455 and VU0409106 quantification in the picomolar range. For the HPLC method development, various isocratic and gradient
100
HPLC methods were evaluated to obtain suitable retention times and appropriate peak shapes. A gradient HPLC method was set as detailed in the “Materials and Methods” section. The influence of pH (3.0-10.0) of the aqueous component of the
105
mobile phase on retention time and signal intensity of MPEP, MCS0455 and VU0409106 in LC-ESI-MS chromatograms - recording m/z 194.1, m/z 197.1 and m/z 331.1 - was studied.
Three different acidic and basic mobile phases were
110
tested (10 mM ammonium formate, pH 3.0, 10 mM ammonium bicarbonate, pH 7.0 and 10 mM ammonium formate, pH 10.0) for solvent A in combination with acetonitrile as solvent B. Signal intensity of MPEP, MCS0455 and VU0409106 was
115
influenced by the pH of different mobile phases (Figure 2A). MPEP and MCS0455 retention times were not modified. In contrast, the retention time of VU0409106 was reduced under basic conditions (Figure 2B). Therefore, 10 mM ammonium
120
bicarbonate at pH 7.0 was chosen as solvent A and acetonitrile was chosen as solvent B, since the peak intensity for all the compounds was increased under these elution conditions. The effect of the injection
volume was also studied, 100 µL was selected
125
since it resulted in a larger signal to noise (SN) ratio. However, this injection volume affected retention times and resulted in a split of the VU0409106 peak; using the peak at retention time 2.06 min for quantitation. For optimized HPLC conditions, the
130
resulting retention times of MPEP, MCS0455 and VU0409106 were 2.78 min, 2.75 min and 0.34/2.06 min, respectively (Figure 3A-C). The total run time was 9 min per sample.
Optimization of ESI-MS/MS compound-dependent
135
parameters for precursors and product ions of MPEP, MCS0455 and VU0409106 was performed by infusion of a 0.01 mg ml-1 solution, dissolved in
water : acetonitrile at ratio of 1:3. Our first aim was then to identify the most abundant product ions of
140
the [M+H]+ parent ion of MPEP (m/z 194.1),
MCS0455 (m/z 197.1) and VU0409196 (m/z 331.1), respectively. After that, the MS/MS fragmentation was carried out. The most abundant fragments observed were m/z 152 ± 6 and 165 ± 8 for MPEP,
145
m/z 152 ± 6 and 168 ± 8 for MCS0455 and m/z 216 ± 2 and 313 ± 2 for VU0409106, respectively (Figure 3D-F). The optimal source parameters, the compound dependent parameter, normalized collision energy (CE) and the compound dependent
150
parameter, normalized Act Q and Act Time were established for each MS/MS transition as described in “Materials and Methods” section.
LC-ESI-MS/MS analytical method validation
The established LC-ESI-MS/MS method was
155
validated as detailed in the “Materials and Methods” section. Since interfering peaks from matrix samples were not observed at the retention times
corresponding for MPEP, MCS0455 and
VU0409106 it was considered that the assays were
160
selective. The linearity was evaluated on four separate days with two sets of calibration curves per day showing good reproducibility. The
correlation coefficients (R2) of the plotted calibration
curves were higher than 0.999. The lowest
165
concentration of analyte in a sample which can be quantified reliably, with an acceptable accuracy and precision - the lower limit of quantification (LLOQ) - was confirmed to be 0.125 nM for MPEP and MCS0455 and 0.35 nM for VU0409106 (Table 1
170
and Supplementary Table 1-2). No carry over peaks were observed following the injection of the calibration curve points.
LC-ESI-MS/MS within-run and between run accuracy and precision were evaluated for each
175
quality control (QC) sample of MPEP, MCS0455 and VU0409106 and they satisfied the indicated criteria (Table 1 and Supplementary Table 1-2). Technician within-run and between-run accuracy and precision levels were also assessed, and RE
180
(relative error) and RSD (relative standard deviation) values were lower than ± 20 % for all the QC samples of analytes (Table 1 and Supplementary Table 1-2).
The matrix factor of MPEP and MCS0455 were
185
obtained at 0.35 nM (Lower; L), 10 nM (Medium; M) and 20 nM (Higher; H) as explained in “Materials and Methods” section. While the matrix factor of VU0409106 was obtained at 1 nM (L), 10 nM (M) and 20 nM (H). The RSD of the IS-normalized
190
MPEP matrix factor calculated from the 3 lots of matrix was 10.9 % for L, 5.7 % for M and 1.9 % for H. The RSD of MPEP, MCS0455 and VU0409106 matrix factor were detailed in Supplementary Table 3. The extraction recoveries of MPEP, MCS0455
195
and VU0409106 were consistent and reproducible for each QC (Table 2).
MS binding assay development
The protocol for the MS binding assays was designed with the following workflow: incubation,
200
separation of target-ligand complex from unbound ligand by aspiration, liberation by protein
denaturation and analysis through the validated HPLC-MS/MS methodology (Figure 4). By following the different setups established by Wanner et al,
205
multiple parameters were studied in order to optimize assay conditions [10-19].
By using human (h)mGlu5 transiently transfected HEK 293T cells in preliminary experiments, different 96-well filter plate pre-treatment conditions (water
210
or 0.1-1 % polyethyleneimine) were tested for their ability to reduce nonspecific binding. By selecting 0.5 % (m/v) polyethyleneimine (PEI) as the pre-treatment condition this resulted in reduced nonspecific binding and the largest window
215
between TB (total binding) and NSB (non-specific binding) (data not shown). The effect of different elution solvents, including 100% methanol, 75% acetonitrile and 25% ammonium formate buffer (5 mM, pH 10) or 75% acetonitrile and 25%
220
ammonium bicarbonate buffer (10 mM, pH 7), was also assessed to maximise ligand recuperation. Recovery of bound ligand and reproducibility between experiments was increased by elution with acetonitrile (3 x 100 µL/well) and 10 mM ammonium
225
bicarbonate buffer, pH 7 (1 x 100 µL/well) (see Supplementary Figure 1). The effect of filtration or centrifugation on the last step of the standard setup was also assessed to improve compound recovery. This involved the addition of 100 µL of aqueous
230
solvent per well to plates prior to filtration (30 s aspiration step) or centrifugation (10 min, 2000 rpm, 4ºC) before the samples were analyzed by the HPLC-MS/MS method. Since recovery techniques showed no significant differences between MPEP
235
saturation isotherms, the filtration technique was chosen for the remainder of the experiments as it is rapid and allows for higher throughput of samples (Supplementary Figure 2).
To reduce the variability observed between
240
membranes prepared from different batches of transiently transfected cells, a stably, inducible
hmGlu5 expressing HEK293 cell line was
generated. In those cells, the level of hmGlu5
expression following induction with doxycycline is
245
highly reproducible. Following optimization of conditions, the experiments were then performed with membranes prepared from this cell line. In all assays, 1.5 nM MCS0455 as IS was added to samples to correct for the loss of MPEP in the
250
bound ligand recovery step (for more detail see method section). To prevent ligand depletion, all remaining studies used 20 µg of hmGlu5 expressing
membranes per well in a final incubation volume of 300 µL.
255
Saturation MS binding assay
The validated LC-ESI-MS/MS method was used for the quantification of MPEP, MCS0455 and VU0409106 in an hmGlu5 MS saturation binding
assay. We, therefore, describe the first saturation
260
MS binding experiment with MPEP as a native marker for hmGlu5. Total and nonspecific binding of
MPEP at the hmGlu5 was determined (Figure 5A),
and by calculating the difference of these values specific MPEP binding was determined (Figure 5B).
265
This allowed for the calculation of a KD (equilibrium
dissociation constant) value of 13.16 ± 1.24 nM and a Bmax (maximum amount of binding sites) value of
18.53 ± 2.67 pmol/mg protein. MS binding results were in agreement with the affinity estimate (KD =
270
3.65 ± 0.32 nM) obtained in [3H]MPEP radioligand
saturation binding assay for the same receptor (Supplementary Figure 3 and Supplementary Table 4) and to a KD value reported in the literature for
[3H]MPEP at the hmGlu5 receptor [37].
275
Materials and methods
Materials
All chemicals and solvents were from commercial suppliers and used without purification, with the exception of the anhydrous solvents such as
280
dimethylformamide (DMF), which were treated
previously through a system of solvent purification (PureSolv), degasified with inert gases and dried over alumina or molecular sieves. HEK 293T and HEK 293 cells were obtained from cell culture
285
service (IQAC-CSIC, Barcelona, Spain) and ATCC® CRL1573™ (Molsheim, France), respectively. Dulbecco’s modified Eagle medium (DMEM), Opti-MEM I reduced serum media, trypsin and fetal bovine serum were purchased from
290
Thermo Fisher Scientific. Antibiotics were
purchased from Sigma-Aldrich, except blasticidin and hygromycine B from InvivoGen. Polyethylenimine (PEI) and X-tremeGENE 9 were purchased from Sigma-Aldrich and Roche,
295
respectively. VU0409106 were obtained from Tocris Biosciences.
Methods
Synthesis of MCS0455
Reactions were monitored by thin layer
300
chromatography (60 F, 0.2 mm, Macherey-Nagel) by visualization under 254 and/or 365 nm lamp.
Purification was made by flash column
chromatography by using Panreac silica gel 60, 40-63 microns RE or by Isolera-Biotage equipment
305
(SNAP KP-C18-HS-12g column; A: 0.05 % formic acid in water and B: 0.05 % formic acid in acetonitrile; 5 % B 3 column volume (CV), 5 % B - 100 % B 18 CV, 100 % B 5 CV). Nuclear magnetic resonance (NMR) spectrometry was performed
310
using a Varian Mercury 400 MHz. Chemical shifts δ are reported in parts per million (ppm) against the reference compound (Chloroform δ = 7.26 ppm (1H), δ = 77.16 ppm (13C), and DMSO
δ
6 δ =2.50ppm (1H), δ = 39.52 ppm (13C). HPLC analysis
315
was performed on a 2795 Alliance HPLC system (Waters) equipped with an 1100 diode array detector (Agilent). Chromatographic separations were performed with a Zorbax Extend C18 column (2.1 x 50 mm, 3.5 µm, Agilent) with a Zorbax Extend
C18 pre-column (2.1 x 12.5 mm, 5 µm, Agilent). The mobile phase used was a mixture of solvent A (0.05 % formic acid in water) and solvent B (0.05 % formic acid in acetonitrile) with a flow rate of 0.5 mL/min. The initial mobile phase composition was 5 %
325
solvent B and these conditions were maintained for 0.5 min. Conditions were changed to 100 % solvent B (over 5 min) and these conditions were maintained for 2 min, before the return of the initial conditions. For all experiments, 10 µL of sample -
330
diluted in acetonitrile - was injected and MS detection was carried out on a Quattro micro triple quadrupole mass spectrometer (Waters), using ESI source in positive ion mode. Melting points were measured with Melting Point B-545 (Büchi), ramp
335
0.5 ºC/min with digital temperature measurement.
2-Bromo-6-methyl-d3-pyridine (5). 2,6-Dibromopyridine (4) (1.07 g, 4.53 mmol) was dissolved in tetrahydrofuran (THF) (1.3 mL) and the solution was cooled to -78 °C, followed by slow
340
addition of BuLi 2.5 M in hexane (0.186 mL, 4.65 mmol). The mixture was stirred for 1 h at 78 ºC, followed by addition of iodomethane-d3 (0.79 g,
5.44 mmol). Then, the reaction mixture was warmed to room temperature and stirred for 1 h. The
345
reaction was then quenched with 10 mL of water, and extracted with 3 x 10 mL ethyl acetate (EtOAc). The resulting organic phases were combined, dried over anhydrous Na2SO4, filtered and evaporated.
The residue was purified by flash column
350
chromatography with dichloromethane; yielding 140 mg (16 %) of the desired compound.1H NMR (400
MHz, CDCl3) δ 7.42 td (t, J = 7.6, 1H), 7.29 (dd, J =
7.6, 0.9 Hz, 1H), 7.10 (dd, J = 7.6, 0.9 Hz, 1H) [27].
2-Methyl-d3-6-phenylethynylpyridinehydrochlo-
355
ride (2). To a suspension of 2-bromo-6-methyl-d3
pyridine (5) (140 mg, 0.80 mmol),
bis(triphenylphosphine)palladium (II) dichloride (46.2 mg, 0.04 mmol) and copper iodide (7.6 mg, 0.04 mmol), in 1.5 mL of anhydrous DMF,
360
previously purged with argon, 1-ethynylbenzene (0.097 mL, 0.80mmol) and dry triethylamine (0.33 mL, 2.4 mmol) were added, and the reaction mixture was stirred at 40 °C for 8 h. After, 40 mL of EtOAc was added to the mixture, and was washed
365
with 40 mL of saturated solution of NaHCO3 and 40
mL of brine. The organic layer was dried over Na2SO4, filtered and evaporated under vacuum.
The remaining residue was purified via flash column chromatography with EtOAc-hexane (1:4). A pale
370
brown solid was isolated (100 mg, 53 %). A portion of this compound was dissolved in diethyl ether and 4 M HCl/dioxane was added, the precipitate was collected by filtration to give the hydrochloride salt as a brown solid. 1H NMR (400 MHz, DMSO-d6) δ
375
8.21 (t, J = 8 Hz, 1H), 7.84 (d, J = 8 Hz, 1H), 7.72 – 7.64 (m, 3H), 7.56 – 7.43 (m, 3H). 13C NMR (101 MHz, DMSO- d6) δ156.90, 143.20, 136.30, 132.53, 131.03, 129.46, 126.92, 126.42, 120.54, 96.18, 84.13, 20.38. HRMS (m/z): [M+H]+ calculated for380
C14D3H8N, 197.1177; found, 197.1178.HPLC/DAD: purity (abs = 254 nm) = 100 %; RT = 2.44 min. m.p. 130.5 - 132.3 ºC
LC-ESI-MS/MS
Chromatographic and mass spectrometric
385
conditions
Chromatographic separations were accomplished on a Zorbax Extend C18 column (2.1 x 50 mm, 3.5 µm, Agilent) with a Zorbax Extend C18 precolumn (2.1 x 12.5 mm, 5 µm, Agilent). HPLC analysis was
390
performed on a Thermo Scientific Dionex UltiMate 3000 High-Performance Liquid Chromatography system equipped with a pump (LPG-3400SD), an auto-sampler (ACC-3000T) with a thermostated column compartment. Gradient HPLC method was
395
used for the analysis of MPEP, the internal standard (IS), MCS0455, and VU0409106. The mobile phase consisted of solvent A (10 mM ammonium bicarbonate pH 7) and solvent B (acetonitrile) with
a flow rate of 0.9 mL/min. The initial mobile phase
400
composition was 20 % solvent B, changed progressively to 100 % for 4 min. Following 2 min under these conditions, the initial conditions were reinstated within 1 min, and then were maintained to allow for column equilibration for 2 min. The
405
column temperature was set to 40 ºC, the sampler temperature was established to 10 ºC and the injection volume was 100 µL.
Mass spectrometry detection was carried out on a LTQ XL ion trap mass spectrometer (Thermo
410
Scientific), using ESI source in positive ion mode. Quantification was performed using single reaction monitoring (SRM) mode with the transition of m/z 194.1 152 ± 6, 165 ± 8 for MPEP, m/z 197.1 152 ± 6, 168 ± 8 for MCS0455 and m/z 331.1 216
415
± 2, 313 ± 2 for VU0409106. The optimal source parameters were as follows: sheath gas flow at 60, aux gas flow at 10, sweep gas flow at 10, capillary temperature at 300 ºC, source voltage at 3 kV, capillary voltage at 1 V and tube lens at 35 V. The
420
compound dependent parameter normalized collision energy (CE) was set at 65 % for MPEP and MCS0455 and 30 % for VU0409106. The compound dependent parameter normalized Act Q was set at 0.6 % for MPEP and MCS455 and 0.25
425
% for VU0409106. The compound dependent parameter Act Time was set at 40 ms for MPEP and MCS0455 and 30 ms for VU0409106. The wideband activation option was selected. System control and data analysis were performed by
430
Thermo Xcalibur 2.2 software (Thermo Scientific).
Preparation of calibration curve and quality control samples
The calibration standard curves of MPEP, MCS0455 and VU0409106 with final concentrations
435
of 0.125 - 25 nM were obtained from working solutions (1 - 50 nM) by further dilution with acetonitrile : 10 mM ammonium bicarbonate pH 7 (3:1). Working solutions were prepared from
previous working standard solutions with
440
concentrations in the range of 10 - 500 µM, by dilution of the stock solutions with acetonitrile : 10 mM ammonium bicarbonate pH 7 (3:1).
Quality control (QC) samples with final concentrations of 0.125 nM or 0.35 nM (Lower limit
445
of quantification; LLOQ), 0.35 nM or 1 nM (Lower; L), 10 nM (Medium; M), 20 nM (Higher; H) and 25 nM (Upper limit of quantification; ULOQ) were obtained from working solutions (2 - 100 nM) by further dilution with acetonitrile: 10 mM ammonium
450
bicarbonate, pH 7 (3:1). Working solutions were prepared in the same way as calibration standards.
Analytical method validation
The Guidance of Industry Bioanalytical Method Validation was adapted to perform a full
LC-ESI-455
MS/MS validation process for MPEP, MCS0455 and VU0409106, recommended by FDA [38]. Selectivity of the method was assessed by processing ten blank matrix samples to investigate the potential interferences at the retention times for
460
the analytes and IS compound. Carry over was evaluated by injecting a blank sample after the injection of every calibration curve point. Eleven-point calibration curves were established with concentrations in the range of 0.125 - 25 nM for
465
each analyte and IS compound. Calibration curves were built by plotting the peak area of the analyte or the IS compound versus the quantities (in nmol) of the analyte or the IS compound with weighted (1/x2)
least-squares linear regression. The correlation
470
coefficient (R2) of calibration curves were more than
0.999. The back-calculated concentrations at each point were within ± 20 % of theoretical quantities, except at LLOQ and ULOQ where the calibrator should be ± 25 % of the nominal quantities at each
475
validation run.
LC-ESI-MS/MS within-run and between-run accuracy and precision were determined by
analyzing six replicates of one sample of each QC on the same day, on three consecutive days. In
480
contrast, technician within-run and between-run accuracy and precision were determined by analyzing five independent samples of each QC on the same day, on three consecutive days. The criteria for the data included accuracy (relative
485
error, RE) within ± 20 % (except ± 25 % for the LLOQ and ULOQ) and a precision (relative standard deviation, RSD) not exceeding ± 20 % (± 25 % for the LLOQ and ULOQ).
For each analyte and the IS, the matrix factor (MF)
490
was calculated for three different hmGlu5 matrix
samples at three QC levels (L, M and H), by calculating the ratio of the peak area in the presence of matrix (measured by analyzing blank matrix spiked with analyte after extraction), to the
495
peak area in absence of matrix (analyte only solution). The IS normalized MF should also be calculated by dividing the MF of the analyte by the MF of the IS. The RSD MF or the RSD of the IS-normalized MF calculated from the 3 samples of
500
matrix should be less than 15 %. The extraction recovery was determined at three QC levels (L, M and H) by comparing (in triplicate) the analytical results of extracted samples with corresponding extracts of blanks spiked with the analyte
post-505
extraction.
Generation of HEK 293 stable hmGlu5 inducible cell line
The stably expressing, inducible hmGlu5 HEK293
cell line was generated with the Flp-In-T-Rex
510
system according to manufacturer recommendations (Invitrogen). Briefly, the cDNA encoding hmGlu5 containing a Flag and SNAP tag
in N terminus (for detection) was inserted into the plasmid pcDNA5-FRT-TO-GFP (Addgene),
515
removing the GFP. This construct was co-transfected by electroporation with the recombinase
plasmid pOG44 (Invitrogen) for a targeted integration of the expression vector to the same locus in Flp-In-T-Rex HEK 293 cells (Invitrogen),
520
ensuring homogeneous levels of gene expression. Cells were grown 48 h then selected by the addition
of 15 µg/mL blasticidin and 100 µg/mL of
hygromycine B. Inducible expression of hmGlu5
was validated following induction with 1 µg/mL
525
doxycycline (Sigma-Aldrich) by anti-Flag ELISA.
Cell culture and transfections
The HEK 293T cells and the HEK 293 inducible, stably expressing hmGlu5 cell line were cultured in
DMEM supplemented with 10 % FBS and
530
maintained at 37 °C in a humidified atmosphere with 5 % CO2. HEK 293T cells were incubated in the
presence of 1 % penicillin/streptomycin while, HEK 293 inducible, stably expressing hmGlu5 cells were
maintained in the presence of 15 µg/mL blasticidin
535
and 100 µg/mL of hygromycine B. All cells were sub-cultured every two to three days in a 1:3 ratio after reaching 80 % confluence with 5 mL of trypsin to detach cells, and incubated in a humidified atmosphere at 37 °C, 5 % CO2 for 2 - 5 min. For
540
transient transfection, 4 million HEK 293T cells were seeded in 100 mm culture dishes one day before transfection. The next day, HEK 293T cells were transfected with 5 µg of hmGlu5 DNA using 15 µl of X-tremeGENE 9 diluted in 500 µL Opti-MEM
545
1X. For the inducible, stably expressing hmGlu5
cells, expression of hmGlu5 was induced by the addition of doxycycline at 1 µg/mL in 150 mm culture dishes containing 15 million cells.
Membrane preparation for MS binding and
550
[3H]MPEP binding assays
Following 48 h transfection or 24 h induction, hmGlu5-HEK cells were grown in 100 or 150 mm
culture dishes and were detached by scraping. Cells were centrifuged at 300 g for 5 min and then
555
buffer (25 mM HEPES, 10 mM EDTA and 2.5 mM MgCl2, pH 7.5). An ultrasonic cell disruptor (SFX
150, Branson) was then used to homogenize the cell suspension with 3 x 20 s bursts, which were
560
separated by 20 s periods on ice. Cell homogenates were then centrifuged at 600 g for 10 min at 4 °C. The supernatant was collected and transferred to a centrifuge tube, the remaining cell pellet was
resuspended in homogenization buffer,
re-565
homogenized and centrifuged as previous (this procedure was repeated 3-4 times). The obtained supernatants were combined, and membranes and
the cytosolic fraction were separated by
ultracentrifugation at 40 000 g, 4 ºC for 60 min. The
570
pellet was then resuspended in MS binding storage buffer (25 mM HEPES, 1 mM EDTA and 2.5 mM MgCl2, pH 7.5) or [3H]MPEP binding buffer (110 mM
NaCl, 5.4 mM KCl, 1.8 mM CaCl2, 1 mM MgSO4, 25
mM glucose, 50 mM HEPES, 58 mM sucrose; pH
575
7.4) to give a final concentration between 1.5 to 2.5 mg/mL and stored at -80 °C. Protein concentrations were determined by BCA (bicinchoninic acid) protein assay kit by following the instructions of the supplier.
580
MPEP saturation MS binding assay
hmGlu5 expressing membranes (20 µg/well) were
incubated with a range of concentrations of MPEP (1 - 100 nM) in binding buffer (25 mM HEPES, 100 mM NaCl and 2.5 mM MgCl2, pH 7.5) for 1 h at 30
585
°C, while shaking at 150 rpm, in a final assay volume of 300 µL/well. The target-ligand complex was separated from the non-binding ligand by rapid vacuum filtration through 1 µm GF filter multi-well plate (AcroPrep Advance 350 µL, Pall Corporation),
590
pre-soaked for 1 h in 0.5 % PEI, with an extraction plate manifold (Pall Corporation). Samples were washed 3 times with 150 µL of ice-cold binding buffer to eliminate excess non-binding ligand, and the filter plate was dried for 1 h at 60 ºC. The bound
595
MPEP was then recovered by elution with acetonitrile containing 1.5 nM IS (3 x 100 µL/well) and 100 µL of ammonium bicarbonate buffer (10 mM, pH 7) was added to each well, and the solution was aspirated; the final concentration of IS in each
600
sample was 1.125 nM. Samples were then transferred to HPLC vials and analyzed by HPLC-MS/MS methods (see chromatographic and mass
spectrometric conditions for more detail).
Nonspecific binding was determined in the
605
presence of 10 µΜ VU0409106.
[3H]MPEP radioligand equilibrium saturation
binding assay
hmGlu5 expressing membranes (10 µg/well) were
incubated at 30 °C for 1 h with a range of [3H]MPEP
610
concentrations (~0.5 - 25 nM) in binding buffer in a final assay volume of 100 µL/well. All binding assays were terminated by rapid filtration through 1 µm GF multi-well plates (pre-soaked for 1 h in 0.5 % PEI), and 3 washers with ice-cold binding buffer
615
to separate bound and free radioligand. 100 µL of scintillant was added to each well. Following 1 h of incubation, radioactivity was measured on a MicroBeta plate counter. MPEP (10 µM) was used to determine nonspecific binding in all cases
.
620
Data analysis
For MPEP saturation MS binding studies, analysis was performed on Thermo Xcalibur 2.2 software (Qual Browser, Thermo Scientific). Obtained MPEP peak areas were transformed to nmol of bound
625
ligand using an appropriate calibration curve, which was based on the peak area of MPEP normalized by the peak area of 1.125 nM MCS0455 (IS) versus the quantities (in nmol) of MPEP with weighted (1/x2) least-squares linear regression.
630
GraphPad prism version 8 (San Diego, CA) was used for all curve fitting and statistical analysis. MS and radioligand saturation binding experiments,
receptor expression (Bmax) and [3H]MPEP
equilibrium dissociation constants (KA) were
635
determined by applying the following equation to experimental datasets:
𝑌𝑌 = [𝐴𝐴] + 𝐾𝐾𝐵𝐵𝑚𝑚𝑚𝑚𝑚𝑚[𝐴𝐴]
𝐴𝐴+ 𝑁𝑁𝑁𝑁[𝐴𝐴]
(Equation 1)
Where Y represents the bound radioligand, Bmax is
640
the total receptor density, [A] is the ligand concentration, KA is the equilibrium dissociation
constant of the MPEP and radioligand, and NS represents the nonspecific binding of the ligand.
Conclusions
645
In the present study, we describe the first protocol for a MPEP MS saturation binding assay for the hmGlu5. A sensitive LC-ESI-MS/MS analytical
method for detection of MPEP was developed using [2H
3]MPEP as an internal standard. Its reliability
650
was determined in accordance with FDA guidelines for bioanalytical method validation with respect to selectivity, linearity, lower limit of quantification, accuracy and precision.
A protocol for a MS binding assay was then
655
developed that employs a filtration step for separating excess unbound MPEP from target-bound MPEP. The use of this MS saturation binding assay allowed for the calculation of an affinity estimate of MPEP for its hmGlu5 binding site, which
660
was consistent to the affinity estimate for [3H]MPEP
- for the same binding site - as determined by radioligand experiments. Despite the MS binding assay exhibiting lower sensitivity and throughput capabilities as compared to the radioligand binding
665
assay, the MS assay represents a suitable alternative since it does not use toxic and expensive radiolabeled ligands and the resulting equilibrium dissociation constants between binding assays and those estimates reported in the literature were
670
consistent. The established MS binding assay represents an appropriate and reliable test system
for affinity characterization of test compounds that target the MPEP allosteric binding site of the hmGlu5 receptor. The results described here clearly
675
demonstrate the power of this approach as an alternative to conventional radioligand binding assays.
Acknowledgements
We thank Prof. Jean-Philippe Pin (IGF, University of
680
Montpellier, CNRS, INSERM, Montpellier) for scientific support and contributions to this work. This work was supported by FEDER/Ministerio de Ciencia, Innovación y Universidades - Agencia Estatal de Investigación (CTQ2017-89222-R and PCI2018-093047), by the
685
Catalan government (2017SGR1604), by Neuron-ERANET, by the Agence Nationale de la Recherche (ANR-17-NEU3-0001 under the frame of Neuron Cofund) and by the Programme International de Collaboration Scientifique (PICS 08212) of the CNRS. AEB was
690
supported by the Labex EpiGenMed (program « Investissements d’avenir », ANR-10-LABX-12-01).
Compliance with Ethical Standards
xxxxx
References
695
1. Copeland R. A., Pompliano D. L. & Meek T. D. Drug-target residence time and its implications for lead optimization. Nat. Rev. Drug Discov. 2006;5:730-9. 2. Hoffmann C., Castro M., Rinken A., Leurs R., Hill S. J.
& Vischer H. F. Ligand Residence Time at
G-protein-700
coupled receptors - Why we should take our time to study it. Mol. Pharmacol. 2015;88: 552-60.
3. Swinney D. C. Applications of binding kinetics to drug discovery. Pharmaceut. Med. 2008;22:23-34. 4. Lu H. & Tonge P. J. Drug-target residence time:
705
critical information for lead optimization. Curr. Opin. Chem. Biol. 2010;14:467-74.
5. Guo D., Hillger J. M., IJzerman A. P. & Heitman L. H. Drug-target residence time - A case for G Protein-Coupled Receptors. Med. Res. Rev.
2014;34:856-710
92.
assay of adrenocorticotropic hormone: new approach to assay of polypeptide hormones in plasma. Science. 1970;170:633-5.
715
7. Pert C. B. & Snyder S. H. Opiate receptor
demonstration in nervous tissue. Science.
1973;179:1011-3.
8. Sridharan R., Zuber J., Connelly S. M., Mathew E. & Dumont M. E. Fluorescent approaches for
720
understanding interactions of ligands with G protein coupled receptors. Biochim. Biophys. Acta. 2014;1838:15-33
9. Hovius R., Vallotton P., Wohland T. & Vogel H. Fluorescence techniques: shedding light on
lighy-725
receptor interactions. Trends Pharmacol. Sci. 2000;21:266-73.
10. Zwier J. M., Roux T., Cottet M., Durroux T., Douzon S., Bdioui S., Gregor N., Bourrier E., Oueslati N., Nicolas L., Tinel N., Boisseau C., Yverneau P.,
730
Charrier-Savournin F., Fink M. & Trinquet E. A fluorescent ligand-binding alternative using Tag-lite technology. J. Biomol. Screen. 2010;15:1248-59. 11. Zepperitz C., Höfner G. & Wanner K. T. MS-binding
assays: kinetic, saturation, and competitive
735
experiments based on quantitation of bound marker as exemplified by the GABA transporter mGAT1. ChemMedChem. 2006;1:208-17.
12. Hess M., Höfner G. & Wanner K. T. (S)- and (R)-fluoxetine as native markers in mass spectrometry
740
(MS) binding assays addressing the serotonin transporter. ChemMedChem. 2011;6:1900-8.
13. Hess M., Höfner G. & Wanner K. T. Development and validation of a rapid LC-ESI-MS/MS method for quantification of fluoxetine and its application to MS
745
binding assays. Anal. Bioanal. Chem. 2011;400:3505-15.
14. Schmitt S., Höfner G. & Wanner K. T. MS transport assays for γ‐aminobutyric acid transporters an Eeficient alternative for radiometric assays. Anal.
750
Chem. 2014;86:7575-83.
15. Grimm S. H., Höfner G. & Wanner K. T. Development and validation of an LC-ESI-MS/MS method for the triple reuptake inhibitor indatraline enabling its quantification in MS binding assays. Anal. Bioanal.
755
Chem. 2015;407:471-85.
16. Grimm S. H., Höfner G. & Wanner K. T. MS binding assays for the three monoamine transporters using the triple reuptake inhibitor (1R,3S)-indatraline as native marker. ChemMedChem. 2015;10:1027-39.
760
17. Schuller M., Höfner G. & Wanner K. T. Simultaneous multiple MS binding assays addressing D1 and D2 dopamine receptors. ChemMedChem. 2017;12:1-11. 18. Sichler S., Höfner G., Rappenglück S., Wein T., Niessenb K. V., Seeger T., Worek F., Thiermann H.,
765
Paintner F.F. & Wanner K. T. Development of MS binding assays targeting the binding site of MB327 at the nicotinic acetylcholine receptor. Toxicol. Lett. 2018;293:172-83.
19. Neiens P., De Simone A., Ramershoven A., Höfner
770
G., Allmendinger L. & Wanner K. T. Development and validation of an LC-ESI-MS/MS method for the quantification of D-84, reboxetine, and citalopram for their use in MS binding assays addressing the monoamine transporters hDAT, hSERT, and hNET.
775
Biomed. Chromatogr. 2018;32:e4231.
20. Neiens P., De Simone A. Höfner G. & Wanner K. T. Simultaneous multiple MS binding assays for the Dopamine, Norepinephrine, and Serotonin transporters. ChemMedChem. 2018;13:453-63.
780
21. Massink A., Holzheimer M., Hölscher A., Louvel J., Guo D., Spijksma G., Hankemeier T. & IJzerman A. P. Mass spectrometry-based ligand binding assays on adenosine A1 and A2A receptors. Purinergic Signal. 2015;11:581-594.
785
22. Rossato M., Miralles G., M’Kadmi C., Maingot M., Amblard M., Mouillac B., Gagne D., Martinez J., Subra G., Enjalbal C. & Cantel S. Quantitative MALDI-MS Binding Assays: An alternative to Radiolabeling. ChemMedChem. 2016;11:2582-7
790
23. Cheignon C., Cordeau E., Prache N., Cantel S., Martinez J., Subra G., Arnaudguilem C., Bouyssiere B. & Enjalbal C. Receptor-ligand interaction measured by Inductively Coupled Plasma Mass Spectrometry and selenium labeling. J. Med. Chem.
795
2018;61:10173-84.
24. Nasrallah, C., Rottier, K., Marcellin, R., Compan, V., Font, J., Llebaria, A., Pin J. P., Banères J. L. & Lebon G. Direct coupling of detergent purified human mGlu5 receptor to the heterotrimeric G proteins Gq and Gs.
800
25. Niswender C. M. & Conn P. J. Metabotropic glutamate receptors: physiology, pharmacology, and disease. Annu. Rev. Pharmacol. Toxicol. 2010;50:295-322.
805
26. Nicoletti F., Bockaert J., Collingridge G. L., Conn P. J., Ferraguti F., Schoepp D. D., Wroblewski J. T. & Pin J.P. Metabotropic glutamate receptors: from the workbench to the bedside. Neuropharmacology. 2011;60:1017-41.
810
27. Pereira, V. & Goudet, C. Emerging trends in pain modulation by Metabotropic Glutamate Receptors. Front. Mol. Neurosci. 2018;11:464.
28. Walker, A. G. & Conn, P. J. Group I and group II metabotropic glutamate receptor allosteric
815
modulators as novel potential antipsychotics. Curr. Opin. Pharmacol. 2015;20:40-5.
29. Marszalek-Grabska M., Gibula-Bruzda E., Bodzon-Kulakowaka A., Suder P., Gawel K., Talarek S., Listos J., Kedzierska E., Danysz W. & Kotlinska J. H.
ADX-820
47273, a mGlu5 receptor positive allosteric modulator, attenuates deficits in cognitive flexibility induced by withdrawal from ‘binge-like’ ethanol exposure in rats. Behav. Brain Res. 2018;338:9-16. 30. Felts A. S., Bollinger K. A., Brassard C. J., Rodriguez
825
A. L., Morrison R. D., Scott Daniels J., Blobaum A. L., Niswender C. M., Jones C. K., Conn P. J., Emmitte K. A. & Lindsley C. W. Discovery of 4-alkoxy-6-methylpicolinamide negative allosteric modulators of metabotropic glutamate receptor subtype 5. Bioorg.
830
Med. Chem. Lett. 2019;29:47-50.
31. Cavallone L. F., Montana M. C., Frey K., Kallogjeri D., Wages J. M., Rodebaugh T. L., Doshi T., Kharasch E. D. & Gereau R. W. The metabotropic glutamate receptor 5 negative allosteric modulator
835
fenobam: pharmacokinetics, side effects, and analgesic effects in healthy human subjects. Pain. 2020;161:135-146.
32. Gasparini F., Lingenhöhl K., Stoehr N., Flor P. J., Heinrich M., Vranesic I., Biollaz M., Allgeier H.,
840
Heckendorn R., Urwyler S., Varney M. A., Johnson E. C., Hess S. D., Rao S. P., Sacaan A. I., Santori E. M., Veliçelebi G. & Kuhn R. 2-Methyl-6-(phenylethynyl)-pyridine (MPEP), a potent, selective and systemically active mGlu5 receptor antagonist.
845
Neuropharmacology. 1999;38:1493-503.
33. Nagel J., Greco S., Parsons C. G., Flik G., Tober C., Klein K. U. & Danysz W. Brain concentrations of mGluR5 negative allosteric modulator MTEP in relation to receptor occupancy - Comparison to
850
MPEP. Pharmacol. Rep. 2015;67:624-30.
34. Felts A. S., Rodriguez A. L., Morrison R. D., Venable D. F., Manka J. T., Bates B. S., Blobaum A. L., Byers F. W., Daniels J. S., Niswender C. M., Jones C. K., Conn P. J., Lindsley C. W. & Emmitte K. A. Discovery
855
of VU0409106: A negative allosteric modulator of mGlu5 with activity in a mouse model of anxiety. Bioorg. Med. Chem. Lett. 2013;23:5779-85
35. Alagille D., Baldwin R. M., Roth B. L., Wroblewski J. T., Grajkowska E. & Tamagnan G. D. Synthesis and
860
receptor assay of aromatic-ethynyl-aromatic derivatives with potent mGluR5 antagonist activity. Bioorg. Med. Chem. 2005;13:197-209.
36. Xu Z., Lou Y., Chen L., Zeng K., Sun Q & Lei X. WO 2019144765.
865
37. Porter R. H., Jaeschke G., Spooren W., Ballard T. M., Büttelmann B., Kolczewski S., Peters J. U., Prinssen E., Wichmann J., Vieira E., Mulhemann A., Gatti S., Mutel V. & Malherbe P. Fenobam: a clinically validated nonbenzodiazepine anxiolytic is a potent,
870
selective, and noncompetitive mGlu5 receptor antagonist with inverse agonist activity. J. Pharmacol. Exp. Ther. 2005;315:711-21.
38. US Department of Health and Human Services Food and Drug Administration. Guidance for industry:
875
bioanalytical method validation, https://www.fda.gov/media /70858/download
Graphical abstract
Figures, scheme & tables
885
Figure 1. Chemical structures of molecules used for binding experiments. Structures of ligand marker MPEP (2-methyl-6-(phenylethynyl)pyridine) (1) synthesized in MCS group according to described conditions in the literature [35], deuterated MPEP (or MCS0455) (2) used as internal standard and VU0409106 (3) used for determination of nonspecific binding in MS binding assays.
890
Scheme 1. Synthetic route to prepare MCS0455 (2).
Figure 2. Influence of the aqueous phase pH on signal intensity and retention time of MPEP, MCS0455 and VU0409106. pH values are plotted against (A) intensity, defined as peak area (m/z 194.1 for MPEP, m/z 197.1 for MCS0455 and m/z 331.1 for VU0409106) and (B) retention time of 50 mM of each compound (means ± SEM, n = 4).
900
Figure 3. MRM chromatograms and production scan spectra of MPEP (blue), MCS0455 (green) and VU0409106 (red). MRM chromatogram and product ion scans in ESI (+) mode for m/z 152 ± 6 and 165 ± 8 of MPEP (A, D), m/z 152 ± 6 and 168 ± 8 for MCS0455
905
(B, E) and m/z 216 ± 2 and 313 ± 2 for VU0409106 (C, F) at a concentration of 5 nM dissolved in 10 mM ammonium bicarbonate pH 7: acetonitrile at ratio of 1:3.
910
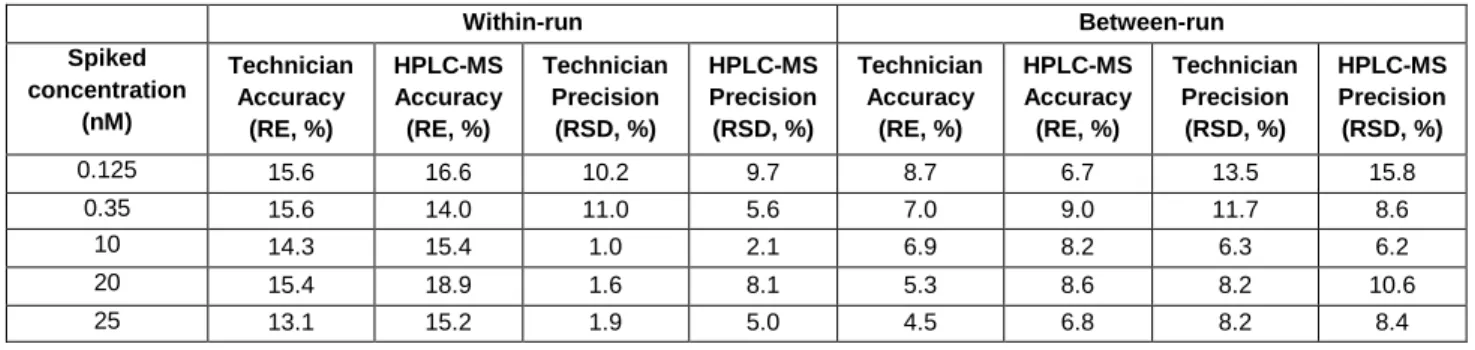
Table 1. Within- and between-run accuracy and precision of HPLC-MS/MS method to determine MPEP signal (n = 3 r, 6 replicates per run). Quality control (QC) samples with final concentrations of 0.125 nM (Lower limit of quantification; LLOQ), 0.35 nM (Lower; L), 10 nM (Medium; M), 20 nM (Higher; H) and 25 nM (Upper limit of quantification; ULOQ) were prepared in acetonitrile : 10 mM ammonium bicarbonate, pH 7 (3:1). The criteria for the data included accuracy (relative error, RE) and a precision (relative standard deviation, RSD) within ± 20 % (except ± 25 % for the LLOQ and ULOQ).
915
920
Table 2. Recovery of L, M and H quality control (QC) extractions for MPEP, MCS0455 and VU0409106 (n = 3 r, 3 replicates per run). Extractions were determined by comparing the analytical results of samples from corresponding extracts of blanks spiked with the analyte post-extraction. Data are expressed as a percentage of recovery range for each QC level.
925
% Recovery range
Quality control MPEP MCS0455 VU0409106
L 96.4 - 121.6 113.5 - 123.7 97.9 - 111.4 M 93.9 - 107.8 101.8 - 102.4 70.2 - 103.9 H 102.5 - 103.7 102.8 - 104.0 82.3 - 99.7 Within-run Between-run Spiked concentration (nM) Technician Accuracy (RE, %) HPLC-MS Accuracy (RE, %) Technician Precision (RSD, %) HPLC-MS Precision (RSD, %) Technician Accuracy (RE, %) HPLC-MS Accuracy (RE, %) Technician Precision (RSD, %) HPLC-MS Precision (RSD, %) 0.125 15.6 16.6 10.2 9.7 8.7 6.7 13.5 15.8 0.35 15.6 14.0 11.0 5.6 7.0 9.0 11.7 8.6 10 14.3 15.4 1.0 2.1 6.9 8.2 6.3 6.2 20 15.4 18.9 1.6 8.1 5.3 8.6 8.2 10.6 25 13.1 15.2 1.9 5.0 4.5 6.8 8.2 8.4
930
Figure 4. Flowchart of the protocol for the MS binding assay. For the saturation binding assay, hmGlu5 expressing membranes (20
µg/well) were incubated with a range of concentrations of MPEP in binding buffer for 1 h at 30 °C while shaking at 150 rpm; final assay volume 300 µL/well. Then, the target-ligand complex was separated from the non-binding ligand by rapid vacuum filtration through 1 µm
935
GF filter multi-well plate, pre-soaked for 1 h in 0.5 % PEI, with an extraction plate manifold. Samples were washed 3 times with 150 µL of ice-cold binding buffer and the filter plate was dried for 1 h at 60 ºC. The bound ligand was then recovered by filtration with acetonitrile containing the corresponding IS (3 x 100 µL/well) and 10 mM ammonium bicarbonate buffer, pH 7.0 (1 x 100 µL/well). Samples were then transferred to HPLC vials and analyzed by HPLC-MS/MS methods. Nonspecific binding was determined in the presence of 10 µΜ VU0409106.
940
Figure 5. MPEP MS saturation binding study at mGlu5. Increasing concentrations of MPEP (1 to 100 nM) were incubated with 20 µg/well
of membranes prepared from hmGlu5 expressing HEK cells for 1 h at 30 ºC. (A) Data are expressed as a percentage of bound ligand and
945
(◻). (B) Data are expressed as a percentage of bound ligand and represent the mean ± SEM of eight independent experiments performed in duplicate for specific binding (SB) (△). Nonspecific binding was determined in the presence of 10 µΜ VU0409106.
Analytical Bioanalytical Chemistry
Supplementary information for
Development and validation of a Mass Spectrometry binding assay for mGlu5
receptor
Maria Ricart-Ortegaa,c, Alice E. Berizzic, Juanlo Catenaa, Fanny Malhairec, Lourdes Muñoza,b, Carmen Serraa,b,
Guillaume Lebonc, Cyril Goudetc,* and Amadeu Llebariaa,b*
aMCS, Laboratory of Medicinal Chemistry & Synthesis, Department of Biological Chemistry, Institute for
Advanced Chemistry of Catalonia (IQAC-CSIC), Barcelona, Spain; bSIMchem, Service of Synthesis of High
Added Value Molecules, Institute for Advanced Chemistry of Catalonia (IQAC-CSIC), Barcelona, Spain; cIGF,
CNRS, INSERM, University of Montpellier, F-34094 Montpellier, France.
* Amadeu Llebaria (ORCID: 0000-0002-8200-4827) and Cyril Goudet (ORCID: 0000-0002-8255-3535)
Supplementary Table 1. Within- and between-run accuracy and precision of HPLC-MS/MS method to determine MCS0455 signal (n = 3 r, 6 replicates per run). Quality control (QC) samples with final concentrations of 0.125 nM (Lower limit of quantification; LLOQ), 0.35 nM (Lower; L), 10 nM (Medium; M), 20 nM (Higher; H) and 25 nM (Upper limit of quantification; ULOQ) were prepared in acetonitrile : 10 mM ammonium bicarbonate, pH 7 (3:1). The criteria for the data included accuracy (relative error, RE) and precision (relative standard deviation, RSD) within ± 20 % (except ± 25 % for the LLOQ and ULOQ).
Within-run Between-run Spiked concentration (nM) Technician Accuracy (RE, %) HPLC-MS Accuracy (RE, %) Technician Precision (RSD, %) HPLC-MS Precision (RSD, %) Technician Accuracy (RE, %) HPLC-MS Accuracy (RE, %) Technician Precision (RSD, %) HPLC-MS Precision (RSD, %) 0.125 - 16.8 - 12.8 18.7 16.6 - 7.2 - 7.6 13.5 12.4 0.35 12.7 10.9 7.2 8.0 7.1 7.4 7.5 8.5 10 - 5.6 - 4.8 3.7 1.7 - 1.2 0.1 3.4 4.2 20 - 3.7 4.1 1.1 8.8 - 0.6 2.5 2.4 6.9 25 - 5.8 - 3.2 1.8 6.7 - 4.2 - 0.7 2.0 5.4
Supplementary Table 2. Within- and between-run accuracy and precision of HPLC-MS/MS method to determine VU0409106 signal (n = 3 r, 6 replicates per run). Quality control (QC) samples with final concentrations of 0.35 nM (Lower limit of quantification; LLOQ), 1 nM (Lower; L), 10 nM (Medium; M), 20 nM (Higher; H) and 25 nM (Upper limit of quantification; ULOQ) were prepared in acetonitrile : 10 mM ammonium bicarbonate, pH 7 (3:1). The criteria for the data included accuracy (relative error, RE) and precision (relative standard deviation, RSD) within ± 20 % (except ± 25 % for the LLOQ and ULOQ).
Within-run Between-run Spiked concentration (nM) Technician Accuracy (RE, %) HPLC-MS Accuracy (RE, %) Technician Precision (RSD, %) HPLC-MS Precision (RSD, %) Technician Accuracy (RE, %) HPLC-MS Accuracy (RE, %) Technician Precision (RSD, %) HPLC-MS Precision (RSD, %) 0.35 14.8 16.5 8.6 11.3 8.8 10.6 11.7 11.6 1 12.3 14.6 4.7 7.8 8.0 10.2 7.6 8.5 10 - 6.3 5.6 5.8 5.8 - 1.8 1.5 4.5 5.5 20 - 5.3 - 5.3 2.3 6.4 - 2.4 1.3 2.7 6.5 25 - 7.9 - 5.7 3.4 2.4 - 5.4 - 0.8 3.7 5.2
Supplementary Table 3. % Relative standard deviation (RSD) matrix factor of L, M and H quality controls (QCs) for MPEP, MCS0455 and VU0409106 (n = 3 r, 3 replicates per run). The matrix factor was calculated by calculating the ratio of the peak area in the presence of matrix (measured by analyzing blank matrix spiked with analyte after extraction), to the peak area in absence of matrix (analyte only solution). Data are expressed as a percentage of RSD for each QC level.
% RSD matrix factor
Quality control MPEP MCS0455 VU0409106
L 9.4 10.7 13.1
M 4.3 2.6 8.6
H 3.4 2.6 8.8
Supplementary Table 4. Summary of [3H]MPEP K
D (equilibrium dissociation constant) and Bmax (maximum amount of binding
sites) estimates as determined by [3H]MPEP radioligand equilibrium saturation binding assay.
Allosteric ligand KD (nM) Bmax (fmol/mg protein)
Supplementary Figure 1. The effect of different elution solvents on recovery of target-ligand complexes and reproducibility between experiments. Increasing concentrations of MPEP (3 to 500 nM) were incubated with hmGlu5 expressing membranes (40 µg/well)
for 1 h at 30 ºC. The separation of target-ligand complex from unbound ligand was performed by filtration with 96-well filter plates, pre-treated with 0.5 % PEI. The bound ligand was then recovered by elution with different solvents, including 100 % methanol, 75 % acetonitrile and 25 % ammonium formate buffer (5 mM, pH 10) or 75 % acetonitrile and 25 % ammonium bicarbonate buffer (10 mM, pH 7). Data are expressed as percentage of specific bound ligand and represent the mean ± SEM of at least three experiment performed in duplicate. Nonspecific binding was determined in the presence of 10 µΜ M-MPEP.
Supplementary Figure 2. The effect of filtration or centrifugation on recovery of target-ligand complexes and reproducibility between experiments. Increasing concentrations of MPEP (3 to 300 nM) were incubated with hmGlu5 expressing membranes (40 µg/well)
for 1 h at 30 ºC. The separation of target-ligand complex from unbound ligand was done with a 96-well filter plate, pre-treated with 0.5 % PEI. Acetonitrile was then added to each well (3 x 100 µL/well) and the bound ligand was recovered by filtration. Subsequently, 10 mM ammonium bicarbonate buffer, pH 7 was added to each well (1 x 100 µL/well) and the solution was filtered (30 s aspiration step) or centrifuged (10 min, 2000 rpm, 4ºC) before the samples were analyzed according to the HPLC-MS/MS method. Data are expressed as percentage of specific bound ligand and represent the mean ± SEM of at least two experiment performed in duplicate. Nonspecific binding was determined in the presence of 10 µΜ M-MPEP.
Supplementary Figure 3. [3H]MPEP radioligand equilibrium saturation binding study at mGlu
5. 10 µg of membranes prepared from
hmGlu5 expressing HEK cells were incubated with increasing concentrations of [3H]MPEP for 1 h at 30 ºC. Data are expressed as a
percentage of specific binding and represent the mean ± SEM of three independent experiments performed in duplicate. Nonspecific binding was determined in the presence of 10 µΜ MPEP.
![Figure 1. Chemical structures of molecules used for binding experiments. Structures of ligand marker MPEP (2-methyl-6- (2-methyl-6-(phenylethynyl)pyridine) (1) synthesized in MCS group according to described conditions in the literature [35], deuterated](https://thumb-eu.123doks.com/thumbv2/123doknet/14652949.551976/15.892.204.683.178.554/structures-experiments-structures-phenylethynyl-synthesized-conditions-literature-deuterated.webp)