HAL Id: hal-00301371
https://hal.archives-ouvertes.fr/hal-00301371
Submitted on 14 Nov 2003HAL is a multi-disciplinary open access
archive for the deposit and dissemination of sci-entific research documents, whether they are pub-lished or not. The documents may come from teaching and research institutions in France or abroad, or from public or private research centers.
L’archive ouverte pluridisciplinaire HAL, est destinée au dépôt et à la diffusion de documents scientifiques de niveau recherche, publiés ou non, émanant des établissements d’enseignement et de recherche français ou étrangers, des laboratoires publics ou privés.
The vertical distribution of aerosols, Saharan dust and
cirrus clouds at Rome (Italy) in the year 2001
G. P. Gobbi, F. Barnaba
To cite this version:
G. P. Gobbi, F. Barnaba. The vertical distribution of aerosols, Saharan dust and cirrus clouds at Rome (Italy) in the year 2001. Atmospheric Chemistry and Physics Discussions, European Geosciences Union, 2003, 3 (6), pp.5755-5775. �hal-00301371�
ACPD
3, 5755–5775, 2003Vertical distribution of aerosols, Saharan
dust and cirrus clouds G. P. Gobbi and F. Barnaba Title Page Abstract Introduction Conclusions References Tables Figures J I J I Back Close
Full Screen / Esc
Print Version Interactive Discussion
Atmos. Chem. Phys. Discuss., 3, 5755–5775, 2003 www.atmos-chem-phys.org/acpd/3/5755/
© European Geosciences Union 2003
Atmospheric Chemistry and Physics Discussions
The vertical distribution of aerosols,
Saharan dust and cirrus clouds at Rome
(Italy) in the year 2001
G. P. Gobbi and F. Barnaba
Istituto di Scienze dell’Atmosfera e del Clima – CNR, Roma, Italy
Received: 9 September 2003 – Accepted: 10 November 2003 – Published: 14 November 2003
ACPD
3, 5755–5775, 2003Vertical distribution of aerosols, Saharan
dust and cirrus clouds G. P. Gobbi and F. Barnaba Title Page Abstract Introduction Conclusions References Tables Figures J I J I Back Close
Full Screen / Esc
Print Version Interactive Discussion
Abstract
A set of 813 lidar profiles of tropospheric aerosol and cirrus clouds extinction and de-polarization observed at Rome, Italy, between February 2001 and February 2002 is analyzed and discussed. The yearly record reveals a meaningful contribution of both cirrus clouds (38%) and Saharan dust (12%) to the total optical thickness (OT) of 0.26,
5
at 532 nm. Seasonal analysis shows the planetary boundary layer (PBL) aerosols to be confined below 2 km in winter and 3.8 km in summer, with relevant OT shifting from 0.08 to 0.16, respectively. Cirrus clouds maximize in spring and autumn, in both cases with average OT similar to the PBL aerosols one. With the exception of winter months, Sa-haran dust is found to represent an important third layer mostly residing between PBL
10
aerosols and cirrus clouds, with yearly average OT≈0.03. Saharan dust and cirrus clouds were detected in 20% and in 45% of the observational days, respectively. Val-idation of the lidar OT retrievals against collocated sunphotometer observations show very good agreement. These results represent one of the few yearly records of tropo-spheric aerosol vertical profiles available in the literature.
15
1. Introduction
Current global radiative balance estimates attribute to atmospheric aerosols a negative forcing comparable and opposite to the one of greenhouse gases (e.g. Penner et al., 2001). This is the result of a direct effect, produced by the aerosol scattering and absorption of solar radiation, and of an indirect (larger) effect related to the aerosol
20
capability of affecting cloud formation and radiative properties (e.g. Ramanathan et al., 2001). These effects take place mainly within and above the planetary boundary layer (PBL), respectively. The PBL is the region where most of the atmospheric aerosol mass is located (e.g. Jaenicke, 1992). At the same time, it is well established that large amounts of mineral dust from arid regions of the Earth (e.g. Prospero et al., 2002) are
25
ACPD
3, 5755–5775, 2003Vertical distribution of aerosols, Saharan
dust and cirrus clouds G. P. Gobbi and F. Barnaba Title Page Abstract Introduction Conclusions References Tables Figures J I J I Back Close
Full Screen / Esc
Print Version Interactive Discussion
2002) and transported over thousands of kilometers (e.g. Duce et al., 1980; Prospero et al., 1983; Moulin et al., 1998).
Such a variable height-dependent distribution explains why a large part of the inde-termination in forecasting the aerosol radiative impact derives from differences in the aerosol vertical profile employed in models (e.g. Penner et al., 2001). In fact, our
knowl-5
edge about height-resolved aerosol properties over long-term periods is still rather poor. Data is mostly limited to localized observations (e.g. Hofmann, 1993; Balis et al., 2000; Sakai et al., 2000; Schneider and Eixmann, 2002; De Tomasi and Perrone, 2003). More often the observations refer to limited portions of the troposphere (e.g. Kent et al., 1991; Matthias and Bosenberg, 2002; Del Guasta, 2002) or to case studies
10
(e.g. Gasso et al., 2000; Murayama et al., 2001; Muller et al., 2003). This shortcoming will be reduced when systematic, space-borne lidar experiments as CALIPSO (NASA-CNES,http://www-calipso.larc.nasa.gov) and Earthcare (ESA, http://www.esa.int) will become operational. Still, ground-based observations will remain necessary to provide validated and continuous inputs to climate models.
15
In this paper we present a one-year record of aerosol and cirrus cloud observa-tions made at the southern outskirts of Rome, Italy (41.840◦N–12.647◦E, 130 m a.s.l.) by means of a polarization-sensitive lidar operated in both day and night-time condi-tions. In this semi-rural location we expect the presence of continental plus combustion-originated aerosols, leading to moderately polluted PBL conditions. Furthermore, as
20
in the whole Mediterranean region, we expect a strong input of mineral dust from the Sahara desert (e.g. Moulin et al., 1998). With the aim of providing data suitable for use in radiative transfer models, the lidar-derived profiles of optical properties and thermo-dynamic phase of aerosols and cirrus clouds will be discussed in terms of both their seasonal variability and yearly average characterization.
ACPD
3, 5755–5775, 2003Vertical distribution of aerosols, Saharan
dust and cirrus clouds G. P. Gobbi and F. Barnaba Title Page Abstract Introduction Conclusions References Tables Figures J I J I Back Close
Full Screen / Esc
Print Version Interactive Discussion
2. Methods
The lidar system employed in our observations exploits a frequency-doubled Nd:YAG laser, emitting 532 nm, plane-polarized, 30 mJ pulses at 10 Hz. Two co-located tele-scopes, a 10 cm and a 25 cm one, allow to collect a full backscatter profile between 300 m and 14 km from the ground (e.g. Gobbi et al., 2000). Parallel and cross-polarized
5
components (with respect to the laser polarization plane) of the backscatter signal are collected and recorded at both telescopes by photon-counting detection chains. Each lidar profile is obtained by averaging 6000 laser shots, has a maximum vertical resolu-tion of 37.5 m and is calibrated at an aerosol-free height, against a monthly standard atmosphere, obtained from a ten-year climatology of radio-soundings launched 30 km
10
West of our site.
Signal analysis is performed according to the approach outlined in Gobbi et al. (2002). In particular, the lidar equation (e.g. Measure, 1984) is solved numerically and the ratio between aerosol extinction and backscatter coefficients (σa/βa, needed to retrieve both βa and σa from the single-wavelength lidar profile) is determined by
15
means of aerosol models providing a functional relationship σa = f (βa) (e.g. discus-sion below). The procedure to retrieve the aerosol backscatter βa(z) at each level (z) of the profile can be summarized as follows: 1) The molecular backscatter profile
βm(z) is computed from the model atmosphere. The lidar trace is calibrated against this βm(z) profile at an aerosol-free level individuated by visual analysis of the signal.
20
The calibrated lidar signal then represents the unattenuated total backscatter profile
βtot(z) = βm(z)+ βa(z); 2) the aerosol backscatter βa(z) at each measurement point is determined as βa(z) = βtot(z) − βm(z); 3) the aerosol extinction σa at each mea-surement point is obtained from the σa = f (βa) model relationship on the basis of the aerosol backscatter βa computed at step 2; 4) at each measurement point the
25
calibrated signal βtot(z) is corrected for both the aerosol and molecular extinction en-countered below that point, then providing a new extinction corrected profile β0tot(z); 5) steps 1–4 are iterated until convergence on integrated aerosol backscatter is reached,
ACPD
3, 5755–5775, 2003Vertical distribution of aerosols, Saharan
dust and cirrus clouds G. P. Gobbi and F. Barnaba Title Page Abstract Introduction Conclusions References Tables Figures J I J I Back Close
Full Screen / Esc
Print Version Interactive Discussion
according to the condition:Σi|βa0(zi) − βa(zi)|/Σiβa(zi) ≤ 10−3, with i indicating the i-th discrete level of the lidar profile. Errors in the retrieval of βa(z) depend on measurement conditions and range. Following the error analysis method of Russell et al. (1979), typ-ical errors of d β/β≈20% characterize the backscatter coefficients discussed in this paper.
5
In this analysis, a continental aerosol model (Barnaba and Gobbi, 2003) has been employed as default, while the mineral dust model (Barnaba and Gobbi, 2001) is used during Saharan dust events. Presence of dust is predicted by means of forecast model analysis (e.g. the DREAM model of the Euro Mediterranean Centre for Insular Coastal Dynamics of Malta:http://www.icod.org.mt/), and confirmed by the lidar depolarization
10
trace, which, as shown in Sect. 3, is highly effective at revealing the presence of non-spherical particles (see also Gobbi et al., 2000). Finally, an ice particles model (Gobbi, 1995) is employed for the signal analysis in regions where cirrus clouds are detected. The mean error of the extinction coefficients obtained by these retrievals is of the order of 20–50% (typically 35%), depending on measurement conditions and aerosol type,
15
e.g. Barnaba and Gobbi (2001).
The lidar-derived variables we will discuss are: 1) the 532 nm aerosol extinction co-efficient σa (km−1), 2) the linear depolarization ratio D, and 3) the backscatter ratio
R = (βa+ βm)/βm. In our analysis, D is defined as the ratio between cross (⊥) and parallel (//) polarized backscatter signals, i.e. D= S⊥/S//∝ (β⊥a+β⊥m)/(β//a+β//m).
20
Therefore, D is a weighed contribution of molecular and aerosol depolarization. While spherical particles as liquid aerosols or small cloud droplets do not generate a larized signal, non-spherical (solid) ones as dust or cirrus clouds show particle depo-larization Da = (β⊥a)/(β//a)≈40−60% (e.g. Sassen, 1991; Mishchenko and Sassen, 1998; Gobbi et al., 2000). This behavior provides a powerful tool to infer the particulate
25
thermodynamic phase. In our analysis we shall employ total depolarization D rather than particle depolarization Da, since the latter becomes very unstable at low aerosol contents (small β//a). In molecular (aerosol-free) scattering conditions our system de-tected D≈1.4−2.0%.
ACPD
3, 5755–5775, 2003Vertical distribution of aerosols, Saharan
dust and cirrus clouds G. P. Gobbi and F. Barnaba Title Page Abstract Introduction Conclusions References Tables Figures J I J I Back Close
Full Screen / Esc
Print Version Interactive Discussion
We shall also discuss the vertical build-up of the optical thickness (OT) at 532 nm, ob-tained by integration over altitude (z) of the retrieved σa(z) profiles (OT (z)=
z R
0
σa(z0)d z0). To validate such results, lidar-derived OT will be compared to collocated, same wave-length sunphotometer measurements made at our Rome Tor Vergata site in the frame-work of AERONET (the NASA Aerosol Robotic Netframe-work:http://aeronet.gsfc.nasa.gov).
5
These comparisons will employ the “cloud-screened”, i.e. cloud and cirrus-free OT measurements made within 1 h from the lidar one. Expected accuracy of the sunpho-tometer OT observations is ±0.02 (e.g. Holben et al., 1998).
3. Observations
A set of 993 lidar profiles has been retrieved over 207 measurement days between
10
15 February 2001 and 14 February 2002. Average sampling rate of this record is 4.8 profiles/day. Measurements were carried-out at non-synchronous times between 7 am and 9 pm (UTC), usually spaced by 2–3 h. Here we shall discuss the cloudless portion of the observations (813 profiles gathered over 198 days), which includes PBL aerosol, Saharan dust and cirrus cloud conditions. Statistical analysis of the observations will
15
be carried out by both averaging over the whole dataset (yearly average) and over seasonal periods (i.e. December to February (DJF), March to May (MAM), June to August (JJA) and September to November (SON)). In each case, four average profiles will be provided, referring respectively to: 1) the total set of 813 observations (TOT); 2) the observations collected in no-dust conditions (ND); 3) the observations collected in
20
no-cirrus cloud conditions (NC), and 4) Saharan dust affected observations (SD), some of which including cirrus features. The synopsis of the four average profile definitions is given in Table 1.
The number of observational days and lidar profiles per aerosol category and per season is reported in Table 2. Saharan dust was detected in 20% of the 198
opera-25
con-ACPD
3, 5755–5775, 2003Vertical distribution of aerosols, Saharan
dust and cirrus clouds G. P. Gobbi and F. Barnaba Title Page Abstract Introduction Conclusions References Tables Figures J I J I Back Close
Full Screen / Esc
Print Version Interactive Discussion
ditions, was of 4.7/day (e.g. Table 2). Maximum occurrence of dust was registered in spring-summer (about 28%), with no events in winter. Due to coexistence with clouds, approximately 12 days of dust conditions have not been included in this cloud-screened statistics.
Cirrus clouds were detected in 89 days, i.e. in 45% of the operational days, with
max-5
imum and minimum incidence registered in Spring (65%) and Winter-Summer (≈30%), respectively. The lower rate of cirrus clouds observations (2.3/day) reflects the short lifetime of these layers. It is worth mentioning that a three-year (1997–1999) cirrus cloud climatology based on at night-time lidar measurements made in southern France (Goldfarb et al., 2001) shows some 30% higher averages (54% of days affected by
10
cirrus clouds), with minimum occurrence in summer (42%), and maximum occurrence in fall (60%).
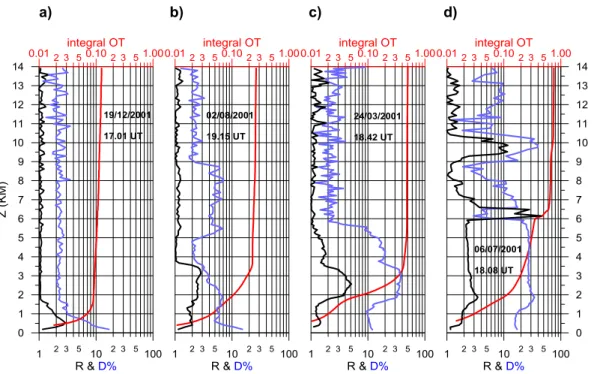
To illustrate the lidar response to various atmospheric conditions, we present in Fig. 1 four representative lidar profiles. Three curves are reported in each plot, representing respectively vertical profiles of backscatter ratio R (black line), depolarization ratio,
15
D% (blue line) and the integral (from the ground) of the extinction coefficient, i.e. the
optical thickness OT(z) (red line). Figure 1a depicts a typical winter aerosol condition, with OT≈0.1, and boundary layer aerosols confined below 2 km. Depolarization in the aerosol-free region is of the order of 2%. Conversely, Fig. 1b reports a summer case in which PBL aerosols reach up to 3.7 km, an effect due to the stronger convective mixing
20
typical of the warmer seasons. In fact, the increase in backscatter and decrease in depolarization observed at 2.8–3.5 km reveals the level of the “entrainment layer”, the region topping the PBL where stratocumulus clouds usually form (e.g. Stull, 1988). This profile also illustrates the sensitivity of the depolarization trace to the presence of non-spherical particles. In fact, at that time (19:15 UT of 2 August 2001) a Saharan
25
dust plume was reaching our site travelling between 5 and 9 km. Even if the dust load was still very low (R<1.2, σa≈0.007 km−1), the sharp increase in depolarization clearly reveals the presence of non-spherical particles.
ACPD
3, 5755–5775, 2003Vertical distribution of aerosols, Saharan
dust and cirrus clouds G. P. Gobbi and F. Barnaba Title Page Abstract Introduction Conclusions References Tables Figures J I J I Back Close
Full Screen / Esc
Print Version Interactive Discussion
in Figs. 1c and 1d, respectively. Both profiles show the correlated increase in both R and D typical of such events (R≈2−5, D≈10−45%), leading to optical depths of the order of 0.3–0.5. In addition, Fig. 1d shows the behavior of the lidar traces in the presence of liquid and frozen clouds: the sharp increase in R due to the presence of clouds is anticorrelated with respect to D in the first case (6–6.5 km) and correlated with
5
D in the cirrus case (9–10.5 km). As opposed to dust layers, clouds (including cirrus
ones) generate typical backscatter ratios R 5. These examples thus show how well the observed scattering properties can allow for a discrimination between the various particles suspended in the atmosphere.
3.1. Yearly averages
10
Annually-averaged σa, D, integral OT, and R profiles are presented in Figs. 2a, 2b, 2c and 2d, respectively. In each plot, color coding of the curves represents the TOT (blue), ND (green), NC (pale blue) and SD (red) cases, respectively (e.g. Table 1). As an indication of the variability associated to measurements, standard deviations of the dust-less (ND) mean curves are reported in the extinction and depolarization
15
plots (green error bars). In all plots, altitude is referred to mean sea level, the vertical resolution is 225 m and the first bin starts 300 m above the station level (130 m a.s.l.). In computing total OT, extinction of the lowermost 300 m is set equal to the first bin one, an assumption likely to lead to a small underestimation of this parameter.
In Figs. 2a and 2d, the dust-free (ND) annual profiles show aerosols in the lower
20
troposphere to be confined below 4 km, with 90% of the optical thickness of this layer residing below 2.5 km (Fig. 2c). Cirrus clouds formation is revealed by an increase in
σa, D, and R in the region between 6 and 14 km. Therefore, in no-dust conditions a 2 km thick particulate-free gap is found between the PBL aerosol layer and the cirrus clouds region. Conversely, yearly-average dust-affected profiles (SD) present major
25
departures from ND ones in the region 1.5–10 km. As in the cirrus case, dust is clearly revealed by an increase in σa, D, and R. In particular, a two to six-fold increase in aerosol extinction is observed between 2 and 6 km, while some increase in cirrus cloud
ACPD
3, 5755–5775, 2003Vertical distribution of aerosols, Saharan
dust and cirrus clouds G. P. Gobbi and F. Barnaba Title Page Abstract Introduction Conclusions References Tables Figures J I J I Back Close
Full Screen / Esc
Print Version Interactive Discussion
extinction is noticed between 6 and 10 km (Fig. 2a).
It is also worth noticing that, in the region 7.5–10 km, the yearly average extinction of cirrus clouds in the presence of dust (SD curve in Fig. 2a) results to be almost twice the dust-less one (ND curve). Due to the relative nature of the backscatter ratio, such an effect is even more evident when comparing the ND and SD yearly averages of R
5
(Fig. 2d). Here, the SD backscatter (∝ R−1) in the cirrus region systematically exceeds the ND one between 6 and 10 km, while being very similar above. Such increases in both extinction and backscatter are likely attributable to an increase in ice nuclei provided by dust grains, e.g. Sassen (2002). As a matter of fact, in this year dust was observed to reach up to 10 km in three events (May, June, July).
10
Total depolarization plots in Fig. 2b indicate that the impact of particles non-sphericity on radiative transfer should be always considered in the cirrus region and during dust transport events. Furthermore, all depolarization profiles show an increase in the lower PBL, revealing a meaningful presence of non-spherical (possibly soil or combustion-generated) particles over our site. Overall, the yearly average OT of tropospheric
par-15
ticulate is 0.26 (TOT profile in Fig. 2c). PBL aerosol, dust and cirrus clouds contribute to that with 0.13 (50%), 0.03 (12%) and 0.10 (38%), respectively. It is also worth notic-ing that the lower troposphere (z<6 km) aerosol optical thickness gets almost doubled during dust events.
3.2. Seasonal averages
20
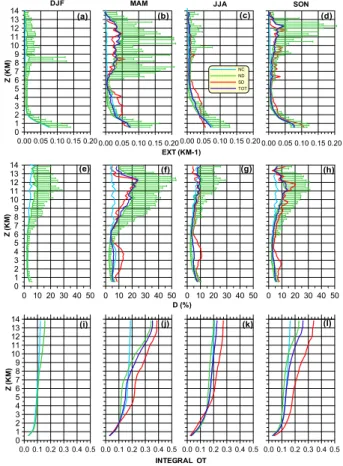
Seasonal average profiles of extinction, depolarization and integral OT are plotted in Fig. 3. Since the parameter of interest for climatic studies is extinction, backscatter ratio profiles have not been included in this figure to avoid overloading it. The winter plots (DJF, i.e. December 2001–February 2002) show no Saharan dust profiles since dust transport events did not occur during that period. Therefore, total (TOT) and
25
dust-less (ND) profiles coincide in these plots. The lowest aerosol and cirrus contents are registered in this season, with an average total optical thickness of 0.16 (Fig. 3i) and PBL extinction rapidly reducing to 0.01 km−1 (here assumed as a threshold for
ACPD
3, 5755–5775, 2003Vertical distribution of aerosols, Saharan
dust and cirrus clouds G. P. Gobbi and F. Barnaba Title Page Abstract Introduction Conclusions References Tables Figures J I J I Back Close
Full Screen / Esc
Print Version Interactive Discussion
background conditions) at 2 km (Fig. 3a). At the same time, extinction in the lower PBL reaches its maximum during this season (Fig. 3a). This is possibly due to both to RH-enhanced growth of soluble particles and to confinement of aerosols to the lower levels due to lower convection activity. Such an explanation is also supported by the minimum depolarization values recorded at low altitude (Fig. 3e). In winter, the cirrus
5
formation region extends between 8 and 13.5 km, with average OT of the order of 0.05 (Fig. 3i).
The spring (MAM) record shows both dust and cirrus maximum activity. The average total OT of 0.35 (Fig. 3j) is made-up by the contributions of PBL aerosols (0.13), dust (0.05) and cirrus (0.17). Figure 3b shows the dust extinction (SD curve) to substantially
10
exceed the ND profile in the region 1.5–5 km. This translates into a strong impact of dust on the total spring extinction profile (TOT). In fact, while the ND extinction profile crosses the 0.01 km−1 value at 2.8 km, the TOT one crosses it at 4.8 km. As can be observed in Fig. 3f, all the way up to 5.5 km dust depolarization is consistently larger than in the ND case, indicating a dominance of non-spherical particles in this region.
15
A similar effect is found in the cirrus region, now extending between 6.5 and 13.5 km. Summer (JJA) conditions show a marked lifting of the PBL aerosol upper boundary and an increase in its OT, likely associated to a stronger convection. The threshold extinction value of 0.01 km−1 is now crossed at 3.8 km (ND curve in Fig. 3c) and PBL aerosol OT reaches maximum values of 0.16, as opposed to the winter minimum of
20
0.08 (e.g. Figs. 3k and 2i). Nonetheless, a low cirrus activity leads to a total OT of 0.22, i.e. smaller than the spring (0.35) and fall (0.26) ones. In this season, the cirrus contribution (0.03) to the total OT is of 13% (Fig. 3k), the lowest in the record. Figure 3c shows an evident impact of dust on the extinction profile between 2 and 6 km, with a contribution of 0.03 to the total OT. Conversely, the dust (SD) extinction profile in the
25
PBL below 1.7 km is systematically lower than the no-dust (ND) one. This effect (also visible in the MAM case), is possibly due to the warming and consequent stabilization of the PBL air characterizing Saharan events. In no-dust (ND) conditions, depolarization in the lower PBL (Fig. 3g) reaches the maximum value of the year (7%), as opposed
ACPD
3, 5755–5775, 2003Vertical distribution of aerosols, Saharan
dust and cirrus clouds G. P. Gobbi and F. Barnaba Title Page Abstract Introduction Conclusions References Tables Figures J I J I Back Close
Full Screen / Esc
Print Version Interactive Discussion
to minimum winter values of 4% (Fig. 3e). This behavior suggests both a stronger presence of crustal aerosols and a smaller RH-driven growth of soluble particles.
Similarly to spring, the fall (SON) record presents Saharan dust advection and strong cirrus activity. The ND and the TOT extinction profiles cross the 0.01 km−1value at 2.5 and 3.5 km, respectively. The dust (SD) contribution to total extinction clearly exceeds
5
the ND profile in the region 0.5–5 km (Fig. 3d), i.e. in this season dust has a meaningful impact on the lower PBL too. With respect to the other seasons, the dust depolarization profile (SD in Fig. 3h) shows a lowering of the dust layer top and a systematic exceeding of the ND profile up to 10 km. The average total optical depth of 0.26 (Fig. 3l) is made-up by the sum of PBL aerosols (0.12), dust (0.03) and cirrus (0.11) contributions. In
10
this season, cirrus clouds reside in the region 6–13.5 km, representing 42% of total OT (Fig. 3l).
A summary of the yearly and seasonal average optical thickness OT is reported in Table 3. In this table we separated the contribution of boundary layer aerosols (PBL), Saharan dust particles (SD) and cirrus clouds (CIR) to the total (TOT) optical thickness.
15
This partitioning allows to compare the lidar-derived aerosol contribution (i.e. PBL+SD) to the AERONET optical thickness measurements, which are screened to exclude both cloud and cirrus conditions. For this purpose, AERONET yearly and seasonal average OT for our site (Rome Tor Vergata) are also included in Table 3.
Overall, the comparison between lidar and sunphotometer aerosol OT is rather good
20
and observations fall well within the retrievals typical errors of 35% and ±0.02, re-spectively. As expected, some systematic underestimation, on average 0.02, charac-terizes the lidar retrievals. This represents a departure of 11% from the OT yearly mean of 0.18. As discussed in Sect. 3, this is likely due to the assumption of an aerosol extinction coefficient for the lowermost 300 m equal to the one of the above
25
layer (z = 300−525 m). However, the fall season presents a larger underestimation of 0.06. In this case, even if the sunphotometer mean OT= 0.21 falls at the positive end of the lidar-derived OT range (0.15±35%), we suspect such an above-average di ffer-ence to be also due to a non-perfect cirrus-screening of the AERONET record. In fact,
ACPD
3, 5755–5775, 2003Vertical distribution of aerosols, Saharan
dust and cirrus clouds G. P. Gobbi and F. Barnaba Title Page Abstract Introduction Conclusions References Tables Figures J I J I Back Close
Full Screen / Esc
Print Version Interactive Discussion
autumn was characterized by thinner, i.e. less detectable cirrus clouds with respect to spring 2001 (e.g. Fig. 3).
4. Conclusions
One year (February 2001–February 2002) of lidar observations of tropospheric aerosols and cirrus clouds over Rome (Italy) has been presented and discussed. This
5
record represents one of the few yearly climatologies of tropospheric profiles available in the scientific literature. With the exception of winter months, Saharan dust was found to represent an optically meaningful layer affecting the region between 1.5 and 6 km, i.e. between PBL aerosols and cirrus clouds. Considered the ubiquitous transport of Saharan dust (e.g. Moulin et al., 1998), we expect this behavior to be rather common
10
to the troposphere of Mediterranean regions. Saharan dust was detected in 20% of the 198 operational days (25% if considering cloudy ones as well), with maximum fre-quency in spring-summer 2001 (about 28%) and no events in winter. On a yearly basis dust accounted for 19% of the aerosol (cirrus-less) optical thickness. During the spring and fall dust events this contribution rose to 50%.
15
Lower troposphere (PBL) aerosol OT was maximum in summer (0.16), and mini-mized in winter (0.08). Most of this aerosol was confined below 3.8 and 2 km, respec-tively. Doubled depolarization values observed in the summer PBL, indicate a stronger impact on radiation of non-spherical particles with respect to winter. Cirrus clouds were detected in 45% of the operational days. Maximum and minimum incidence was
regis-20
tered in spring (65%) and winter-summer (30%), respectively. On the yearly average, cirrus and PBL aerosol contributions to OT were comparable. Presence of dust was highly correlated with enhanced cirrus cloud extinction in the region 6-10 km.
With the exception of winter months, these observations indicate a strong presence of non- spherical particulate matter at all tropospheric altitudes. This should be taken
25
into account in both retrievals of aerosol properties performed by means of optical tech-niques and in the definition of the radiative properties of particulate matter suspended
ACPD
3, 5755–5775, 2003Vertical distribution of aerosols, Saharan
dust and cirrus clouds G. P. Gobbi and F. Barnaba Title Page Abstract Introduction Conclusions References Tables Figures J I J I Back Close
Full Screen / Esc
Print Version Interactive Discussion
in the Earth atmosphere.
Acknowledgements. Part of this work has been carried out under the Italian Space Agency
contract ASI/INFM “GASTRAN”.
References
Balis, D., Papayannis, A., Galani, E., Marenco, F., Santacesaria, V., Hamonou, E., Chazette, P.,
5
Ziomas, I., and Zerefos, C.: Tropospheric Lidar aerosol measurements and sun photometric observations at Thessaloniki, Greece, Atmos. Env., 34, 925–932, 2000.
Barnaba, F. and Gobbi, G. P.: Lidar estimation of tropospheric aerosol extinction, surface area and volume: Maritime and desert-dust cases, J. Geophys. Res., 106, D3, 3005–3018, 2001. (Correction in J. Geophys. Res., doi: 10.1029/2002JD002340, 2002).
10
Barnaba, F. and Gobbi, G. P.: Modeling the aerosol extinction versus backscatter relationship for lidar applications: maritime and continental conditions, J. Atmosph. Ocean. Techn., ac-cepted, 2003.
Duce, R. A., Unni, C. K., Ray, B. J., Prospero, J. M., and Merrill, J. T.: Long range transport of soil dust from Asia to tropical North Pacific: Temporal variability, Science, 209, 1522–1524,
15
1980.
Del Guasta, M.: Daily cicles in urban aerosols observed in Florence (Italy) by means of an automatic 532–1064 nm Lidar, Atmos. Env., 36, 2853–2865, 2002.
De Tomasi, F. and Perrone, M. R.: Lidar measurements of tropospheric water vapor and aerosol profiles over southeastern Italy, J. Geophys. Res., 108, D9, 10.1029/2002JD002781, 2003.
20
Gasso, S., Hegg, D. A., Covert, D. S., Collins, D., Noone, K. J., Ostrom, E., Schmid, B., Russell, P. B., Livingston, J. M., Durkee, P. A., and Jonsson, H.: Influence of humidity on the aerosol scattering coefficient and its effect on the upwelling radiance during ACE 2, Tellus, 52B, 546–567, 2000.
Gobbi, G. P., Barnaba, F., Giorgi, R., and Santacasa, A.: Altitude-resolved properties of a
25
Saharan-Dust event over the Mediterranean, Atmospheric Environment, 34, 5119–5127, 2000.
Gobbi, G. P., Barnaba, F., Blumthaler, M., Labow, G., and Herman, J.: Observed effects of particles non-sphericity on the retrieval of marine and desert-dust aerosol optical depth by lidar, Atmospheric Research, 61, 1–14, 2002.
ACPD
3, 5755–5775, 2003Vertical distribution of aerosols, Saharan
dust and cirrus clouds G. P. Gobbi and F. Barnaba Title Page Abstract Introduction Conclusions References Tables Figures J I J I Back Close
Full Screen / Esc
Print Version Interactive Discussion
Gobbi, G. P.: Lidar estimation of stratospheric aerosol properties: Surface, volume, and extinc-tion to backscatter ratio, J. Geophys. Res., 100, 11 219–11 235, 1995.
Goldfarb, L., Keckhut, P., Chanin, M. L., and Hauchecorne, A.: Cirrus climatological results from lidar measurements at OHP (44◦N–6◦E), Geophys. Res. Lett., 28, 9, 1687–1690, 2001. Hofmann, D. J.: Twenty years of balloon-borne tropospheric aerosol measurements at Laramie,
5
Wyoming, J. Geophys. Res., 98, 12 753–12 766, 1993.
Holben, B. N., Eck, T. F., Slutsker, I., Tanre, D., Buis, J. P., Setzer, A., Vermote, E., Reagan, J. A., Kaufman, Y., Nakajima, T., Lavenu, F., Jankowiak, I., and Smirnov, A.: AERONET – A federated instrument network and data archive for aerosol characterization, Remote Sensing Environment, 66, 1–16, 1998.
10
Jaenicke, R.: Nucleation and atmospheric aerosol, edited by Fukuta, N. and Wagner, P. E., Deepak Publ., Hampton, Virginia, 417, 1992.
Kent, G. S., McCormick, M. P., and Schaffner, S. K.: Global optical climatology of the free tropospheric aerosol from 1.0 µm satellite occultation measurements, J. Geophys. Res., 96, D3, 5249–5267, 1991.
15
Matthias, V. and Bosenberg, J.: Aerosol climatology for the planetary boundary layer derived from regular lidar measurements, Atmos. Res., 63, 221–245, 2002.
Measures, R. M.: Laser Remote Sensing, J. Wiley, New York, 1984.
Mishchenko, M. I. and Sassen, K.: Depolarization of lidar returns by small ice crystals: An application to contrails, Geophys. Res. Lett., 25, 3, 309–312,1998.
20
Moulin, C., Lambert, C. E., Dayan, U., Masson, V., Ramonet, M., Bousquet, P., Legrand, M., Balkanski, Y. J., Guelle, W., Marticorena, B., Bergametti, G., and Dulac, F.: Satellite clima-tology of African dust transport in the Mediterranean atmosphere, J. Geophys. Res., 103, 13 137–13 144, 1998.
Muller, D., Mattis, I., Wandinger, U., Ansmann, A., and Althausen, D.: Saharan dust over a
25
central European EARLINET-AERONET site: Combined observations with Raman lidar and sun photometer, J. Geophys. Res., 108, D12, 4345, doi:10.1029/2002JD002918, 2003. Murayama, T., Sugimoto, N., Uno, I., Kinoshita, K., Aoki, K., Hagiwara, N., Liu, Z., Matsui, I.,
Sakai, T., Shibata, T., Arao, K., Sohn, B., Won, J., Yoon, S., Li, T., Zhou, J., Hu, H., Abo, M., Iokibe, K., Koga, R., and Iwasaka, Y.: Ground-based network observation of Asian dust
30
events of April 1998 in east Asia, J. Geophys. Res., 106, D16, 18 345–18 360, 2001.
Penner, J. E., Andreae, M., Annegarn, H., Barrie, L., Feichter, J., Hegg, D., Jayaraman, A., Leaitch, R., Murphy, D., Nganga, J., and Pitari, G.: Aerosols, their Direct and Indirect Effects,
ACPD
3, 5755–5775, 2003Vertical distribution of aerosols, Saharan
dust and cirrus clouds G. P. Gobbi and F. Barnaba Title Page Abstract Introduction Conclusions References Tables Figures J I J I Back Close
Full Screen / Esc
Print Version Interactive Discussion
in Climate Change 2001: The Scientific Basis, Cambridge University Press, Cambridge, UK, 2001.
Prospero, J. M., Glaccum, R. A., and Nees, R. T.: Atmospheric transport of soil dust from Africa to South America, Nature, 289, 570–572, 1983.
Prospero, J. M., Ginoux, P., Torres, O., Nicholson, S. E., and Gill, T. E.: Environmental
char-5
acterization of global sources of atmospheric soil dust identified with the Nimbus 7 total ozone mapping spectrometer (TOMS) absorbing aerosol product, Rev. Geophys., 40, 1, 1002, doi:10.1029/2000RG000095, 2002.
Ramanathan, V., Crutzen, P. J., Kiehl, J. T., and Rosenfeld, D.: Aerosols, Climate, and the Hydrological Cycle, Science, 294, 2119–2124, 2001.
10
Russell, P. B., Swissler, T. J., and M. P. McCormick: Methodology for error analysis and simu-lation of lidar aerosol measurements, Appl. Opt., 18, 3783–3797, 1979.
Sakai, T., Shibata, T., Kwon, S., Kim, Y., Tamura, K., and Iwasaka, Y.: Free tropospheric aerosol backscatter, depolarization ratio, and relative humidity measured with the Raman lidar at Nagoya in 1994–1997: contributions of aerosols from the Asian continent and the Pacific
15
ocean, Atmos. Env., 34, 431–442, 2000.
Sassen, K.: The polarization lidar technique for cloud research: A review and current assess-ment, Bull. Am. Met. Soc., 72, 1848–1866, 1991.
Sassen, K: Indirect climate forcing over the western US from Asian dust storms, Geophys. Res. Lett., 29, 10, 10.1029/2001GL014051, 2002.
20
Schneider, J. and Eixmann, R.: Three years of routine Raman lidar measurements of tropo-spheric aerosols: Backscattering, extinction and residual layer height, Atmotropo-spheric Chem-istry and Physics, 2, 313–323, 2002.
Stull, R. B.: An introduction to boundary layer meteorology, Kluwer Acad. Publ., Dordrecht, 666, 1988.
ACPD
3, 5755–5775, 2003Vertical distribution of aerosols, Saharan
dust and cirrus clouds G. P. Gobbi and F. Barnaba Title Page Abstract Introduction Conclusions References Tables Figures J I J I Back Close
Full Screen / Esc
Print Version Interactive Discussion Table 1. Synopsis of the four average profiles discussed in the paper.
Label Definition Curve color # profiles
TOT All profiles blue 813
ND No Saharan dust-affected profiles green 630 NC No cirrus-affected profiles pale blue 611 SD Saharan dust-affected profiles red 183
ACPD
3, 5755–5775, 2003Vertical distribution of aerosols, Saharan
dust and cirrus clouds G. P. Gobbi and F. Barnaba Title Page Abstract Introduction Conclusions References Tables Figures J I J I Back Close
Full Screen / Esc
Print Version Interactive Discussion Table 2. Number of observational days (OD) and analyzed lidar profiles (LP, in brackets),
classified by period of measurement and particulate type. The PBL aerosol case includes dust-less and cirrus-dust-less profiles only. The ND and NC cases can be computed as TOT-Dust and TOT-Cirrus, respectively.
Condition YEAR DJF MAM JJA SON
OD (LP) OD (LP) OD (LP) OD (LP) OD (LP) Cloudless (TOT) 198 (813) 45 (145) 52 (193) 45 (232) 56 (243) PBL aerosol 163 (428) 39 (122) 34 (49) 41 (140) 49 (117) Dust (SD) 39 (183) 0 (0) 15 (57) 12 (65) 12 (61)
ACPD
3, 5755–5775, 2003Vertical distribution of aerosols, Saharan
dust and cirrus clouds G. P. Gobbi and F. Barnaba Title Page Abstract Introduction Conclusions References Tables Figures J I J I Back Close
Full Screen / Esc
Print Version Interactive Discussion Table 3. Contributions of lower troposphere aerosol (PBL), Saharan dust (SD) and cirrus clouds
(CIR) to the total optical thickness of the 0–14 km region (TOT) in the yearly and seasonal analysis. Aerosol (i.e. PBL+ SD) optical thickness is reported as AEROSOL for comparisons with coincidental AERONET sunphotometer (cloud and cirrus-screened data) measurements. Expected typical error is ±35% for the lidar retrievals and ±0.02 for the sunphotometer data.
Class Year DJF MAM JJA SON PBL 0.13 0.11 0.13 0.16 0.12 SD 0.03 0.00 0.05 0.03 0.03 CIR 0.10 0.05 0.17 0.03 0.11 TOT 0.26 0.16 0.35 0.22 0.26 AEROSOL (PBL+ SD) 0.16 0.11 0.18 0.19 0.15 AERONET 0.18 0.14 0.17 0.22 0.21
ACPD
3, 5755–5775, 2003Vertical distribution of aerosols, Saharan
dust and cirrus clouds G. P. Gobbi and F. Barnaba Title Page Abstract Introduction Conclusions References Tables Figures J I J I Back Close
Full Screen / Esc
Print Version Interactive Discussion © EGU 2003 a) b) c) d) 2 3 5 2 3 5 1 10 100 R & D% 0 1 2 3 4 5 6 7 8 9 10 11 12 13 14 Z ( K M) 2 3 5 2 3 5 1 10 100 R & D% 2 3 5 2 3 5 1 10 100 R & D% 0 1 2 3 4 5 6 7 8 9 10 11 12 13 14 2 3 5 2 3 5 1 10 100 R & D% 2 3 5 2 3 5
0.01 integral OT0.10 1.000.012 3 5integral OT0.102 3 51.000.012 3 5integral OT0.102 3 51.000.012 3 5integral OT0.102 3 51.00
19/12/2001 17.01 UT 02/08/2001 19.15 UT 06/07/2001 18.08 UT 24/03/2001 18.42 UT
Fig. 1. Typical lidar profiles (at 532 nm) representative of: (a) clear winter conditions; (b)
summer PBL aerosol and pre-dust conditions;(c) spring dust conditions, and (d) summer dust,
liquid cloud and cirrus cloud conditions. The three curves reported in each plot represent vertical profiles of backscatter ratio R (black line), depolarization ratio D% (blue line), and (red line) the integral (from the ground) of the extinction coefficient, i.e. OT(z), respectively.
ACPD
3, 5755–5775, 2003Vertical distribution of aerosols, Saharan
dust and cirrus clouds G. P. Gobbi and F. Barnaba Title Page Abstract Introduction Conclusions References Tables Figures J I J I Back Close
Full Screen / Esc
Print Version Interactive Discussion © EGU 2003 0 10 20 30 40 50 D (%) 0.00 0.05 0.10 0.15 EXT (KM-1) 0 1 2 3 4 5 6 7 8 9 10 11 12 13 14 Z ( K M ) NC ND SD TOT 0.0 0.1 0.2 0.3 0.4 0.5 INTEGRAL OT (b) (c) (a) 0 1 2 3 4 5 6 7 R (d)
Fig. 2. Yearly average profiles (at 532 nm) of: (a) extinction σa; (b) depolarization ratio D, (c)
integral optical thickness OT(z) and(d) backscatter ratio R. Curve colors represent the total
TOT (blue), no-dust ND (green), no-cirrus NC (pale blue) and Saharan dust SD (red) records, respectively (e.g. Table 1 for synopsis). Standard deviations associated to the ND mean curves are reported for both σaand D profiles.
ACPD
3, 5755–5775, 2003Vertical distribution of aerosols, Saharan
dust and cirrus clouds G. P. Gobbi and F. Barnaba Title Page Abstract Introduction Conclusions References Tables Figures J I J I Back Close
Full Screen / Esc
Print Version Interactive Discussion 0 10 20 30 40 50 D (%) 0.0 0.1 0.2 0.3 0.4 0.5 0 1 2 3 4 5 6 7 8 9 10 11 12 13 14 Z ( K M ) 0.00 0.05 0.10 0.15 0.20 0 1 2 3 4 5 6 7 8 9 10 11 12 13 14 Z ( K M ) 0.00 0.05 0.10 0.15 0.20 EXT (KM-1) 0.00 0.05 0.10 0.15 0.20 NC ND SD TOT 0.00 0.05 0.10 0.15 0.20
DJF MAM JJA SON
0 10 20 30 40 50 0 1 2 3 4 5 6 7 8 9 10 11 12 13 14 Z ( K M ) 0 10 20 30 40 50 0 10 20 30 40 50 0.0 0.1 0.2 0.3 0.4 0.5 INTEGRAL OT 0.0 0.1 0.2 0.3 0.4 0.5 0.0 0.1 0.2 0.3 0.4 0.5 (a) (b) (c) (d) (e) (f) (g) (h) (i) (j) (k) (l)
Fig. 3. Seasonal (columns) average profiles of 532 nm extinction σa (first row), depolarization
ratio D (second row) and integral optical thickness OT (third row). Curve colors represent the TOT (blue), ND (green), NC (pale blue) and SD (red) records, respectively (e.g. Table 1 for synopsis). Standard deviations associated to the ND mean curves are reported for both σaand