Publisher’s version / Version de l'éditeur:
Vous avez des questions? Nous pouvons vous aider. Pour communiquer directement avec un auteur, consultez la
première page de la revue dans laquelle son article a été publié afin de trouver ses coordonnées. Si vous n’arrivez pas à les repérer, communiquez avec nous à [email protected].
Questions? Contact the NRC Publications Archive team at
[email protected]. If you wish to email the authors directly, please see the first page of the publication for their contact information.
https://publications-cnrc.canada.ca/fra/droits
L’accès à ce site Web et l’utilisation de son contenu sont assujettis aux conditions présentées dans le site LISEZ CES CONDITIONS ATTENTIVEMENT AVANT D’UTILISER CE SITE WEB.
6th International Symposium on Radiative Transfer [Proceedings], 2010-06-19
READ THESE TERMS AND CONDITIONS CAREFULLY BEFORE USING THIS WEBSITE. https://nrc-publications.canada.ca/eng/copyright
NRC Publications Archive Record / Notice des Archives des publications du CNRC :
https://nrc-publications.canada.ca/eng/view/object/?id=21ac8e81-ac07-4305-998f-71cd53193823 https://publications-cnrc.canada.ca/fra/voir/objet/?id=21ac8e81-ac07-4305-998f-71cd53193823
NRC Publications Archive
Archives des publications du CNRC
This publication could be one of several versions: author’s original, accepted manuscript or the publisher’s version. / La version de cette publication peut être l’une des suivantes : la version prépublication de l’auteur, la version acceptée du manuscrit ou la version de l’éditeur.
Access and use of this website and the material on it are subject to the Terms and Conditions set forth at
Comparison of Two Statistical Narrow Band Models for Non-grey Gas Radiation in Planar Plates
COMPARISON OF TWO STATISTICAL NARROW BAND MODELS FOR NON-GRAY GAS RADIATION IN PLANAR PLATES
Huaqiang Chu 1, Qiang Cheng 1, Huaichun Zhou 1, and Fengshan Liu 2
1 State Key Laboratory of Coal Combustion, Huazhong University of Science and Technology,
Wuhan, 430074, Hubei, P. R. China
2 Institute for Chemical Process and Environmental Technology, National Research Council,
Montreal Road, Ottawa, Ont., Canada K1A 0R6
ABSTRACT. Non-gray gas radiation analysis and comparison are conducted by combining a ray tracing method and two statistical narrow band (SNB) spectral models, namely the Goody SNB model and the Malkmus SNB model. In this paper, gas radiation in real gas containing H2O,
H2O/N2, or H2O/CO2/N2 mixtures at 1 atm in planar plates was studied. Comparisons between these
models are performed using the latest narrow-band database. The present computations are validated by reproducing the published results in the literature. The radiative source term, the wall fluxes, the narrow-band radiation intensities along a line-of-sight and the computing time are all compared. From the comparisons, it is found that the Malkmus SNB model is somewhat superior to the Goody SNB model and the former is preferred in engineering application.
NOMENCLATURE
f species molar fraction I radiation intensity / 2
W m sr
v
I spectral radiation intensity
/ 2 1
W m ⋅ ⋅sr cm−
v
k mean line-intensity to spacing ratio
1 1
cm− ⋅atm−
v
k
equivalent mean line-intensity to spacing ratio 1 1
cm− ⋅atm−
L separation distance between parallel
walls m
p pressure atm
q heat flux density kW m/ 2
'
,
s s position variables m x Cartesian coordinates m Greek symbols
mean line-width to spacing ratio v
β
v
γ
mean half-width of an absorption line
1
cm−
equivalent line spacing cm v δ −1 v wavenumber interval cm −1 Δ ν wavenumber 1 cm− μ direction cosines spectral transmittance ν τ Subscripts b i n w blackbody
spatial discretization (along a line of sight) index
angular discretization index wall
INTRODUCTION
Radiative transfer plays a key role in high temperature equipment or processes such as boilers, industrial furnaces, and combustors. Accurate analysis of those radiation problems is closely linked with the radiative properties of gases because of the existence of water vapor, carbon dioxide, carbon monoxide or a mixture of these gases in these problems. The radiative properties of these
gases exhibit very strong spectral dependence in the near-infrared region at temperatures relevant to combustion. The grey gas assumption, however, is often made in fundamental and applied combustion and flame studies. In many practical applications, it has been well established that the commonly used grey gas model for systems containing combustion gas cannot provide reliable predictions [1,2]. Thus, we must consider the non-grey radiation properties of real gases.
The complex spectral dependence of the gas radiation makes the determination of spectral radiation properties very difficult. However, significant progress has been made in the development of the spectral models. Nowadays, there are many methods or models to describe the non-grey radiative properties of gases. These approximate methods may be loosely put into four groups as described by Modest [2]: Line by Line (LBL) model, narrow band models, wide band models, and global models.
The radiative heat transfer in absorbing-emitting gas mixtures can be most accurately predicted by the LBL approach, but this model requires large computer resources and computational time and relies on the High Resolution Transmission Molecular Database (HITRAN) [3] and its extension HITEMP [4]. At present, LBL models are used only for benchmark solutions to validate the approximate methods. The SNB model, one of the narrow band models, can lead to results that agree closely with LBL model with good accuracy. The exponential wide band model (EWB), proposed by Edwards and Balakhrisnan [5], is the most celebrated wide-band model. The weighted-sum-of-grey-gases (WSGG) model, originally introduced by Hottel and Sarofim [6], is a representative of the global models, especially after the work of Modest [7] who pointed out that this model could be used with any radiative transfer equation (RTE) solver. Song [2] proposed a modification of the WSGG model by explicitly specifying the spectral region occupied by each grey gas. As is shown by Soufim and Djavdan [8], the WSGG model yields poor accuracy with a low computation time. Based on the conventional WSGG model, Denison and Webb [9] developed the spectral line-based weighted-sum-of-grey-gases (SLW) to overcome the shortcomings of the conventional WSGG model. More recently, Modest and Zhang [10] proposed a full-spectrum k-distribution (FSK) model. Although the last two models (SLW and FSK) still belong to global models, they can produce fairly accurate results provided the reference temperature is carefully selected for the problem at hand.
In the last ten years, the SNB models have received renewed attention due to the rapid development in computers and interest for accurate analyses of radiation. There are two well known SNB models: the Goody SNB model and the Malkmus SNB model. Both models are based on the hypothesis that the positioning of independent lines within subdivisions of the infrared spectrum is random with a Lorentz profile. However, an exponential-tailed line intensity distribution was adopted by Goody [11] while Malkmus [12] used an exponential-tailed inverse distribution. With the Goody SNB model, Grosshandler [13] developed RADCAL code which has been used for the estimation of the WSGG parameters. Non-grey gas radiation analyses were conducted using the Malkmus SNB model by Kim et al. [14], Liu and Tiwari [15], and Liu et al. (1998) [16]. Most narrow-band k-distribution methods employed the analytical cumulative k-distribution function derived by Lacis and Oinas [17] based upon the Malkmus SNB model, with band parameters from the EM2C database by Soufiani and Taine [18]. A band lumping strategy was developed by Liu et al. (2002) [19] using the SNBCK method to improve its efficiency. Because of its accuracy and improved efficiency, the SNBCK method enjoys considerable popularity in the estimation of gas radiation.
In order to analyze radiative heat transfer, many numerical methods have been developed to solve RTE, examples being the discrete ordinate method (DOM) and the Monte Carlo Method (MCM). These methods have both advantages and disadvantages, so readers should choose suitable methods according to their problems. Detailed descriptions of these methods are available in the literature, e.g. Modest [1] and Siegal and Howell [20]. The ray-tracing method along with the SNB models
was employed by Liu et al. (1998) [16] and Marakis [21]. In the present work, it was used to solve the RTE.
This study concerns non-grey gas radiation in parallel plates using the Goody SNB model and the Malkmus SNB model. Although a similar work was conducted by Marakis [21] using out-of-date narrow-band databases for H2O, the present study employed the latest available narrow-band
database, Soufiani and Taine [18], and considered mixtures containing H2O and CO2. In addition,
we also compared spectrally resolved radiation intensities from the two SNB models.
NON-GRAY GAS RADIATION METHODS
Narrow band Formulation The spectral RTE for an absorbing, emitting, but non-scattering medium can be written as given by Siegel and Howell [20]
v av v av bv I I I s κ κ ∂ = − + ∂ (1) The corresponding boundary spectral radiation intensity at a diffuse wall is given as
ˆ (1 ) ˆ ( , ) wv ( , ) v w wv bwv n v w I s ε I ε n I s d π ⋅Ω′ − ′ ′ Ω = +
∫
⋅Ω Ω Ω′ , for nˆ⋅Ω >′ 0 (2) According to Kim et al. [14], we can obtain the narrow band averaged RTE, in terms of transmissivity, as[
]
( , ) ( ) ( ) ( ) ( , ) ( ( ) + ( ) ( ) w v w v s s bv wv w v w s v bv s I s s s ) I s I s s s s s s s s I s ds s s τ τ τ ′= ′ ∂ Ω ∂ → ∂ = + Ω ′ ∂ ∂ ∂ ′ ∂ → ∂ ′ ′ ′ ∂ ∂∫
→ (3)Along a line of sight, the discretized form of Eq. (3) is given by Kim et al. [14] as
Iv n i, , 1+ =Iv n i, , + −(1 τv n i, ,→ +i 1)Ibv i, 1 2+ +Cv n i, , 1 2+ (4) where 1 , , 1 2 , ,1 , ,1 1 , ,1 , , 1 1 , , 1 1 , , 1 , , , 1 2 ( ) [( ( )] i v n i wv n v n i v n i v n k i v n k i k v n k i v n k i bv k C I I τ τ τ τ τ τ − + → + → + → + = → + → + = − + − − −
∑
+ →) (5)The boundary condition for Eq. (4) has the same expression as that given in Eq. (2).
After the spectral radiation intensity is calculated, the total (spectrally integrated) net radiative flux can be obtained from the relation
, , 1 ( ) ( ) N i v n i all v n q x μI w v Δ = n =
∑ ∑
Δ (6) The radiative source term or the divergence of heat flux, −dq dx/ , of this one-dimensional problem in the medium is then given by1 1 i i i q q dq dx x x + + i − − = − − (7)
SNB models For an isothermal and homogeneous path-length at total pressure and molar fraction
L p
f , the narrow band averaged transmittance is given by the Goody SNB model and the
Malkmus SNB model (Ludwig et al. [22]) as, respectively,
( )
exp 1 Gv SL L SL B τ π ⎡ ⎤ = ⎢− + ⎥ ⎣ ⎦ (8) and( )
exp 1 4 1 2 Mv B SL L B π τ π ⎡ ⎛ ⎞⎤ = ⎢− ⎜⎜ + − ⎟⎟⎥ ⎢ ⎝ ⎠⎥ ⎣ ⎦ (9)where L is the optical length,B=2β πv 2,S =k fpv , and βv =2πγ δv v . The mean narrow band parameters γv ,δ and v kv for H2O and CO2 have been given by Ludwig et al. [22] and Soufiani et al. [23], but these databases are out-of-date and may yield inaccurate results. More recently, an updated data set of these parameters has been made available by Soufiani and Taine [18] for CO2,
H2O and CO for the much wider temperature range of 300 to 2900 K. The bandwidth is 25 cm-1 for
wave numbers between 150 and 9300 cm-1. H2O absorbs and emits radiation at all of the 367
narrow-bands while CO2 has 96 radiating bands in the following four spectral regions: 450 to 1200
cm-1 (31bands), 1950 to 2450 cm-1 (21 bands), 3300 to 3800 cm-1 (21bands), and 4700 to 5250 cm-1 (23 bands) (Liu et al. (2000) [24]). Further details of this data set can be found in Soufiani and Taine [18].
For a non-isothermal and/or inhomogeneous path, the Curtis-Godson approximation [25] is commonly used to obtain equivalent band parameters. Equivalent band parameters kvandβv are given by averaging andk βover the optical path Uof the column as
0 l U =
∫
pxds (10) 0 1 l eq k px U =∫
kds (11) 0 1 l eq pxk ds U β =∫
β (12) Following Kim et al. [14], the overlapping band is treated as a new band.RESULTS AND DISCUSSION
In order to compare the two SNB models, four different cases for the concentration and temperature distributions between two infinite planar plates are tested. Three problems for H2O/N2 mixture were
first employed by Kim et al. [14] and the last one was calculated by Liu et al. (2000) [24] using the SNB-CK model for a H2O/CO2/N2 mixture. In the four cases, the wall surfaces were assumed to be
black and the medium was at a uniform total pressure of 1 atm. The same spatial and angular discretizations have been adopted for all the test cases. The planar geometry was subdivided into 20 sublayers and the polar angle into 20 intervals. The physical explanation for the four cases were given in Kim et al. [14], Liu et al. (1998) [16], and Liu et al. (2000) [24]. Reference results for the problems presented are those given in Kim et al. [14], Liu et al. (1998) [16], and Liu et al. (2000) [24].
Isothermal homogeneous medium (Case 1) In the first case, the two walls were held at 0 K. The medium between the two planar plates is filled with 100 percent water vapor at a uniform temperature of 1000 K. Two wall separation distances, of 0.1 m and 1 m, were used.
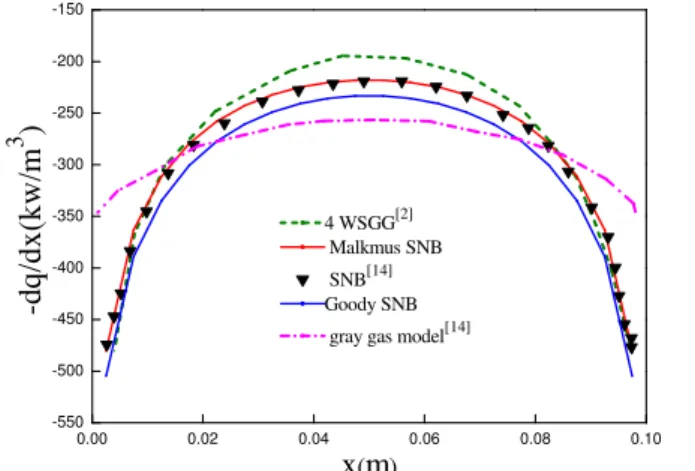
Figures 1 and 2 show the predicted radiative source distributions using the Goody and the Malkmus SNB models for the two different separation distances. The discrepancies between the results obtained from the two SNB models are found to be large for the smaller separation distance of 0.1 m; while the predictions are in better agreement with each other for the larger separation distance of 1 m. In these figures, the WSGG model was that developed by Song [2] based on the EWB model (Edwards and Balakrishnan [5]), while the SNB model and the grey gas model were adopted by Kim et al. [14].The WSGG model also gives reasonable results, whereas the results of the gray gas model are far off from the reference solution (Kim et al. [14]). Note that the results of the Malkmus SNB model are in excellent agreement with those of the reference solution for both optical lengths. The magnitude of the heat source becomes smaller as the optical thickness of the medium increases.
0.00 0.02 0.04 0.06 0.08 0.10 -550 -500 -450 -400 -350 -300 -250 -200 -150 -d q/dx(kw/ m 3 ) x(m) 4 WSGG[2] Malkmus SNB SNB[14] Goody SNB
gray gas model[14]
0.0 0.2 0.4 0.6 0.8 1.0 -250 -200 -150 -100 -50 0 -dq/dx(kw/m 3) x(m) SNB[14] 4 WSGG[2] Goody SNB Malkmus SNB
gray gas model[14]
Figure 1 Distributions of the radiative source term for the homogeneous and isothermal case with the separation distance of 0.1 m (Case 1).
Figure 2 Distributions of the radiative source term for the homogeneous and isothermal case with the separation distance of 1 m (Case 1).
Isothermal inhomogeneous medium (Case 2) For this case, the gas is maintained at a uniform temperature of 1000 K, but the medium is a non-uniform mixture of H2O/N2 with a parabolic H2O
concentration profile given by
2 4(1 ) H O
f = −x L x L the separation distance is 1 m.
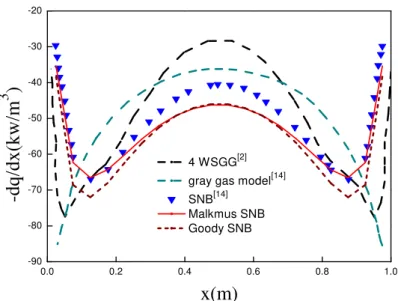
Figure 3 presents the results of the source term from different gas models. The Goody SNB model result does not show significant difference from that of the Malkmus SNB model in the middle of the medium or close to the walls. However, there are relatively large differences around the two minima. The W-shaped profile of the source term is well captured by the two SNB models. The predictions of the WSGG model and the gray gas model are much worse than those of the two SNB models, especially for the gray gas model which even fails to capture the W-shaped distribution.
0.0 0.2 0.4 0.6 0.8 1.0 -90 -80 -70 -60 -50 -40 -30 -20 -dq/dx(kw/m 3 ) x(m) 4 WSGG[2] gray gas model[14] SNB[14]
Malkmus SNB Goody SNB
Figure 3 Distributions of the radiative source terms for the isothermal case with parabolic water vapor concentration profile (Case 2).
Non-isothermal homogeneous medium (Case 3) The third problem analyzed has a boundary layer
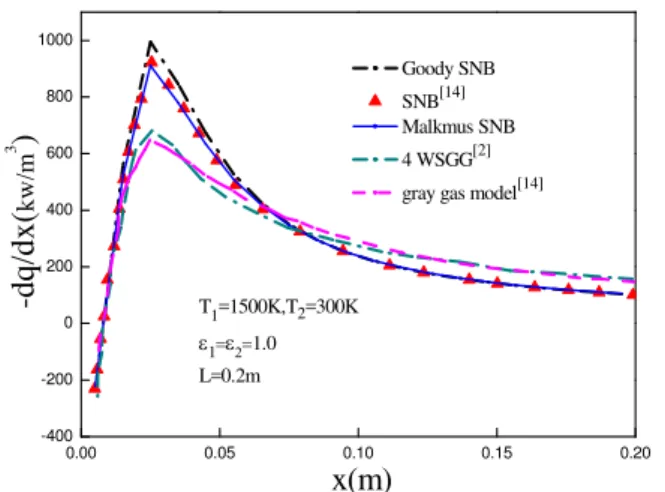
type temperature profile. The medium is again pure water vapor, the left plate is at 1500 K and the right plate is at 300 K. The distance between the plates is 0.2 m. The calculated source term distributions are compared in Fig. 4. From Figure 4, a similar observation to that in Case 1 can be made. Both SNB models predict the sharp rise of the radiative source term near the left wall with the results of the Malkmus model in better agreement with the reference solution. However, the WSGG model and the gray gas model cannot resolve the rapid change in the source term distribution.
Non-isothermal inhomogeneous medium (Case 4) For the last case, the same boundary layer type
temperature profile as Case 3 is considered, while the gas medium is assumed to contain a uniform mixture of 20% H2O + 10% CO2 + 70% N2, instead of the pure water vapor assumed in Case 3. The
distance between the plates is chosen to be 0.5 m.
Figure 5 compares the source term distributions from the two SNB models and results from the SNB-CK model. Results of the two SNB models are in good agreement with those of the SNBCK-7, especially the Malkmus SNB model, which is expected since the SNBCK results were based on the Malkmus SNB model and the same SNB database. Results of the SNBCK-1, which is equivalent to treat the gray gas at each narrow-band, show large error.
0.00 0.05 0.10 0.15 0.20 -400 -200 0 200 400 600 800 1000 -d q/d x( kw /m 3 ) x(m) Goody SNB SNB[14] Malkmus SNB 4 WSGG[2] gray gas model[14]
T1=1500K,T2=300K ε1=ε2=1.0 L=0.2m 0.0 0.1 0.2 0.3 0.4 0.5 -100 0 100 200 300 T1=1500K,T2=300K ε1=ε2=1.0 L=0.5m Goody SNB Malkmus SNB SNBCK-7[24] SNBCK-1[24] -d q/ dx ( kw/m 3 ) x(m)
Figure 4 Distributions of the radiative source term for the boundary-layer type temperature case with pure water vapor (Case 3).
Figure 5 Distributions of the radiative source term for the boundary-layer type temperature case with 20% H2O + 10% CO2 + 70% N2 (Case
4).
Comparison of the net wall heat fluxes and computing time The net heat fluxes at the boundary
and computing time for all the cases are summarized in Table 1. The discrepancy between the two SNB models is evident, although it is quite small, from the table.
Table 1:
Net wall heat fluxes (kW/m2) and computing time (s) for the four cases Kim et al. [14] Malkmus SNB Goody SNB Cases Length (m) Heat flux
(kW/m2) Time (s) Heat flux (kW/m2) Time (s) Heat flux (kW/m2) Time (s) 0.1 -14.3 / -14.2 3.14 -15.1 3.25 Case 1 1.0 -28.2 / -30.3 3.20 -31.3 3.34 Case 2 1.0 -25.2 / -27.0 3.20 -28.1 3.34 Case 3 0.2 277.4 / 271.7 3.16 271.2 3.25 Case 4 0.5 / / 270.6 3.69 270.0 3.81
Narrow band intensities along a line-of-sight Figures 6, 7 and 8 compare narrow band
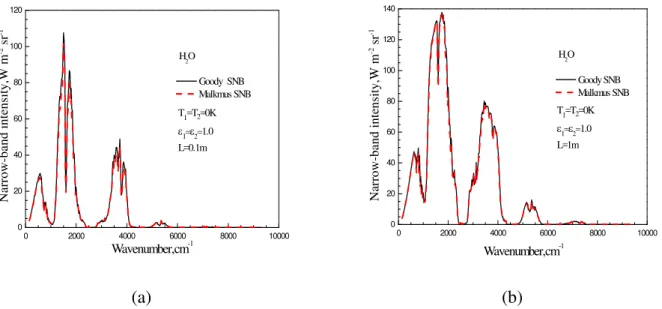
intensities along a line-of-sight (at x = L and along the positive x direction) for the four cases mentioned above. From these figures, we can see that there are not significant differences in the narrow band intensities obtained using the Goody SNB model and Malkmus SNB model; however, results of the former are in general slightly higher than those of the latter. This is consistent with the somewhat higher radiative source term and heat flux from the Goody SNB model shown earlier. Figure 6 shows that the narrow band intensities with a greater optical length vary more than those with a shorter length. It is found that variations of the narrow band intensities also become significant when the medium of pure water is replaced by a mixture of H2O, CO2 and N2 as shown
in Figure 8. The treatments for the overlapping bands (such as 450 to 1200, 1950 to 2450 and 3300 to 3800) of H2O and CO2 have been discussed by Liu et al. (2001) [26]. In the present paper, we
employed the same treatment as that of Kim et al. [14]. In future work, we will investigate the treatment of the overlapping bands to improve the accuracy of the model.
0 2000 4000 6000 8000 10000 0 20 40 60 80 100 120 T1=T2=0K ε1=ε2=1.0 L=0.1m Nar row -band i ntensity,W m -2 sr -1 Wavenumber,cm-1 Goody SNB Malkmus SNB H2O 0 2000 4000 6000 8000 10000 0 20 40 60 80 100 120 140 Na rr ow-ban d in te nsi ty,W m -2 sr -1 Wavenumber,cm-1 T1=T2=0K ε1=ε2=1.0 L=1m Goody SNB Malkmus SNB H2O (a) (b) Figure 6 Comparisons of narrow-band intensities for case 1 with two optical paths (a) 0.1 m and (b)
1 m. 0 2000 4000 6000 8000 10000 0 20 40 60 80 100 120 140 Narro w-band intensity ,W m -2 sr -1 Wavenumber,cm-1 T1=T2=0K ε1=ε2=1.0 L=1m Goody SNB Malkmus SNB H2O+N2
Figure 7 Comparisons of narrow-band intensities for Case 2.
0 2000 4000 6000 8000 10000 0 100 200 300 400 500 Na rrow-ba nd inte nsity,W m -2 sr -1 Wavenumber,cm-1 T1=1500K,T2=300K ε1=ε2=1.0 L=0.2m Goody SNB Malkmus SNB H2O 0 2000 4000 6000 8000 10000 0 100 200 300 400 500 Narrow-band intens ity,W m -2 sr -1 Wavenumber,cm-1 T1=1500K,T2=300K ε1=ε2=1.0 L=0.5m Goody SNB Malkmus SNB 0.2H2O+0.1CO2+0.7N2 (a) (b) Figure 8 Comparisons of narrow-band intensities for (a) case 3, and (b) case 4.
CONCLUSIONS
Four test problems have been investigated to compare the Goody SNB model and the Malkmus SNB model using the recently available narrow-band database in the literature. The radiative source term, the wall fluxes, the narrow band intensities along a line-of-sight and the computing time were investigated. In general the differences between the two SNB models are fairly small. The following observations were made from the results of the present study:
(1) For the isothermal homogeneous medium, Case 1, results of the Malkmus model exhibit relatively large differences from those of the Goody model when the optical length is small. However, the differences become smaller with the increase of the optical length.
(2) For the isothermal inhomogeneous medium, Case 2, results of the two SNB models depart from the literature solution, with those of the Malkmus model in better agreement with the benchmark solution.
(3) For the two non-isothermal cases, Cases 3 and 4, the Malkmus SNB model is again more accurate than the Goody model, judged by the closer agreement between the results of the Malkmus model and solutions from the literature.
(4) For the CPU time required for the four problems, the Malkmus model is slightly more efficient than the Goody model.
(5) The differences in the narrow-band radiation intensities from both SNB models are fairly small for the four cases considered.
More recently, the DRESOR method based on the MCM for RTE has been proposed by Zhou et al. [27] for gray media. By this method, the intensity with high directional resolution at any point can be obtained with high precision. This method will be extended for non-gray gas radiation in the near future.
ACKNOWLEDGEMENT
The present study has been supported by the National Natural Science Foundation of China (Nos. 50636010 and 50721005) and the Program of Introducing Talents of Discipline to Universities (“111” project No. B06019), China. The authors would like to extend their thanks to Prof. Richard O. Buckius, Prof. B. W. Webb and Prof. Tae-Ho Song for much useful help and discussion.
REFERENCES
1. Modest, M. F. Radiative heat transfer; second edition. 2003. San Diego Academic Press: New York.
2. Song T. H. Comparison of engineering models of non-grey behavior of combustion products.
Int. J. Heat Mass Transfer. 1993. 36: 3975-3982.
3. Rothman, L. S., Gordon, I. E., Barbe, A., et al. The HITRAN 2008 molecular spectroscopic database. JQSRT. 2009. 110(9-10): 533-572.
4. Rothmana, L. S., Camy, P. C., Flaud, J. M., et al. HITEMP, the high-temperature molecular spectroscopic database. 2000. http://www.hitran.com .
5. Edwards, D. K. and Balakrishnan, A. Thermal radiation by combustion gases. Int. J. Heat
Mass Transfer. 1973. 16: 25-40.
7. Modest, M. F. The weighted-sum-of-grey-gases model for arbitrary solution methods in radiative transfer. ASME J. Heat Transfer. 1991. 113: 650-656.
8. Soufim, A. and Djavdan, E. A comparison between weighted sum of grey gases and statistical narrow-band radiation models for combustion applications. Combust. Flame. 1994. 97: 240-250.
9. Denison, M. K. and Webb, B. W. The spectral line-based weighted-sum-of-grey-gases model in non-isothermal nonhomogeneous media. ASME J. Heat Transfer. 1995. 117: 359-365. 10. Modest, M. F. and Zhang, H. The full-spectrum correlated-k distribution for thermal radiation
from molecular gas-particulate mixtures. ASME J. Heat Transfer. 2002. 124(1): 30-38. 11. Goody, R. A statistical model for water vapour absorption. Quarterly Journal of the Royal
Meteorological Society. 1952. 78: 165-169.
12. Malkmus, W. Random Lorentz band model with exponential-tailed S-1 line intensity distribution function. J. Optical Society of America. 1967. 57: 323-329.
13. Grosshandler, W. L. Radiative heat transfer in nonhomogeneous gases: a simplified approach.
Int. J. Heat Mass Transfer. 1980. 23: 1447-1459.
14. Kim, T. K., Menart, J. A., and Lee, H. S. Non-grey radiative gas analysis using the S-N discrete ordinates method. ASME J. Heat Transfer. 1991. 113: 946-952.
15. Liu J. and Tiwari, S. N. Investigation of radiative transfer in non-grey gases using a narrow band model and Monte Carlo simulation. ASME J. Heat Transfer. 1994. 116: 160-166. 16. Liu F., Gülder, Ö. L., Smallwood, G. J., and Ju Y. Non-grey gas radiative transfer analyses
using the statistical narrow-band model. Int. J. Heat Mass Transfer. 1998. 41: 2227-2236. 17. Lacis, A.A. and Oinas, V. A description of the correlated-k distribution method for modeling
non-grey gaseous absorption, thermal emission, and multiple scattering in vertically inhomogeneous atmospheres. J. Geophysical Research. 1991. 96: 9027-9063.
18. Soufiani, A. and Taine, J. High temperature gas radiative property parameters of statistical narrow band model for H2O,CO2 and CO, and correlated k model for H2O and CO2. Int. J.
Heat Mass Transfer. 1997. 40: 987-991.
19. Liu F., Smallwood, G. J., and Gülder, Ö. L. Band lumping strategy for radiation heat transfer calculations using a narrowband model. J. Thermophys Heat Transfer. 2000. 14: 278-281. 20. Siegel, R. and Howell, J. R. Thermal Radiation Heat Transfer: fourth edition. 2002. Taylor &
Francis: New York.
21. Marakis, J. G. Application of narrow and wide band models for radiative transfer in planar media. Int. J. Heat Mass Transfer. 2001. 44: 131-142.
22. Ludwig, D. B., Malkmus, W., Reardon, J. E., and Thomson, J. A. L. Handbook of Infrared
Radiation from Combustion Gases. 1973. NASA SP3080.
23. Soufiani, A., Hartmann, J. M., and Taine, J. Validity of band-model calculations for CO, and H2O applied to radiative properties and conductive-radiative transfer. JQSRT. 1985. 33(3):
243-257.
24. Liu F., Smallwood, G. J., and Gülder, Ö. L. Application of the statistical narrow-band
correlated-k method to low-resolution spectral intensity and radiative heat transfer calculations-effects of the quadrature scheme. Int. J. Heat Mass Transfer. 2000. 43: 3119-3135.
25. Godson, W.L. The evaluation of infra-red radiation fluxes due to atmospheric water vapor. Quart. J. Royal. Meteorol. Soc. 1953. 79: 367-379.
26. Liu F., Smallwood, G.J., and Gülder, Ö. L. Application of the statistical narrow-band
correlated-k method to non-grey gas radiation in CO2-H2O mixtures: approximate treatments of
overlapping bands. JQSRT. 2001. 68(4): 401-417.
27. Zhou H-C., Cheng Q., Huang Z-F., and He C. The influence of anisotropic scattering on the radiative intensity in a grey, plane-parallel medium calculated by the DRESOR method.