HAL Id: hal-02445112
https://hal.archives-ouvertes.fr/hal-02445112
Submitted on 15 Dec 2020
HAL is a multi-disciplinary open access
archive for the deposit and dissemination of
sci-entific research documents, whether they are
pub-lished or not. The documents may come from
teaching and research institutions in France or
abroad, or from public or private research centers.
L’archive ouverte pluridisciplinaire HAL, est
destinée au dépôt et à la diffusion de documents
scientifiques de niveau recherche, publiés ou non,
émanant des établissements d’enseignement et de
recherche français ou étrangers, des laboratoires
publics ou privés.
Terahertz Study of Wood Structure as Impacted by
Grapevine Trunk Diseases
D. Coquillat, Y. Meriguet, N. Dyakonova, C. Consejo, P. Buzatu, J. Torres, L.
Varani, J. Perry, R. Fernandez, S. Merigeaud, et al.
To cite this version:
D. Coquillat, Y. Meriguet, N. Dyakonova, C. Consejo, P. Buzatu, et al.. Terahertz Study of Wood
Structure as Impacted by Grapevine Trunk Diseases. 2019 44th International Conference on Infrared,
Millimeter, and Terahertz Waves (IRMMW-THz), Sep 2019, Paris, France. pp.1-2,
�10.1109/IRMMW-THz.2019.8874276�. �hal-02445112�
Abstract— Grapevine trunk diseases affect grapevines
worldwide and dramatically shorten the longevity of vineyards. This study has successfully demonstrated the use of THz time-domain imaging to identify the grapevine wood tissues degraded by the fungi responsible for grapevine trunk diseases.
I. INTRODUCTION
rapevine trunk diseases (GTDs) are severe diseases affecting grapevines worldwide. They dramatically shorten the longevity of vineyards and endanger their sustainability because the causal pathogens attack the long-lasting organs, inducing vine death [1]. Foliar symptoms are frequently used to detect and monitor infected plants, but their expression can vary drastically from one year to another and they are difficult to reproduce under controlled conditions [2]. Therefore, various methodologies have been developed to monitor and discriminate the presence and the amount of fungal pathogens in the wood, such as re-isolation of mycelium, measurement of the necrotic area, sequencing and PCR-based methods to evaluate the expression, the diversity or the biomass of the pathogens. Most of these approaches are specific and sensitive but not suitable for in-field detection since they are time-consuming, costly and require the destruction of the sample. Owing to their low photon energy, terahertz (THz) waves can be used without causing damage to biological tissues and, coupled to Principal Component Analysis (PCA), they have shown their success in agronomy analysis [3,4]. The objective of the current study was to develop a method to discriminate the decayed parts from the healthy parts of grapevine wood using THz pulsed imaging together with PCA methods without any wood slice sample preparation.
II. MATERIALS AND METHODS
A wood sample collected on a vine (V. vinifera L. cv. Chardonnay) presenting foliar symptoms of Esca disease, in the Plumecoq vineyard (CIVC Champagne, France) showed different degrees of necrosis typical of GTDs (Fig. 1(a)). A TeraPulse 4000 instrument (TeraView, Cambridge) was used for THz time-domain spectroscopy and imaging. The measurements were conducted in transmission mode; 40 scans were acquired at 15 Hz rate covering an optical delay of 35 ps. The images of a 7.0 mm thick sample including colonized and healthy parts were collected for a scanning area of 20 mm × 20 mm, which corresponds to 200 × 200 pixels at 100 µm spacing.
III. RESULTS
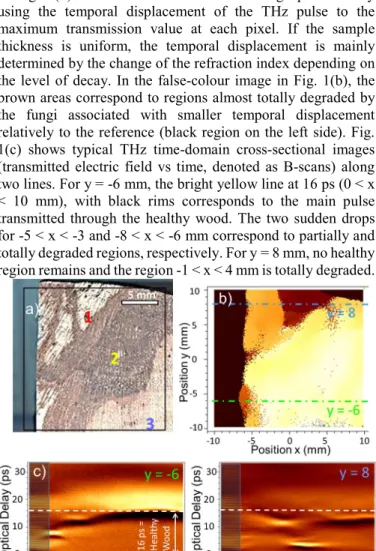
Fig. 1(b) shows a time-domain THz image produced by using the temporal displacement of the THz pulse to the maximum transmission value at each pixel. If the sample thickness is uniform, the temporal displacement is mainly determined by the change of the refraction index depending on the level of decay. In the false-colour image in Fig. 1(b), the brown areas correspond to regions almost totally degraded by the fungi associated with smaller temporal displacement relatively to the reference (black region on the left side). Fig. 1(c) shows typical THz time-domain cross-sectional images (transmitted electric field vs time, denoted as B-scans) along two lines. For y = -6 mm, the bright yellow line at 16 ps (0 < x < 10 mm), with black rims corresponds to the main pulse transmitted through the healthy wood. The two sudden drops for -5 < x < -3 and -8 < x < -6 mm correspond to partially and totally degraded regions, respectively. For y = 8 mm, no healthy region remains and the region -1 < x < 4 mm is totally degraded.
Fig. 1. a) Photograph of the grapevine wood slab showing different levels of
decay: 1-necrosis characteristic of grapevine Esca disease (amadou), 2-black wood, 3-asymptomatic (healthy) tissue; and b) the associated THz image produced by using the temporal displacement of the THz pulse to the maximum amplitude of the transmitted waveforms. c) THz time-domain cross-sectional images (B-scans) along y = -6 mm and y = 8 mm. These positions are shown as dash-dotted lines in Fig. 1 (b).
In order to achieve additional insight into the THz images and their interpretation, the PCA method was used to analyze the data belonging to healthy and decayed regions. This method has been already employed in association with THz spectroscopy to classify different types of materials [5,6]
D. Coquillat
1, Y. Meriguet
1,2, N. Dyakonova
1, C. Consejo
1, P. Buzatu
1, J. Torres
2, L. Varani
2, J. Perry
3,
R. Fernandez
4, S. Merigeaud
5, J-L. Verdeil
6, M. Cardoso
1, C. Goze-Bac
1, A-S. Spilmont
7, P. Larignon
8, J-P. Peros
9,
L. Le Cunff
4and C. Moisy
41Laboratoire Charles Coulomb (L2C), University of Montpellier, CNRS, France ; 2IES, University of Montpellier, CNRS,
France.3CIVC, Comité Champagne, Epernay, France; 4 IFV, Pole Matériel Végétal, UMT Géno-Vigne, Montpellier, France; 5Tridilogy SARL, Saint-Gély du Fesc, France; 6CIRAD, UMR AGAP, Montpellier, France; 7IFV, Pôle Matériel Végétal, UMT
Géno-Vigne, Le Grau du Roi, France; 8IFV, Pôle Rhône-Méditerranée, Rodilhan, France; 9INRA, UMR AGAP, DAAV, UMT
Géno-Vigne, Montpellier, France.
Terahertz study of Wood structure as impacted by Grapevine Trunk Diseases
discriminate wheat of varying states of moldiness [3,4], identify transgenic ingredients in maize grains [7], determination of pesticides in a flour substrate [8], etc. The time-domain signal and frequency-domain spectrum of the different regions were chosen as original variables and we used Galaxy software for the PCA analysis of our data [9]. First, we selected 116 positions on the image from three different areas that we expect of different types. The scores of the PCA in the plane of the two first components are shown in Fig. 2 where one can clearly observe a dispersion of samples in three groups. Indeed, the blue triangles correspond to data taken from the healthy region, the black squares from the black wood and finally, the red dots from the decayed regions. From this result we can concluded that the plane defined from the two first components of the PCA allows to retrieve the different wood regions as impacted by grapevine trunk diseases, without knowing the corresponding data sets.
Fig. 2 Score of PCA in the plane of the two first principal components for a
data set of 116 spectra (different x,y positions). t[1] is for the first principal component and t[2] for the second one. The blue triangles indicate the healthy tissue (3), the black squares the partially degraded region (2-black wood) and the red dots the totally degraded region (1-necrosis).
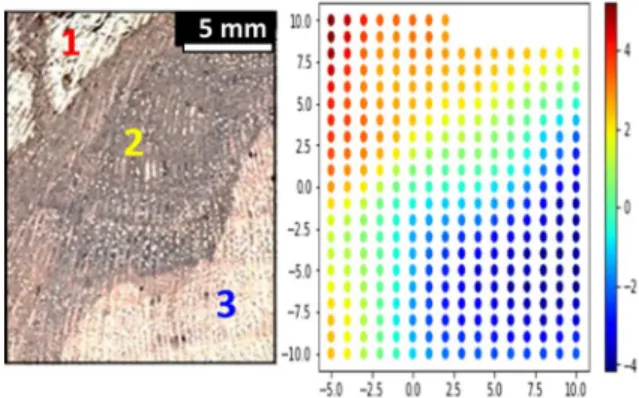
On the basis of this positive result, an alternative analysis has been tested by selecting 286 spectra corresponding to positions x = -5 to 10 mm and y = -10 to 10 mm and removing the top-right part of the image – corresponding to positions x = 3 to 10 mm and y = 9 to 10 mm – as shown on Fig. 3(a). The results displaying the loadings of the first component of the PCA (i.e. the weights for each original variable when calculating the principal component) are presented in Fig. 3(b). We observe that points in dark blue identify the healthy wood (region 3), points in light blue to yellow the black wood (region 2), and points in orange to red the necrosis (region 1). Therefore by coupling the results of Figures 2 and 3 it is possible to achieve a better discrimination of the different areas of the wood including the transition region.
Fig. 3 a) Photograph of the grapevine wood slab showing different levels of
decay: 1-necrosis characteristic of grapevine Esca or amadou, 2-black wood, 3-asymptomatic (healthy) tissue; and b) The associated image produced by using PCA loadings of the first principal component on the temporal displacement of the THz waveform. The scale is the same as in Fig. 1(b).
ACKNOWLEDGMENTS
This work was financially supported by the Montpellier University of Excellence I-Site MUSE (PRIME@MUSE), the Région Occitanie, and by the “Gepeto Terahertz platform”. This work was also funded by the LIA TERAMIR, and the project VITIMAGE (Plan National Dépérissement du Vignoble, CNIV and FranceAgrimer).
REFERENCES
[1]. Mondello V., Songy A., Battiston E., Pinto C., Coppin C., Trotel-Aziz P., Clément C., Mugnai L., Fontaine F., Plant Dis 102, 1189 (2018).
[2]. Mugnai L., Ganiti A., Surico G., Plant Dis 83, 404 (1999).
[3]. Jiang Y.,Ge H., Lian F., Zhang Y., Xia S., RSC Adv. 5, 93979 (2015). [4]. Ge H., Jiang Y., Xu Z., Lian F., Zhang Y., Xia S., Optics Express 22, 12533 (2014).
[5]. El Haddad J., de Miollis F., Bou Sleiman J., Canioni L. , Mounaix P., Bousquet B., Anal. Chem. 86, 10, 4927 (2014).
[6]. Zou Y., Sun P., Liu W., 2015 40th International Conference on Infrared, Millimeter, and Terahertz Waves (IRMMW-THz), Hong Kong (2015). [7]. Lian F., Xu D., Fu M., Ge H., Jiang Y., Zhang Y., IEEE Trans. on THz Sci & Tech. 7, 378 (2017).
[8]. Cao B., Fan M., Wang W., Wang M., Anal. Methods 10, 5097 (2018). [9]. https://galaxyproject.org, main public server: https://usegalaxy.org.. Afgan E., Baker D., Batut B., van den Beek M., Bouvier D., Cech M., Chilton J., Clements D., Coraor N., Grüning B.A., Guerler A., Hillman-Jackson J., Hiltemann S., Jalili V., Rasche H., Soranzo N., Goecks J., Taylor J., Nekrutenko A., Blankenberg D., Nucleic Acids Res. 46, 537 (2018).