HAL Id: hal-00316244
https://hal.archives-ouvertes.fr/hal-00316244
Submitted on 1 Jan 1996
HAL is a multi-disciplinary open access
archive for the deposit and dissemination of sci-entific research documents, whether they are pub-lished or not. The documents may come from teaching and research institutions in France or abroad, or from public or private research centers.
L’archive ouverte pluridisciplinaire HAL, est destinée au dépôt et à la diffusion de documents scientifiques de niveau recherche, publiés ou non, émanant des établissements d’enseignement et de recherche français ou étrangers, des laboratoires publics ou privés.
EISCAT measurements of the solar wind
A. R. Breen, W. A. Coles, R. R. Grall, M. T. Klinglesmith, J. Markkanen, P.
J. Moran, B. Tegid, P. J. S. Williams
To cite this version:
A. R. Breen, W. A. Coles, R. R. Grall, M. T. Klinglesmith, J. Markkanen, et al.. EISCAT mea-surements of the solar wind. Annales Geophysicae, European Geosciences Union, 1996, 14 (12), pp.1235-1245. �hal-00316244�
Ann. Geophysicae 14, 1235—1245 (1996) ( EGS — Springer-Verlag 1996
EISCAT measurements of the solar wind
A. R. Breen1, W. A. Coles2, R. R. Grall2, M. T. Klinglesmith2, J. Markkanen3, P. J. Moran1, B. Tegid1, P. J. S. Williams1
1 Adran Ffiseg, Prifysgol Cymru, Aberystwyth SY23 4LU, Cymru/Wales, EU
2 Department of Electrical and Computer Engineering, University of California, San Diego, USA 3 EISCAT, Sodankyla¨ SF-99600, Suomi/Finland, EU
Received: 24 January 1996/Revised 24 April: 1996/Accepted: 25 April 1996
Abstract. EISCAT observations of interplanetary scintil-lation have been used to measure the velocity of the solar wind at distances between 15 and 130 Rx (solar radii) from the Sun. The results show that the solar wind con-sists of two distinct components, a fast stream with a vel-ocity of &800 km s~1 and a slow stream at &400 km s~1. The fast stream appears to reach its final velocity much closer to the Sun than expected. The results presented here suggest that this is also true for the slow solar wind. Away from interaction regions the flow vector of the solar wind is purely radial to the Sun. Observations have been made of fast wind/slow wind interactions which show enhanced levels of scintillation in compression regions.
1 Observations
Measurements of IPS (interplanetary scintillation) have been used for many years to study electron density fluctu-ations in the solar wind (e.g. Cohen et al., 1967) and to measure the solar wind velocity (Dennison and Hewish, 1967; Armstrong and Coles, 1972; Coles 1995). IPS has the advantage that it can provide measurements from close to the Sun to beyond 1 AU and at all heliographic latitudes (Coles, 1995). The solar wind velocity is determined from the correlation of scintillations observed at separate sites and the three EISCAT receiving stations provide an ideal system, offering baselines up to 390 km. The frequency band used for these observations is centred at 931.5 MHz, allowing measurements from as close to the Sun as 15 Rx (solar radii) out to distances of more than 130 Rx.
IPS observations were first made at EISCAT in 1981 (Bourgois et al., 1985), and since 1990 a regular series of measurements has been made every summer (Coles et al., 1991; Breen et al., 1996; Grall et al., 1996). The measure-ments made in 1994 and 1995 were especially significant
Correspondence to: A. R. Breen
as they matched the passage of the ULYSSES spacecraft over the poles of the Sun.
The data used in this study were taken between April 1992 and September 1995 using the EISCAT special pro-gramme SP-UK-SCINTI to monitor the scintillations in signals from a radio source of small angular diameter received at two of the EISCAT UHF antennas. If the parallel lines of sight to the two antennas pass through the solar atmosphere in the same radial plane then the fluctu-ations in signal power received by the antennas are highly correlated. As the distance between the two antennas is known, the time lag for maximum cross-correlation can be used to estimate the component of solar wind velocity perpendicular to the line of sight (Coles et al., 1991; Breen
et al., 1996). The long baselines available between
EIS-CAT sites mean that these velocity measurements can be made with high resolution so that streams of different velocity can be distinguished (Grall et al., 1996).
2 Results
2.1 Bimodal velocity distribution
In earlier IPS work using EISCAT (e.g. Bourgois et al., 1985) the apparent velocity was determined by fitting the observed correlation functions with a theoretical model in which the solar wind velocity had a compact distribution about a single mean speed. The mean speed was largely determined from the time lag at which the auto- and cross-correlation functions intersect. The rms velocity in the tangential direction causes the peak of the cross-cor-relation function to drop, but does not increase its width. The rms velocity in the radial direction does not change the area under the cross-correlation function but broadens and skews it, causing the peak cross-correlation to drop. The rms velocity in the tangential direction could be caused by plasma waves, whereas the rms velocity in the radial direction is largely due to the ‘cosh’ effect, where h is the angle between the local direction of the solar wind and the direction perpendicular to the line of sight from
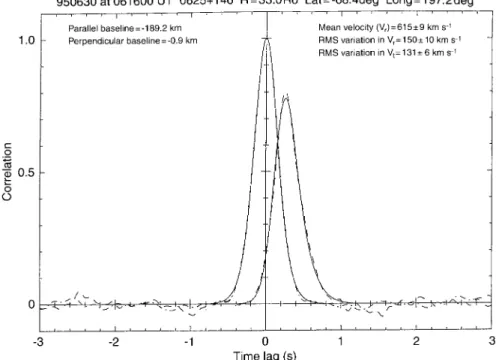
Fig. 2. Observations of 0625#146 on 30 June 1995, showing a clear fast stream at high latitude (single stream analysis). The dashed line represents the data and the solid line the model fit
Fig. 1. Schematic diagram of EISCAT IPS observations (SP-UK-SCINTI). Density fluctuations carried outwards by the solar wind modulate the radio waves from the distant source, producing a mov-ing interference pattern at the receivmov-ing sites. The experiment is only sensitive to the component of solar wind velocity perpendicular to the line of sight to the source (» cosh, where » is the solar wind velocity)
the source to the antenna (Fig. 1). Fortunately the strength of scattering falls rapidly with distance from the Sun (J1/R4) so that in the single-velocity case the strongest scattering occurs for small values of h where the cos h effect is small. The true radial velocity can then be derived from the apparent velocity by applying a correction factor of about 1.18. Under ideal conditions, the cross-correla-tion funccross-correla-tion for a single-velocity solar wind is narrow and almost symmetrical with a high peak value and in such cases both the rms deviations are small and » can be measured with a random error of only a few percent (see Fig. 2).
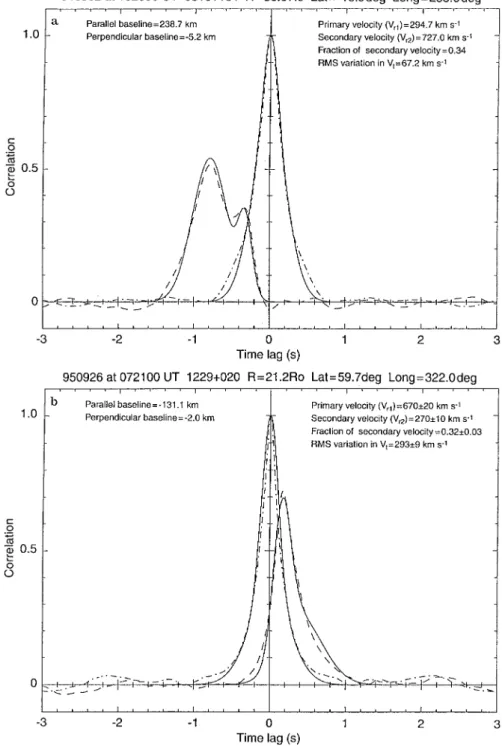
In contrast, other cases show a cross-correlation func-tion which is rather wide, with a strong asymmetry. When such a function is analysed in terms of a single-velocity solar wind the results suggest rms deviations in both radial and transverse velocities that are much larger than appear realistic. However, from 1994 onwards the EIS-CAT observations were planned to match those made by Ulysses at high latitude and on the whole the baselines used were longer than in previous years. For observations made at such long baselines the cross-correlation func-tions often showed two distinct peaks, suggesting that two separate velocity streams were present along the line of sight (Breen et al., 1996; Grall et al., 1996). As a result a fitting procedure was adopted which assumed the pres-ence of two different streams and this produced model correlation functions which fitted closely to the two-peak functions actually measured (Fig. 3a). In the light of this result the entire dataset was re-analysed assuming the presence of a fast stream and a slow stream in the solar wind, both showing small intrinsic variations in velocity. Overall the accuracy of the model fits was significantly improved when such a two-stream model was used, espe-cially in the case of asymmetric functions like the one shown in Fig. 3b. In this case, the new analysis pro-gramme indicated that 62% of the scintillation was caused by a fast stream with an apparent velocity of 670 km s~1 and 38% from a slow stream with an apparent velocity of 300 km s~1.
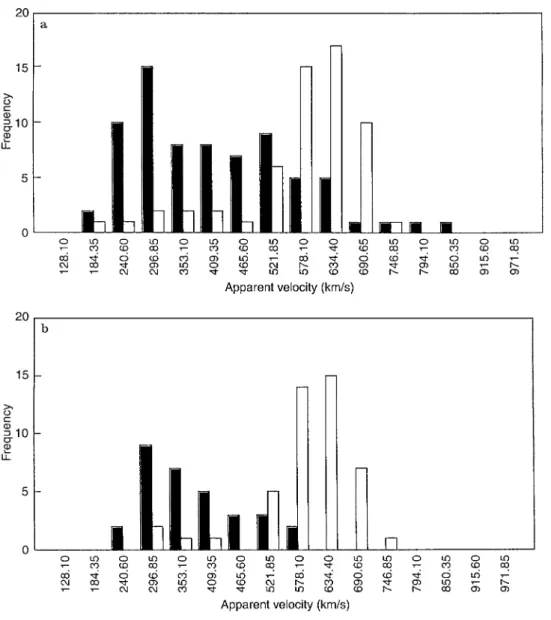
Figure 4a shows a frequency histogram of the different velocities derived by the new analysis programme for EISCAT measurements at low (below 30° north or south) and high (above 60°) heliographic latitudes made between 1992 and 1995. Two clear peaks are present, one corre-sponding to low-latitude measurements with apparent velocities of about 300 km s~1 and the other to high-latitude measurements with apparent velocities of about
Fig. 3. a Observations of 0318#164 on 2 May 1994, showing a two-peak correla-tion funccorrela-tion analysed using the two-velocity model. The dashed line represents the data and the solid line the model fit; b Observations of 1229#020 on 26 Sep-tember 1995, showing a skewed single peak correlation function analysed using the two-velocity model. The dashed line repre-sents the data and the solid line the model fit
600 km s~1. These peaks become even more marked when only those cases are included where one stream is clearly dominant, contributing more than 70% of the observed scintillation power, as shown in Fig. 4b. The low-latitude observations are clearly dominated by slow streams, while the high-latitude observations are dominated by fast streams with apparent velocities of 600—700 km s~1. When corrected for foreshortening these measurements imply true velocities of 700—800 km s~1, which is consis-tent with Ulysses observations of fast streams at high heliographic latitudes (Phillips et al., 1994).
These results indicate that the solar wind velocity falls into two categories with distinct velocities of about 400 and 800 km s~1 rather than varying continuously over
a wide range of speeds. This bimodal distribution provides an interpretation of IPS data consistent with the descrip-tion of a fast solar wind originating from coronal holes and a slow solar wind from the ‘‘non-hole’’ corona. (Sheeley et al., 1976). It is also consistent with the observa-tions made at much greater solar distances by spacecraft such as Helios (Schwenn, 1990) and Ulysses (Phillips et al., 1994, 1995).
2.2 Variation of velocity with distance from Sun
The IPS technique has the great advantage of providing repeated measurements of solar wind velocity over a wide
Fig. 4 a, b. Histograms of apparent solar wind velocity measurements for high ('600 N/S) and low ((300 N/S) heliographic latitudes, 1992—1995. a All measurements; b all cases where one velocity is dominant, contributing '70% of the scattering
range of distances from the Sun. However, the fitting procedure assumes weak scattering along the line of sight, and at any specified frequency there is a minimum dis-tance inside which strong scattering occurs so this proced-ure cannot be used. EISCAT operates at a relatively high frequency for an IPS system and so is able to make measurements relatively close to the Sun. In fast streams (for example, those originating at the solar poles) weak scattering can be assumed as close to the Sun as 15 Rx. The slow (equatorial) streams are denser by a factor of &3 (Axford and McKenzie, 1996) so that the strength of scattering per unit volume is greater and the velocity of the slow solar wind can only be measured with certainty beyond 30 Rx.
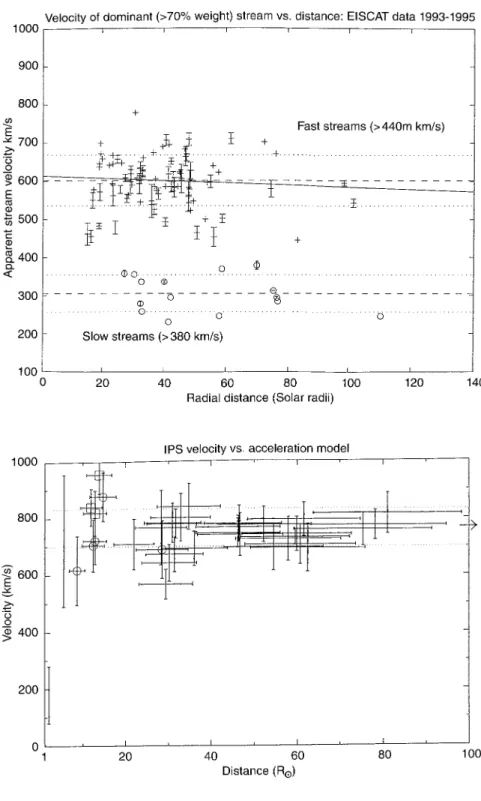
Figure 5 shows the variation of the apparent velocity of dominant fast and slow streams of solar wind with dis-tance from the Sun. The broken horizontal lines represent the mean apparent velocity of the fast and slow streams. There is no evidence of any variation in velocity over the
range of distances observed. Furthermore, when corrected for foreshortening, the fast and slow stream velocities are in close agreement with those observed by Ulysses at distances of 1.5 AU or more (Phillips et al., 1994). The error bars shown in Fig. 5 are based on the fit of the modelled correlation functions to the data. They do not take account of any other sources of error so the error bars shown in Fig. 5 represent the minimum uncertainties in the velocity estimates.
These results suggest that the solar wind completes its acceleration within a distance less than 15—30 Rx, a con-clusion strengthened by the results of a series of co-ordina-ted observations using EISCAT and the VLBA system in New Mexico. The VLBA operates at frequencies consider-ably higher than those available to EISCAT and hence can make reliable velocity measurements as close to the Sun as 2.4 Rx. Figure 6 shows the results of a series of measurements of the high-latitude solar wind made using EISCAT and the VLBA (Grall et al., 1996). The fast
Fig. 5. Variation with radial distance of the apparent velocity of clearly dominant streams (contributing '85% of scattering) in data from 1993—1995
Fig. 6. Variation of velocity of high-latitude fast streams determined from EISCAT and VLBA measurements (Grall et al., 1996). The EISCAT measurements (from the southern polar hole between April and September 1994) are marked with crossed bars, while VLBA measurements are marked with circles (south polar hole measurements) or squares (measure-ments from the northern polar hole). In all cases the vertical bar represents the 90% confidence limit for the velocity and the horizontal bar indicates the distance range over which the measurement is averaged. The points inside 10 Rxare derived from SPARTAN 201-01 white-light measurements (Fisher and Guhathakurta, 1994; Habbal et al., 1995)
stream velocity (corrected for foreshortening) is plotted against distance from the Sun. An arrow at 100 Rx de-notes the mean velocity measured by Ulysses over the same latitude range.
2.3 Direction of flow
Theories of the solar wind suggest that away from interaction regions the solar wind should flow radially outwards from the Sun (e.g. Axford and McKenzie, 1996) so we would expect the maximum cross-correlation to
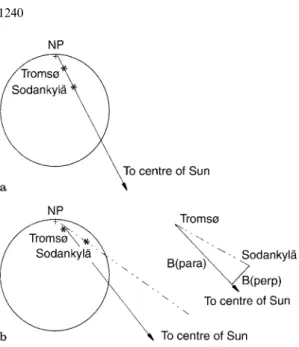
occur when the lines of sight from the source to the two antennas lie in a radial plane passing through the centre of the Sun, as shown in Fig. 7a. In the normal mode of operation EISCAT observes a radio source for 15 min, centred at the optimum time when the baseline lies in this radial plane. However, as the Earth rotates the two lines of sight are no longer in the same radial plane (Fig. 7b) and if the observations are extended for several hours the cross-correlation between the scintillations at the two sites will eventually disappear.
A number of these extended observations were carried out in 1994, and in each case the maximum correlation
Fig. 7. a The EISCAT antennas viewed from the direction of the source. The transverse separation between the two sites (Tromsø and Sodankyla¨) is zero. NP marks the geographical north pole of the Earth. b The EISCAT antennas viewed from the direction of the source 2 h later than a. The transverse separation between the two sites is no longer zero
coefficient was plotted against the ‘‘perpendicular base-line’’ (the transverse displacement of one line of sight from the radial plane defined by the other, B(perp) in the en-larged section of Fig. 7b). After correction for the velocity of the Earth and for the movement of the antennas during the time lag to maximum correlation, the highest correla-tion was found, in almost every case, to correspond to a zero perpendicular baseline, as shown in the examples given as Fig. 8a, b. On one occasion however a small offset was observed (Fig. 8c), suggesting that the solar wind had been deflected from the radial direction by 1—1.5°. This is a very small deflection but the direction is consistent with the effects of a fast stream/slow stream interaction.
2.4 Association with coronal features
The results summarised indicate that the solar wind flows radially (or close to radially) with a velocity of 800 km s~1 (fast stream) or 400 km s~1 (slow stream), and that these velocities are approximately constant from inside 15 Rx (fast streams) or 25 Rx(slow streams). Knowing the rate of rotation of the Sun, these results make it practical to ‘map’ each line of sight from source to antenna down into the upper corona (2—5 Rx). This in turn allows the region of origin for each part of the solar wind along the line of sight to be compared with white-light or X-ray observations of the corona. As IPS is essentially a limb observation the white-light coronograph images produced by the High-Altitude Observatory are particularly suitable for com-parison, although the full disk X-ray images produced by the Yohkoh spacecraft can also be used.
Figure 9 shows the white-light map of the corona produced from west-limb observations of the Sun made by the HAO. The central date of the observations is 11
Fig. 8. a Maximum cross-correlation versus perpendicular baseline for observations of 0625#146 on 19 June 1994. When the velocity of the Earth is taken into account the maximum cross-correlation between the measurements occurs when the perpendicular baseline is zero, indicating that the solar wind velocity is purely radial. b As a but showing observations of 0745#101 on 17 July 1994; c max-imum cross-correlation versus perpendicular baseline for observa-tions of 0521#166 on 5 June 1994. The maximum cross-correlation occurs for a small negative perpendicular baseline, suggesting that the solar wind velocity may be 1.0° to 1.5° offradial
June 1995. The map is plotted in a ‘natural’ grey-scale, with the bright equatorial region appearing in white and the large polar coronal holes as dark areas. Contour lines of constant brightness are added as a guide. The solid line
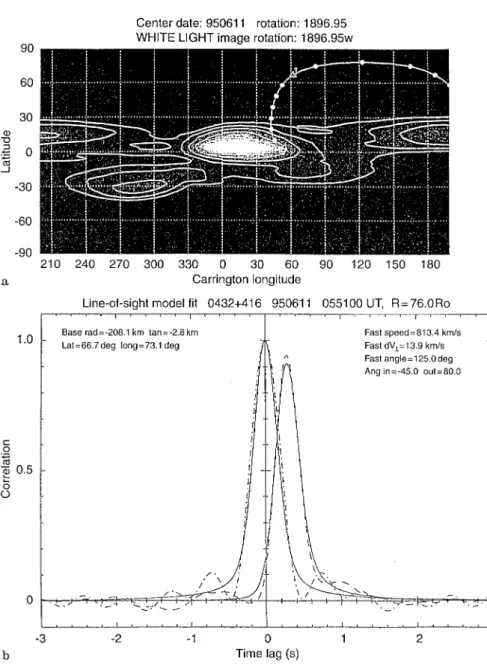
Fig. 9. a White-light map with the IPS line of sight for observations of 0432#416 on 11 June 1995 (a single fast stream) back-projected onto the map with an assumed constant radial velocity of 800 km s~1. As in Fig. 8 the closest approach of the line of sight to the Sun is marked with a triangle and the position of the Earth is shown by=. The line of sight enters the fast stream at !45° and remains in it for the rest of its length. b IPS correlation function corre-sponding to a, analysed using the line of sight model. The dashed line represents the data and the solid line the model fit
superimposed over the map is the line of sight through the solar wind from the radio source 0432#416 to EISCAT, down-projected on to the corona for an assumed velocity of 800 km s~1. The triangle corresponds to the point of closest approach of the line of sight to the Sun (and therefore the region which makes the maximum contribu-tion to the measured scintillacontribu-tion) and the circle corre-sponds to the Earth. The tick-marks indicate increments of 10° inh along the line of sight, showing that the signal from the source remains in the region above the polar coronal hole, past the point of closest approach to the Sun, untilh equals !45° (see Fig. 1). The recognition of coronal holes as the source regions for fast streams in the solar wind is ‘‘well-established’’ (Axford and McKenzie, 1996) so we would expect observations of 0432#416 centred on 11 June 1995 to indicate a high speed solar wind. Figure 9b shows the auto- and cross-correlation functions observed by EISCAT: the correlation functions were fitted after making a further improvement in the integration model which uses white-light information to
locate the position of the fast- and slow-speed streams along the line of sight as indicated by the parameter h (Grall et al., 1996). The results from fitting this new model show a simple fast stream with a mean (true) velocity of 813 km s~1 and small rms variation in the transverse velocity »t of 14 km s~1. No attempt has been made to fit the slow solar wind as it is virtually impossible to extract information on the slow component when scat-tering is clearly dominated by the fast wind. These results are entirely consistent with the picture of a smooth fast solar wind flowing out from polar coronal holes which has emerged from Ulysses observations (Geiss et al., 1995; Phillips et al., 1995).
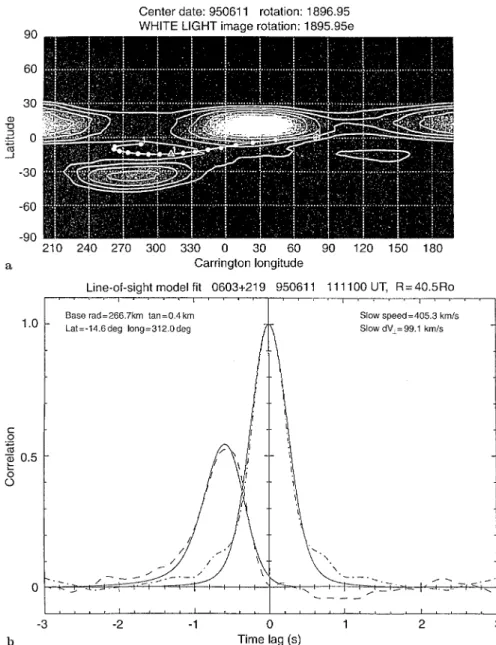
Figure 10a shows the white-light map based on east-limb HAO observations, again centred on 11 June 1995. In this case the line of sight for observations of 0603#203 are mapped back into the central streamer belt with an assumed velocity of 400 km s~1. The observed correlation functions have been fitted with a line of sight integration model which assumes a single slow stream (Fig. 10b). The
Fig. 10. a White-light map with the IPS line of sight for observations of 0603#219 on 11 June 1995 (a single slow stream) back-projected onto the map with an assumed constant radial velocity of 400 km s~1. b IPS correlation function corresponding to a, analysed using the line of sight model. The dashed line represents the data and the solid line the model fit
model represents the observed correlation functions very well, suggesting a mean velocity of 405 km s~1 and an rms variation in »t of 99 km s~1.These results are typical of the data analysed using the line of sight integration model. In all cases studied so far, simple fast streams are associated with coronal holes and simple slow streams with bright ‘‘non-hole’’ regions of the corona. These results provide a sound basis for approach-ing the more complex problem of interpretapproach-ing observa-tions where two streams are present along the line of sight.
2.5 Fast stream/slow stream interaction regions
Although the plasma of the solar wind flows out radially, the source regions of the solar wind follow the rotation of the Sun. If there is a coronal hole extending to middle or low heliospheric latitudes, bordered by regions of closed magnetic field lines, the rotation of the Sun will carry the
Fig. 11. Schematic diagram of fast stream/slow-stream interaction, looking down on the north pole of the Sun
region of open flux underneath a region of outward-flow-ing slow wind (Fig. 11). Under these circumstances the fast stream will overtake the slow stream at one boundary, and diverge from it at the other.
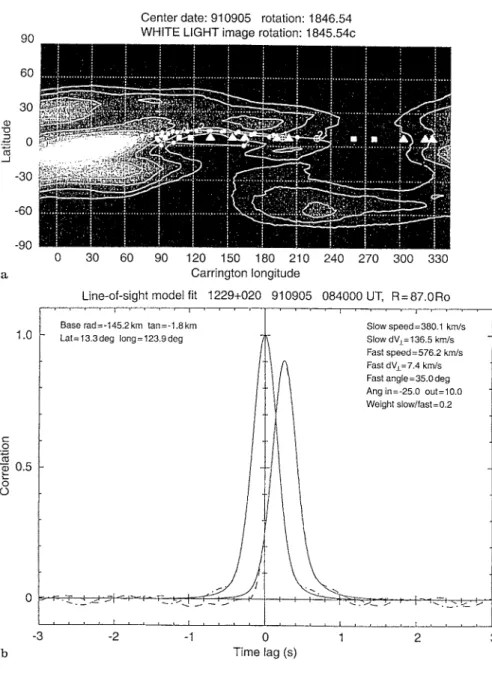
Fig. 12. a White-light map for 5 Septem-ber 1991 showing the line of sight for measurements of 1229#020 back-projected onto the map with assumed velocities of (1) 800 km s~1 and (2) 400 km s~1. The fast stream is overtaking the slow stream; b IPS correlation function corresponding to a, analysed using the line of sight model. The fast stream is much slower and causes much more scintillation than expected, suggesting that the fast stream and the slow stream are interacting to produce a turbu-lent compression zone. The dashed line represents the data and the solid line the model fit
In the case where the fast stream overtakes the slow stream, compression will occur and the interaction region will become turbulent. It can also be predicted that the fast stream will decelerate and the velocity become non-radial, while the compressed turbulent region will produce strong scintillation (private communication, Wilkinson, 1995). On the other boundary of fast/slow interaction a rarefaction zone would be expected to develop: in this region both fast and slow streams will be in the line of sight but without any strong interaction and two undis-turbed streams should be seen.
Figure 12a shows the white-light map of the west limb of the Sun centred on 5 September 1991. The super-imposed lines show the lines of sight from EISCAT to the radio source 1229#020 projected onto the corona with assumed velocities of (1) 800 km s~1 and (2) 400 km s~1. Both projections take the line of sight across the bound-aries of a low-latitude coronal hole, with the sector above
the coronal hole lying approximately betweenh"#10° and h"!25°. The fast stream is overtaking the slow stream on one boundary of this hole. The corresponding EISCAT observations and the line of sight model fit are shown in Fig. 12b. The fast component is anomalously slow at 576 km s~1 and is weighted more heavily than the slow stream, which is contrary to the usual observations of undisturbed fast and slow streams (Grall et al., 1996) but consistent with enhanced levels of scintillation within a turbulent, compressed, interaction region.
The slightly off-radial velocity observed on 5 June 1995 (Fig. 8c) also appears to be associated with a fast stream overtaking a slow stream. The closest approach of the line of sight to the Sun lies just inside the polar coronal hole and fitting with the line of sight integration model gives good agreement with the EISCAT observations. The model results show no clear evidence of compressional interaction between the fast and slow streams, but in
this case the line of sight is considerably closer to the Sun (closest approach"32 Rx) and so the interaction between the fast and slow streams might be expected to be much weaker.
When the fast and slow streams of solar wind are diverging from each other a rarefaction region is produc-ed. In this region the low density of plasma (and the reduced sharpness of the density gradients) reduces the levels of scintillation. Rarefaction regions cannot, there-fore, be directly detected by IPS measurements, but their presence can be inferred from observations which show undisturbed fast and slow components of the solar wind coming from regions where the flow from a coronal hole appears to be diverging from the solar wind.
3 Discussion and conclusions
Earlier studies of IPS observations assumed that the solar wind contained a range of velocities between about 400 and 800 km s~1, but more recent spacecraft observations have suggested that the solar wind close to the Sun is best described as consisting of distance high and low speed modes (Schwenn, 1990). EISCAT allows the fast and slow streams to be resolved, something which is not possible with single-site observations or with two-site observations on shorter baselines (Grall et al., 1996), and the smooth range of velocities reported in earlier work resulted from differing proportions of fast and slow streams in the line of sight through the solar atmosphere. The obser-vations presented in this paper and by Grall et al. (1996) confirm that the solar wind is bimodal with clear fast (&800 km s~1) and slow (&400 km s~1) components. The slow stream dominates the data at low heliographic latitudes, while only fast streams are seen at high latitudes. These results are in complete agreement with Ulysses observations (Phillips et al., 1994, 1995). When corrected for foreshortening the velocities observed by EISCAT agree well with the fast- and slow-stream velocities seen by Ulysses. Down-projection from the IPS line of sight on to white-light maps of the corona demonstrated the relation-ship between stream characteristics and coronal features. As expected there is a clear association of fast streams with areas of open magnetic flux (coronal holes), while slow streams are associated with the ‘‘non-hole’ areas of the corona and the small proportion of intermediate velocities can be interpreted as the result of fast-stream/slow-stream interaction. This interpretation is supported by observa-tions of a fast stream overtaking a slow stream in which the fast stream appears to have decelerated and the level of scintillation increased.
EISCAT measurements over a wide range of distances from the Sun (15—130 Rx) show that the velocity of the irregularities producing the scintillations does not vary systematically with distance: if it is assumed that these irregularities are carried at the bulk flow speed of the solar wind plasma then the solar wind has completed its accel-eration inside 15 Rxfor fast streams or inside 25 Rx for slow streams. Indeed a series of co-ordinated observations using EISCAT and the VLBA (Grall et al., 1996) showed that the fast high-latitude solar wind reaches its final
velocity inside 10 Rx, while velocities inferred from SPARTAN-201 observations suggest that the acceleration region may lie inside 5 Rx. These results place significant constraints on models seeking to explain the acceleration of the solar wind (Grall et al., 1996), although a simple model (McWhirter and Kopp, 1979) predicts that the main acceleration region should be inside 5 Rx.
It remains possible that IPS observations are sensitive to waves in the solar wind, with the observed scintillation being produced by the interactions of Alfve´n waves with the anisotropic medium. In this case the density fluctu-ations producing the scintillation would not be travelling at the bulk flow speed. If this is the case then the velocity of the ’scintillators’ remains constant over a range of distances covering 10—130 Rx and is comparable to the bulk velocity of the plasma observed by Helios at 60 Rx and at up to 600 Rxby Ulysses. Grall et al. (1996) attem-pted to estimate the bias to the velocity measurements introduced by Alfve´n waves travelling through an anisot-ropic microstructure and concluded that this was not a serious problem for measurements outside 6 Rx. This suggests that IPS is capable of measuring the bulk velocity of the solar wind at distances outside 10 Rx, the closest observation to the Sun discussed in this study.
Regions of interaction between fast and slow streams have been observed. Preliminary studies suggest that com-pressional interactions, produced when a fast stream over-takes a slow stream, might be the origin of the small proportion of velocities observed which fall between the normal fast- and slow-stream speeds. The flow of the solar wind may also become slightly off-radial in compressional interaction regions.
The recent series of IPS observations confirm EISCAT as an extremely powerful instrument for studying the solar wind. Normally the interpretation of effects that have been integrated along a line of sight is fraught with diffi-culties, but the bimodal distribution of solar wind velocity and the clear association of fast streams with coronal holes allow the analysis programme to integrate along the line of sight, crossing between fast-stream and slow-stream regimes at boundaries whose position can be de-rived from white-light coronograph measurements. The success of this analysis programme in fitting the observed data to provide physically believable and consistent para-meters fully justifies our confidence in the results obtained. It is now intended to use the same combination of EIS-CAT data and white-light maps to analyse the entire 1990—1995 dataset as part of a survey of the three-dimen-sional character of the solar wind. At the same time the successful launch of SOHO and planned improvements in the performance of the EISCAT system promise even better results in the future.
Acknowledgements. We would like to thank the director and staff of EISCAT for the data used in this study. EISCAT is supported by the scientific research councils of Finland, France, Germany, Norway, Sweden and the UK. We would like to express our special thanks to A. P. van Eyken and U. P. Løvhaug for their cooperation and assistance in running the IPS campaigns and to W. P. Wilkinson for discussions on fast-stream/slow-stream interaction regions. Two of us (ARB and PJM) are supported by PPARC.
Topical Editor D. Alcayde´ thanks J. F. Mckenzie and M. Pick for their help in evaluating this paper.
References
Armstrong, J. W., and W. A. Coles, Analysis of three-station inter-planetary scintillation, J. Geophys. Res., 77, 4602—4610, 1972. Armstrong, J. W., W. A. Coles, M. Kojima, and B. Ricketts,
Obser-vations of field-aligned density fluctuations in the inner solar wind, Astrophys. J., 358, 685—692, 1990.
Axford, W. I., and J. F. McKenzie, The solar wind, to be published in Cosmic ¼inds and the Heliosphere, 1996.
Bourgois, G., W. A. Coles, G. Daign, J. Silen, T. Turenen and P. J. S. Williams, Measurements of the solar wind velocity with EIS-CAT, Astron. Astrophys., 144, 452—462, 1985.
Breen, A. R., W. A. Coles, R. Grall, U.-P. Løvhaug, J. Markkanen, H. Misawa, and P. J. S. Williams, EISCAT measurements of interplanetary scintillation, J. Atmos. ¹err. Phys., 58, 507—519, 1996.
Cohen, M. H., G. J. Gunderman, and D. E. Harris, New limits on the diameter of radio sources, Astrophys. J., 150, 767—782, 1967. Coles, W. A., R. Esser, U.-P. Løvhaug and J. Markkanen,
Compari-son of solar wind velocity measurements with a theoretical accel-eration model, J. Geophys. Res., 96, 13849—13859, 1991. Dennison, P. A., and A. Hewish, The solar wind outside the plane of
the ecliptic, Nature, 213, 343—346, 1967.
Fisher, R. R., and M. Guhathakurta, Spartan 201 white-light corono-graph experiment, Space Sci. Rev., 70(1–2), 267—272, 1994. Geiss, J., G. Gloeckler, R. von Steiger, H. Balsiger, L. A. Fisk, A. B.
Galvin, F. M. Ipavich, S. Livi, J. F. McKenzie, K. W. Ogilvie, and
B. Wilkin, The southern high-speed stream: results from the SWICS instrument on Ulysses, Science, 268, 1033—1036, 1995. Grall, R. R., W. A. Coles, M. T. Klinglesmith, A. R. Breen, P. J. S.
Williams, J. Markkanen and R. Esser, Rapid acceleration of the polar solar wind, Nature, 379, 429—432, 1996.
Habbal, S. R., R. Esser, M. Guhathakurta, and R. R. Fisher, Flow properties of the solar wind derived from a two-fluid model with constraints from white-light and in situ interplanetary observa-tions, Geophys. Res. ¸ett., 22, 1465—1468, 1995.
McWhirter, R. P. W., and R. A. Kopp, The energy balance in the solar atmosphere above coronal holes, Mon. Not. R. Astron. Soc., 188, 871—881, 1979.
Phillips, J. L., A. Balogh, S. J. Bame, B. E. Goldsteen, J. T. Gosling, J. T. Hoeksema, D. J. McComus, M. Neugebauer, N. R. Sheeley, and Y. M. Wang, Ulysses at 50° south: constant immersion in the high-speed solar wind, Geophys. Res. ¸ett., 12, 1105—1108, 1994.
Phillips, J. L., S. J. Bame, W. C. Feldman, B. E. Goldsteen, J. T. Gosling, C. M. Hammond, D. J. McComus, M. Neugebauer, E. E. Scime, and S. T. Suess, Ulysses solar wind plasma observations at high southerly latitudes, Science, 1030—1033, 1995.
Schwenn, R., Large-scale structures of the interplanetary medium, in Physics of the Inner Heliosphere 1, Eds. R. Schwenn and E. March, Springer, Berlin Heidelberg New york, pp. 99—181, 1990. Sheeley, N. R., J. W. Harvey, and W. C. Feldman, Coronal holes, solar wind streams and recurrent geomagnetic disturbances: 1973—1976, Solar Phys., 49, 271—278, 1976.
.