HAL Id: hal-02352273
https://hal.archives-ouvertes.fr/hal-02352273
Submitted on 6 Nov 2019
HAL is a multi-disciplinary open access
archive for the deposit and dissemination of
sci-entific research documents, whether they are
pub-lished or not. The documents may come from
teaching and research institutions in France or
abroad, or from public or private research centers.
L’archive ouverte pluridisciplinaire HAL, est
destinée au dépôt et à la diffusion de documents
scientifiques de niveau recherche, publiés ou non,
émanant des établissements d’enseignement et de
recherche français ou étrangers, des laboratoires
publics ou privés.
The Caviar software package for the astrometric
reduction of Cassini ISS images: description and
examples
N. Cooper, V. Lainey, L.-E. Meunier, C. Murray, Q.-F. Zhang, K. Baillie, M.
Evans, W. Thuillot, A. Vienne
To cite this version:
N. Cooper, V. Lainey, L.-E. Meunier, C. Murray, Q.-F. Zhang, et al.. The Caviar software
pack-age for the astrometric reduction of Cassini ISS impack-ages: description and examples. Astronomy and
Astrophysics - A&A, EDP Sciences, 2018, 610, pp.A2. �10.1051/0004-6361/201731713�. �hal-02352273�
DOI:10.1051/0004-6361/201731713 c ESO 2018
Astronomy
&
Astrophysics
The Caviar software package for the astrometric reduction
of Cassini ISS images: description and examples
?
,
??
N. J. Cooper
1, 2, V. Lainey
2, L.-E. Meunier
2, C. D. Murray
1,
Q.-F. Zhang
4, K. Baillie
2, M. W. Evans
3, W. Thuillot
2, and A. Vienne
21 Astronomy Unit, School of Physics and Astronomy, Queen Mary University of London, Mile End Road, London, E1 4NS, UK 2 IMCCE, Observatoire de Paris, PSL Research Univ., UMR 8028 du CNRS, UPMC, Université de Lille 1, 77 av. Denfert-Rochereau,
75014 Paris, France
3 Department of Astronomy, Cornell University, Ithaca, NY 14853, USA
4 Department of Computer Science, Jinan University, 510632 Guangzhou, PR China
Received 4 August 2017/ Accepted 13 October 2017
ABSTRACT
Aims.Caviar is a software package designed for the astrometric measurement of natural satellite positions in images taken using the Imaging Science Subsystem (ISS) of the Cassini spacecraft. Aspects of the structure, functionality, and use of the software are described, and examples are provided. The integrity of the software is demonstrated by generating new measurements of the positions of selected major satellites of Saturn, 2013–2016, along with their observed minus computed (O−C) residuals relative to published ephemerides.
Methods.Satellite positions were estimated by fitting a model to the imaged limbs of the target satellites. Corrections to the nominal spacecraft pointing were computed using background star positions based on the UCAC5 and Tycho2 star catalogues. UCAC5 is currently used in preference to Gaia-DR1 because of the availability of proper motion information in UCAC5.
Results.The Caviar package is available for free download. A total of 256 new astrometric observations of the Saturnian moons Mimas (44), Tethys (58), Dione (55), Rhea (33), Iapetus (63), and Hyperion (3) have been made, in addition to opportunistic detections of Pandora (20), Enceladus (4), Janus (2), and Helene (5), giving an overall total of 287 new detections. Mean observed-minus-computed residuals for the main moons relative to the JPL SAT375 ephemeris were −0.66 ± 1.30 pixels in the line direction and 0.05 ± 1.47 pixels in the sample direction. Mean residuals relative to the IMCCE NOE-6-2015-MAIN-coorb2 ephemeris were −0.34 ± 0.91 pixels in the line direction and 0.15 ± 1.65 pixels in the sample direction. The reduced astrometric data are provided in the form of satellite positions for each image. The reference star positions are included in order to allow reprocessing at some later date using improved star catalogues, such as later releases of Gaia, without the need to re-estimate the imaged star positions.
Key words. astrometry – methods: data analysis – techniques: image processing – planets and satellites: general
1. Introduction
The Caviar software was initially developed at Queen Mary Uni-versity of London (QMUL) in 2003–4 as the Cassini space-craft was approaching Saturn. Its development fulfilled an im-mediate need for a software package capable of performing as-trometry of the Saturnian satellites using images recorded via the Cassini Imaging Science Subsystem (ISS). The software has since been used to generate approximately 5900 measure-ments of the positions of the Saturnian moons from Cassini ISS images (Murray et al. 2005;Cooper et al. 2008,2014,2015; Zhang et al. 2017), contributing a significant part of the astro-metric dataset recently used to provide observational constraints on Saturn’s internal structure (Lainey et al. 2017). Cassini ISS astrometry of Saturn’s satellites has also been performed by Spitale et al.(2006) andTajeddine et al.(2013,2015) using dif-ferent software, generating several thousands of observations.
? The Caviar software is available for free download from:
ftp://ftp.imcce.fr/pub/softwares/caviar.
?? Full Tables 1 and 5 are only available at the CDS via anonymous
ftp tocdsarc.u-strasbg.fr(130.79.128.5) or via
http://cdsarc.u-strasbg.fr/viz-bin/qcat?J/A+A/610/A2
Following an ongoing collaboration between the Cassini group at QMUL and the Institut de Mécanique Céleste et de Cal-cul des Éphémérides (IMCCE) of the Paris Observatory, Caviar has been extensively redesigned, incorporating a new graphical user interface (GUI) and a number of new options. This version of the software is now available to the community for general use, and in this paper we provide a broad outline of the features and capabilities of the new software, illustrated with examples. This paper is not intended to be a complete guide to using Caviar. For detailed parameter descriptions and instructions for use, we refer the reader to the user guide bundled with the software.
Caviar is written using the IDL language (Harris Geospatial Solutions). The computational capabilities of Caviar also rely heavily on the SPICE software toolkit (Acton 1996) as well as internal IDL routines and a number of other external IDL li-braries (see Sect. 3).
In addition to describing Caviar, in this paper we provide a total of 256 new astrometric measurements of the positions of five of the main moons of Saturn, reduced using the new version of the software. Observed-minus-computed residuals are pro-vided relative to the latest ephemerides from JPL and IMCCE.
A&A 610, A2 (2018) Throughout this paper, we use the Cassini ISS convention of
referring to the image pixel coordinate along the x-axis as “sam-ple” and the y-coordinate as “line”. For a detailed description of the Cassini ISS, seePorco et el.(2004).
2. Obtaining Caviar
The Caviar software is available for free download under the terms of a Creative Commons Attribution-NonCommercial-ShareAlike 4.0 International License1.
The software only, without SPICE kernels is available at the IMCCE website2.
At the time of writing, the Cassini mission is still in progress and mission-specific SPICE kernels typically cover relatively short time segments, requiring a large number of kernels to span the entire mission to date. For convenience, a complete set of SPICE kernels covering the Cassini tour from 2000 to 2016 has also been assembled to avoid the need to download them individ-ually. It is anticipated that, following the end of the Cassini mis-sion in late 2017, reconstructed and concatenated kernels will be made available, reducing the number of kernels required to cover the entire mission. New or updated kernels may easily be added as they become available, as described in the Caviar user guide.
A complete set of Cassini mission specific kernels (up to 2016) has been assembled for use with Caviar and is also avail-able from the IMCCE website3.
It should be noted that this file is approximately 6.3 Gb in size.
3. Requirements for running Caviar
Caviar has so far been tested on Mac OS X and Linux. The fol-lowing requirements are necessary in order to run Caviar:
– A full license for IDL.
– An active internet connection to allow access to star cata-logues via the Vizier web server.
– The IDL version of the SPICE toolkit4.
– SPICE kernels: Caviar accesses spacecraft instrument infor-mation, ephemerides, and other information relating to plan-etary bodies from SPICE kernels. At the time of writing, sev-eral hundred different kernels are needed to cover the Cassini tour. To simplify installation, a complete set of the kernels has been assembled for use with Caviar (see Sect. 2). Alter-natively, kernels may also be obtained from the NAIF web-site5.
– The CDSCLIENT package, used to access reference star in-formation via the Vizier web server6.
– The “wget” command must also be available, if not already installed.
Full instructions for the installation of Caviar are provided with the code.
4. Caviar graphical interface
The Caviar GUI is designed to fit on the device desktop and will automatically resize, with scroll-bars where necessary, depend-ing on the size of the screen. The main GUI consists of a sdepend-ingle
1 https://creativecommons.org/licenses/by-nc-sa/4.0/ 2 ftp://ftp.imcce.fr/pub/softwares/caviar 3 ftp://ftp.imcce.fr/pub/softwares/caviar 4 http://naif.jpl.nasa.gov:/pub/naif/toolkit/IDL/ 5 http://naif.jpl.nasa.gov/naif/data.html 6 http://cdsarc.u-strasbg.fr/ftp/pub/sw/
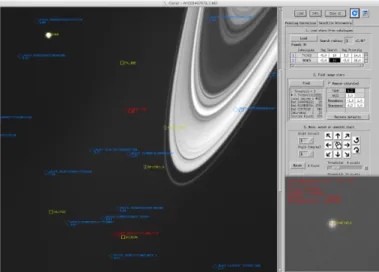
Fig. 1.Main Caviar graphical interface, showing part of an image from the Cassini wide-angle camera (W1559467979_1.IMG). In this exam-ple, the main image has been zoomed by a factor of two (the zoom factor is user-selected). Predicted positions of any known satellites or planets within the field of view, based on SPICE ephemerides, are shown in yel-low. Predicted catalogue star positions are shown in red and blue: stars labelled in red were successfully detected within the image, while those in blue, although within the field of view, were not detectable. When the cursor is within the main image window, the small zoom panel at the lower right follows the cursor position. The position of the cursor is labelled in real time, showing image coordinates, in addition to right ascension (RA) and declination (Dec), and radial distance from the cen-tre of the primary body (Saturn in this case). This small zoom window disappears when the refresh button is pressed (second button from top right) to reveal the additional tool buttons hidden underneath.
unit, showing the image on the left and the toolkit options on the right (Fig.1). When the cursor is inside the image frame, a small zoom window appears at the bottom right of the interface. Clicking the REFRESH button removes the small zoom window to reveal the toolkit options underneath. The main image can also be zoomed by selecting a factor from a drop-down menu at the top right.
In addition to displaying Cassini images with the positions of stars and solar system bodies labelled, Caviar is currently designed to perform two basic functions: correcting the camera pointing direction and measuring satellite positions.
5. Camera pointing correction
Caviar uses the fixed camera distortion model ofOwen(2003) to map from right ascension and declination to image pixel co-ordinates, based on the supplied camera pointing information.
The nominal camera pointing direction for a given image is based on information from the spacecraft star trackers at the time the image was taken, and is encapsulated in SPICE C-kernels (files with suffix. bc). For high-precision astrometry, Caviar pro-vides the means to correct this approximate pointing direction using the most up-to-date reference star catalogues. Before cor-rection, the nominal pointing error is typically of the order of 10 pixels, while after correction, an accuracy of 0.1 pixel can be usually be achieved with good reference star coverage. In the current version of Caviar, the UCAC5 (Zacharias et al. 2017) and Tycho2 (Høg et al. 2000) catalogues have been selected in preference to Gaia-DR1 (Lindegren et al. 2016) because of the lack of proper motion information in the first release of the Gaiacatalogue. However, the code can easily be modified by A2, page 2 of7
the user to access any desired catalogue by making the appropri-ate changes to the parameters in the Vizquery command inside the Caviar code. This is recommended as soon as the next release of the Gaia catalogue becomes available in 2018.
The pointing correction involves firstly the detection of star-like objects in the image, using the DAOPHOT Find algorithm (Stetson 1987). The positions of these imaged objects are then matched to nearby reference stars from the star catalogues. It may be necessary to perform an approximate alignment of the reference star field with the imaged stars, before matching, if the offset is more than a few pixels. This can be done by drag-ging the reference star field across the image, using either a mouse or the arrow buttons provided within the GUI. Following the approximate alignment of reference stars and imaged stars, the reference star positions may be iteratively fitted to the im-aged stars, minimising the observed-minus-computed residuals. The updated camera pointing information can then be saved to an output file which can also be loaded back into Caviar dur-ing a later session to avoid the need to re-estimate the pointdur-ing correction.
Examples
The number of detectable reference stars in a given image de-pends on the observation design parameters such as exposure length and on the catalogue star coverage for the particular patch of sky represented by the image. It has a direct bearing on the accuracy of the derived pointing correction. For example, Tajeddine et al.(2013) demonstrated how the computed camera twist angle converged to the expected value as the number of stars used in the estimation of the camera pointing correction was increased.
While images designed specifically for astrometry use ex-posure length values selected to provide optimum exex-posure of background stars, images designed, for example, for the study of moon surface features will often be underexposed for back-ground star detection. Although the default parameters are gen-erally satisfactory for most images, it may be possible to im-prove the detection of faint stars by modifying the star detection parameters in Caviar via the GUI. For example, for the image shown in Fig. 4, by modifying the FIND parameters Caviar is able to detect four stars, compared to only one star using the default values.
Regarding catalogue star coverage, in Fig.2we show an ex-ample of the better coverage available in the Gaia-DR1 cata-logue compared to that in Tycho2 and UCAC5. In this partic-ular image there are no catalogue stars of magnitude less than 12 within the field of view using the Tycho2 or UCAC5 cata-logues, while Gaia-DR1 has three. All of the catalogues have several stars of magnitude between 12 and 13, but they are not detectable. So although, as mentioned above, we have opted not to use Gaia-DR1 in the first release of Caviar because of the lack of proper motion information, this example indicates the potential benefits of the future full release of Gaia. The expo-sure length might still be an issue, however, and in fact no stars of any magnitude were actually detectable in this image, due to the short (70 ms) exposure duration, and consequently the point-ing correction could not be performed (this image is not included in the reduced dataset).
For images with no catalogue star coverage, or images with star coverage but no detectable stars, perhaps due to the choice of exposure length, it may still be possible to correct the camera pointing direction using other reference features in the image. Caviar allows circular rings of arbitrary radius, centred on the
Fig. 2.Image showing the potential improvement in star coverage us-ing the Gaia DR-1 catalogue. Stars of magnitude less than 12 from the Gaia-DR1 catalogue are superimposed on the image. There are no Ty-cho2 or UCAC5 catalogue stars of magnitude less than 12 in this image (N1843673269_1.IMG).
planet, to be projected onto the image. A published model of Saturn’s F ring (Cooper et al. 2013) can also be superimposed. The ring template can then be manually moved using the mouse buttons until it aligns with the imaged rings, allowing an approx-imate pointing correction to be performed without the use of ref-erence stars. The new pointing direction based on this manual alignment may then be saved. The actual statistical fitting of the ring model to the image is planned for future releases. We show an example of this in Fig.3, using an image of the main rings of Saturn, including the satellite Pan embedded in the Encke Gap. Models of the A ring edge and the F ring have been manually aligned with their corresponding imaged positions. Rings corre-sponding to other known radial features can easily be added by the user from a drop-down menu in order to constrain the align-ment further.
6. Measurement of satellite positions
6.1. Centroid measurement
For cases where the satellite of interest is not fully resolved in the image, a centroiding option is provided, allowing the position of the centre of light of the satellite to be estimated using essen-tially the same approach as that used to find star positions de-scribed in Sect. 5. This option requires a pre-existing ephemeris for the satellite, so that the position of its centre is approximately known. Having estimated the centre of light, an adjustment is then made to find the centre of figure based on the phase angle (camera-target-Sun angle) at the time of the observation. 6.2. Limb fitting
For satellites that are fully resolved in the image, a limb fitting approach is used to find the centre of figure of the satellite. In
A&A 610, A2 (2018)
Fig. 3.Ring features used as reference markers for the estimation of the camera pointing correction (image N1716498202_1.IMG).
addition to a pre-existing ephemeris for the satellite that gives the approximate position of its centre, this option also requires a model of the shape of the limb of the satellite. Currently, the shape model must be in the form of a SPICE ellipsoid. Caviar projects the SPICE ellipsoid onto the image, based on the camera pointing information, displaying it as a colour overlay.
The actual imaged-position of the limb of the satellite is first estimated using either of two options: a gradient-based edge de-tection method, or the Canny edge dede-tection algorithm (Canny 1986). The ellipsoidal shape model from SPICE is then itera-tively fitted to the measured limb position. The estimated astro-metric position of the centre of figure of the satellite then corre-sponds to the centre of the fitted shape model.
6.3. Examples
Caviar searches for the actual limb within the image within a user-defined threshold around the position represented by the projected limb model. This method has proven to be robust, given that the shapes of most satellites are well approximated by a projected ellipsoid model, even in the presence of irregu-lar surface features such as heavy cratering or equatorial ridges. However, there is a trade-off in terms of the level of distortion that can be tolerated in the limb fitting, although adverse effects can be mitigated to a certain extent by the choice of parame-ters selected via the GUI. While higher resolution images can, in general, be expected to lead to an increase in the precision of the measured centre of figure of a satellite, this can be partly offset by the corresponding improvement in the definition of irregular surface features that are not reproduced by the ellipsoidal limb model.
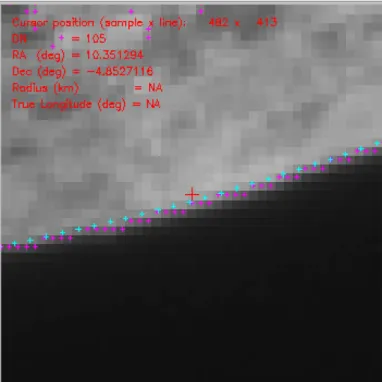
To illustrate this we show in Fig. 4 an image of Tethys (N_1809893546_1.IMG), where the orientation of the image is such that the large crater, Odysseus, distorts the limb edge. Figure5shows a magnified version of the area enclosed by the white box at the lower left in Fig.4. In this region, the limb is
adequately approximated by the projected ellipsoidal model and as a result, the detected limb, shown in magenta, closely follows the model, shown in cyan. Conversely, in Fig.6, which shows a magnified version of the area enclosed by the white box at the upper right in Fig.4, the distorting effect of the crater rim on the limb edge is clear, causing the detected limb to depart signifi-cantly from the position of the limb model.
The extent to which this influences the accuracy of the centre-of-figure measurement clearly depends on the level of ir-regularity of the limb in the image as whole. In this particular case, the limb is sufficiently well-behaved in terms of satisfying the ellipsoidal model over the bulk of the image for the effects of the localised distortion at the crater edges to be diluted. Interest-ingly, the O−C residuals for this image were −0.41 in line and 2.578 in sample relative to the JPL SAT375 ephemeris, suggest-ing a possible bias in the sample direction that could be due to the limb-distortion. However, the residuals relative to the NOE-6-2015-MAIN-Coorb2 ephemeris were −0.52 and −2.017 in line and sample, respectively, with a sample offset in the opposite di-rection. So the effects of the cratering distortion in this particular case do not seem to be significant, and the observed offset in the sample direction seems to be due to a difference between the two reference ephemerides.
This example also illustrates how the use of a digital terrain model that properly takes into account irregular surface features would be able to improve the effectiveness of limb modelling and fitting for images with particularly irregular shapes or significant surface distortion due to cratering. This capability is under de-velopment for a future release of Caviar (Sect. 9).
For further discussion and examples of the limb fitting tech-nique, including the origin of potential biases, seeCooper et al. (2014).
7. New observations
To illustrate the use of Caviar, we include a total of 256 new astrometric positions of five of the main moons of Saturn, Mimas (44), Tethys (58), Dione (55), Rhea (33), Iapetus (63), and Hyperion (3), for the period 2013 August 30 to 2016 June 04. While there is a high volume of data covering this period, we selected and reduced only the highest resolution images where the moons appeared large in size. As a consequence, these new data will provide the tightest constraints on the orbits compared to other ISS data of the same period.
The raw images were obtained from the PDS Imaging At-las7by searching the database for the chosen satellites, selecting only images taken using clear filters (CL1 and CL2). We cluded Enceladus from the list of chosen targets because of ex-isting published Cassini astrometry for the period 2004 to 2011 (Tajeddine et al. 2013,2015), as well as planned astrometry from more recent images (Zhang et al. 2017). However, four of the images for the selected targets also included Enceladus, so we include these detections here. Opportunistic sightings of Pan-dora (20), Janus (2), and Helene (5) are also included in this work. We excluded Titan because the thick atmosphere presents special challenges for astrometric measurement based on limb fitting which are beyond the scope of this current work. This will be the subject of future investigation.
The measured position of each satellite is provided in digi-tal form as a table of values, listing observation time, measured line and sample, equivalent right ascension and declination, and measured pointing information. Table1shows a small section of
7 https://pds-imaging.jpl.nasa.gov/search/
Fig. 4.Fully resolved image of Tethys with its main crater, Odysseus, at one edge. The original image has been zoomed by a factor of two and cropped. The area enclosed by the white box at the lower left is magni-fied in Fig.5, while the corresponding box at the upper right, on the up-per edge of the crater, is shown in Fig.6(image N1809893546_1.IMG).
Fig. 5.Zoom of the area enclosed by the white box at the lower left in Fig.4, showing how the detected limb (magenta) closely follows the projected ellipsoidal model (cyan).
the online table by way of example. The full table is available electronically from the CDS. Computed star positions (Table 5) are only available electronically at the CDS.
Fig. 6.Zoom of the area enclosed by the white box at the upper right in Fig.4, showing how the measured limb (magenta) departs from the ellipsoidal model (cyan) due to the distorting effect of the crater rim.
8. Observed minus computed residuals
For comparison, observed minus computed (O−C) residuals were computed relative to the current JPL ephemeris, SAT375, and latest IMCCE ephemeris, NOE-6-2015-MAIN-Coorb2. The SAT375 ephemeris represents a fit to Earth-based, HST, Pioneer, Voyager, and Cassini observations for the eight main moons of Saturn, plus Phoebe and the co-orbitals Telesto, Calypso, He-lene, and Polydeuces, using data up to 2015 FEB 02. The NOE-6-2015-MAIN-Coorb2 includes the same bodies except Phoebe. It should be kept in mind for the discussion which follows that neither of these two reference ephemerides used the new obser-vations included in this paper. So the observed-minus-computed residuals shown here are “pre-fit residuals”.
Line and sample residuals for each individual satellite are plotted as a function of time relative to the SAT375 ephemeris in Fig.7and as line versus sample in Fig.8. For direct comparison with Fig.8, the corresponding line versus sample residuals using NOE-6-2015-MAIN-Coorb2 are shown in Fig.9.
Mean residuals with standard deviations are listed in Tables2 and3for SAT375 and NOE-6-2015-MAIN-Coorb2 respectively, while Table4separately lists mean and standard deviations for Janus and Pandora relative to the SAT393 ephemeris.
Comparing Figs. 8and9, together with the values given in Tables2and3, the residuals are generally well-behaved relative to both reference ephemerides, although they show a significant offset for Mimas and Iapetus.
The residuals for Mimas are consistently smaller relative to the NOE-6-2015-MAIN-Coorb2 compared to the SAT375, sug-gesting a systematic difference in the two ephemerides for this satellite.
For Iapetus, the residuals show an offset relative to both ephemerides. We note that the typical resolution for the images of Iapetus is ∼6 km/px, so that in units of km, the mean val-ues of the residuals in the line and sample directions are ap-proximately (−13, 8) and (−8, 10). Iapetus has a mean radius
A&A 610, A2 (2018) Table 1. Sample of Cassini ISS observations
Image ID Mid-time (UTC) αc δc TWIST Line Sample α δ Body
(deg) (deg) (deg) (px) (px) (deg) (deg)
N1737793037 2013 Jan. 25 07:23:05.520 285.412852 36.716183 263.046719 609.39 510.68 285.454502 36.712389 RHEA N1741579125 2013 Mar. 10 03:04:09.504 270.623557 −60.595875 289.597775 513.66 485.34 270.618847 −60.587167 RHEA N1743357653 2013 Mar. 30 17:06:06.203 324.143836 66.000844 173.896805 515.52 511.77 324.143250 65.999481 DIONE N1745867263 2013 Apr. 28 18:12:40.241 279.208055 38.799972 263.343304 287.70 625.46 279.104368 38.769971 DIONE N1745867296 2013 Apr. 28 18:13:13.249 279.207869 38.800026 263.343304 332.70 603.70 279.124964 38.775671 DIONE
Notes. Columns αc, δc, and TWIST refer to the right ascension, declination, and twist angle of the camera’s pointing vector in the International
Celestial Reference Frame (ICRF), while α and δ are the right ascension and declination in the ICRF for the body listed in the far right column. The full table is available from the CDS. The origin of the line, sample coordinate system is at the top left of the image with line y increasing downwards and sample x to the right. Image size is 1024 by 1024 pixels.
Table 2. Mean values of O−C residuals in pixels relative to the JPL SAT375 ephemeris.
Nobs Line σline Sample σsample
Mimas 44 −1.14 1.57 −1.03 2.68 Enceladus 4 −0.01 0.24 0.13 0.07 Tethys 58 0.11 0.31 −0.05 0.52 Dione 55 0.05 0.30 −0.01 0.22 Rhea 33 0.01 0.24 −0.32 0.30 Hyperion 3 1.67 0.49 −2.71 0.12 Iapetus 63 −2.27 0.92 1.25 1.08 Helene 5 0.53 0.22 0.5 0.18 All 265 −0.66 1.30 0.05 1.47
Table 3. Mean values of O−C residuals in pixels relative to the IMCCE NOE–6-2015-MAIN-Coorb2 ephemeris.
Nobs Line σline Sample σsample
Mimas 44 −0.14 0.37 −0.63 1.02 Enceladus 4 0.03 0.24 −0.07 0.07 Tethys 58 −0.04 0.59 −0.12 0.40 Dione 55 −0.02 0.61 0.07 0.93 Rhea 33 −0.07 0.68 −0.22 0.57 Hyperion 3 2.59 0.49 −10.5 0.11 Iapetus 63 −1.36 0.90 1.76 1.04 Helene 5 0.07 0.23 −0.09 0.17 All 265 −0.34 0.91 0.15 1.65
of ∼735 km. The solar phase angle (observer-target-offset) for these images was generally in the range 40 to 60 degrees, which is advantageous for limb fitting purposes since the extent of the solar illumination of the limb increases with decreasing phase angle. However, Iapetus is notable both for its variable bright-ness and for a prominent equatorial ridge reaching an elevation of ∼13 km. We therefore believe that the most likely explanation for the observed offset in the residuals is a bias in the limb de-tection caused by the equatorial ridge: the orientation of Iapetus in the images is such that the brightest part of the limb also co-incides with its intersection with the equatorial plane, i.e. with the location of the ridge. The limb detection algorithm therefore preferentially locks on to this bright and anomalous feature and generates a bias in the positive sample and negative line direc-tion. This is consistent with the orientation of the observed offset in the residuals. An obvious solution to this is to use a more ac-curate digital terrain model which includes the equatorial ridge.
For a more general discussion of other potential sources of bias in the limb fitting process itself, the reader is referred to Cooper et al.(2014). 2013 2014 2015 2016 Year Iapetus Line RMS 2.45 -4 -2 0 2 4 Residual (pixel) Rhea Line RMS 0.23 -4 -2 0 2 4 Residual (pixel) Dione Line RMS 0.30 -4 -2 0 2 4 Residual (pixel) Tethys Line RMS 0.33 -4 -2 0 2 4 Residual (pixel) Mimas Line RMS 0.68 -4 -2 0 2 4 Residual (pixel) 2013 2014 2015 2016 Year Sample RMS 1.64 -4 -2 0 2 4 Sample RMS 0.44 -4 -2 0 2 4 Sample RMS 0.22 -4 -2 0 2 4 Sample RMS 0.52 -4 -2 0 2 4 Sample RMS 2.84 -4 -2 0 2 4
Fig. 7.O−C residuals relative to the JPL SAT375 ephemeris plotted as a function of time. Units are NAC pixels. Enceladus, Hyperion and Helene are not shown, due to the small number of observations for these satellites, but are included in Tables2and3. Two outliers for Mimas (−5.3, −14.7) and (−8.6, −10.9) and one for Iapetus (−5.9, 4.3) are not shown.
9. Summary and future work
The Caviar software in its original form has a proven track record in generating thousands of high-precision astrometric observations of the Saturnian moons using Cassini ISS images. The software is now available for general release in the form of the new and updated version described and demonstrated in this paper, incorporating a complete restructuring of the code and a new graphical user interface.
The structure of the code lends itself relatively easily to fur-ther modification within the framework of the IDL language and A2, page 6 of7
-4 -2 0 2 4 Sample (px) -4 -2 0 2 4 Line (px) Mimas -4 -2 0 2 4 Sample (px) -4 -2 0 2 4 Line (px) Tethys -4 -2 0 2 4 Sample (px) -4 -2 0 2 4 Line (px) Dione -4 -2 0 2 4 Sample (px) -4 -2 0 2 4 Line (px) Rhea -4 -2 0 2 4 Sample (px) -4 -2 0 2 4 Line (px) Iapetus -4 -2 0 2 4 Sample (px) -4 -2 0 2 4 Line (px) All
Fig. 8.O−C residuals relative to the JPL SAT375 ephemeris plotted as line residual versus sample residual. Units are NAC pixels. Enceladus, Hyperion, and Helene are not shown, due to the small number of ob-servations for these satellites, but are included in Tables2and3. Two outliers for Mimas (−5.3, −14.7) and (−8.6, −10.9) and one for Iapetus (−5.9, 4.3) are not shown.
Table 4. Mean values of O−C residuals in pixels relative to the JPL SAT393 ephemeris.
Nobs line σline sample σsample
Janus 2 1.10 0.23 −1.66 0.56
Pandora 20 −1.36 0.22 −0.50 0.14 the version described in this paper provides a useful basis for the addition of a variety of new options.
Planned options for future releases of Caviar include – The reduction of images from other spacecraft, including
Viking, Mariner 9, Voyager, Galileo, and New Horizons. – The option to import digital terrain models for satellite limbs
as an alternative to the ellipsoidal models used by the current version.
– The use of the next release of the Gaia star catalogue. – Options for batch processing of large volumes of images.
Acknowledgements. N.J.C. is grateful to the Paris Observatory for funding as an invited researcher at the IMCCE. We thank the FP7-ESPaCE European program for funding under the agreement No. 263466. N.J.C. and C.D.M. thank the Sci-ence and Technology Facilities Council (Grant No. ST/P000622/1) for financial support. This work was also supported by the International Space Science Insti-tute (ISSI). The authors thank their colleagues in the Encelade working group
-4 -2 0 2 4 Sample (px) -4 -2 0 2 4 Line (px) Mimas -4 -2 0 2 4 Sample (px) -4 -2 0 2 4 Line (px) Tethys -4 -2 0 2 4 Sample (px) -4 -2 0 2 4 Line (px) Dione -4 -2 0 2 4 Sample (px) -4 -2 0 2 4 Line (px) Rhea -4 -2 0 2 4 Sample (px) -4 -2 0 2 4 Line (px) Iapetus -4 -2 0 2 4 Sample (px) -4 -2 0 2 4 Line (px) All
Fig. 9. O−C residuals relative to the IMCCE NOE-6-2015-MAIN-Coorb2 ephemeris plotted as line residual versus sample residual. Units are NAC pixels. Enceladus, Hyperion, and Helene are not shown, due to the small number of observations for these satellites, but are included in Tables2and3. One outlier for Mimas (0.2, −5.6), one for Dione (−1.0, 5.3), and one for Iapetus (−5.1, 3.4) are not shown.
at the IMCCE of the Paris Observatory (http://www.issibern.ch/teams/ saturnastrometry/?page%20id=21), and the members and associates of the CassiniISS team. We are heavily indebted to the authors of the SPICE software toolkit, without whom the development of Caviar would have been a consider-ably more difficult task.
References
Acton, C. H. 1996,Planet. Space Sci., 44, 65
Canny, J. 1986, IEEE Trans. Pattern Analysis and Machine Intelligence, 8, 679
Cooper, N. J., Murray C. D., Evans, M. W., et al. 2008,Icarus, 195, 765
Cooper, N. J., Murray, C. D., & Williams, G. A. 2013,AJ, 145, 161
Cooper, N. J., Murray, C. D., Lainey, V., et al. 2014,A&A, 572, A43
Cooper, N. J., Renner, S., Murray, C. D., & Evans, M. W. 2015,AJ, 149, 1
Høg, E., Fabricius, C., Makarov, V. V., et al. 2000,A&A, 355, L27
Lainey, V., Jacobson, R. A., Tajeddine, R., et al. 2017,Icarus, 281, 286
Lindegren, L., and 83 coauthors, 2016,A&A, 595, A1
Murray, C. D., Cooper, N. J., Evans, M. W., & Beurle, K.,Icarus, 179, 222
Owen, W. M. Jr. 2003, JPL IOM 312.E-2003-001
Porco, C. C., West, R. A., Squyres, S., et al. 2004,Space Sci. Rev., 115, 363
Spitale, J. N., Jacobson, R. A., Porco, C. C., & Owen, W. M. 2006AJ, 132, 692
Stetson, P. B. 1987,PASP, 99, 191
Tajeddine, R., Cooper, N. J., Lainey, V., Charnoz, S., & Murray, C. D. 2013,
A&A, 551, A129
Tajeddine, R., Lainey, V., Cooper, N. J., Murray, C. D. 2015,A&A, 575, A73
Zacharias, N., Finch, C., Frouard, J., 2017,AJ, 153, 3043