HAL Id: hal-01581203
https://hal.inria.fr/hal-01581203
Submitted on 4 Sep 2017
HAL is a multi-disciplinary open access
archive for the deposit and dissemination of
sci-entific research documents, whether they are
pub-lished or not. The documents may come from
teaching and research institutions in France or
abroad, or from public or private research centers.
L’archive ouverte pluridisciplinaire HAL, est
destinée au dépôt et à la diffusion de documents
scientifiques de niveau recherche, publiés ou non,
émanant des établissements d’enseignement et de
recherche français ou étrangers, des laboratoires
publics ou privés.
Copyright
Multiscale Visualization and Scale-Adaptive
Modification of DNA Nanostructures
Haichao Miao, Elisa de Llano, Johannes Sorger, Yasaman Ahmadi, Tadija
Kekic, Tobias Isenberg, M. Eduard Gröller, Ivan Barišic, Ivan Viola
To cite this version:
Haichao Miao, Elisa de Llano, Johannes Sorger, Yasaman Ahmadi, Tadija Kekic, et al.. Multiscale
Visualization and Scale-Adaptive Modification of DNA Nanostructures. IEEE Transactions on
Vi-sualization and Computer Graphics, Institute of Electrical and Electronics Engineers, 2018, 24 (1),
pp.1014-1024. �10.1109/TVCG.2017.2743981�. �hal-01581203�
Multiscale Visualization and Scale-Adaptive Modification
of DNA Nanostructures
Haichao Miao, Elisa De Llano, Johannes Sorger, Yasaman Ahmadi, Tadija Kekic, Tobias Isenberg, M. Eduard Gr ¨oller, Ivan Bariˇsi´c, and Ivan Viola
Abstract—We present an approach to represent DNA nanostructures in varying forms of semantic abstraction, describe ways to
smoothly transition between them, and thus create a continuous multiscale visualization and interaction space for applications in DNA nanotechnology. This new way of observing, interacting with, and creating DNA nanostructures enables domain experts to approach their work in any of the semantic abstraction levels, supporting both low-level manipulations and high-level visualization and modifications. Our approach allows them to deal with the increasingly complex DNA objects that they are designing, to improve their features, and to add novel functions in a way that no existing single-scale approach offers today. For this purpose we collaborated with DNA nanotechnology experts to design a set of ten semantic scales. These scales take the DNA’s chemical and structural behavior into account and depict it from atoms to the targeted architecture with increasing levels of abstraction. To create coherence between the discrete scales, we seamlessly transition between them in a well-defined manner. We use special encodings to allow experts to estimate the nanoscale object’s stability. We also add scale-adaptive interactions that facilitate the intuitive modification of complex structures at multiple scales. We demonstrate the applicability of our approach on an experimental use case. Moreover, feedback from our collaborating domain experts confirmed an increased time efficiency and certainty for analysis and modification tasks on complex DNA structures. Our method thus offers exciting new opportunities with promising applications in medicine and biotechnology.
Index Terms—Nano, nanotechnology, assembly, multiscale, abstraction, DNA, origami, scale-adaptive modification
1 INTRODUCTION
All organisms have their construction plan stored in the exceptional macromolecule DNA. While the data storage capability of DNA using the four bases Adenine (A), Cytosine (C), Thymine (T) and Guanine (G) is broadly recognized, other outstanding features are less known. For instance, DNA double-helix molecules are extremely stable: they have a length of several centimeters but a diameter of just two nanometers (nms). Due to its great chemical stability, DNA can even be recovered from fossils several hundreds of thousands of years old [37]. Moreover, DNA can also fold into chemically reactive 3D structures such as the horseradish peroxidase mimicking G-quadruplex, which is an important signal reporter in biotechnological applications [49]. These properties as well as its sequence-dependent self-assembly capability and modern automated DNA production facilities have led to DNA becoming a building material for complex 2D and 3D nanoscale objects.
The resulting potential applications in medicine and biotechnology have caused DNA nanostructure research to progress rapidly. DNA vessels to transport and release drugs specifically at cancer cells, e. g., have been proposed [3, 16]. Andersen et al. [3] presented a DNA box with a controllable lid that can trap a cargo inside. Even significantly more complex structures such as DNA robots have already been de-veloped [43]. With the increasing complexity of DNA nanostructures, however, novel computational DNA design concepts are needed be-cause the current tools have been developed just for simple, static DNA objects. The current in silico design of nanoscale objects is a convo-luted process. The user has to manually consider many aspects to create a reliable structure that can be self-assembled in vitro later on.
• Haichao Miao, Johannes Sorger, M. Eduard Gr¨oller, and Ivan Viola are with TU Wien, Austria. e-mail:{miao | sorger | groeller | viola}@cg.tuwien.ac.at . • Haichao Miao, Elisa De Llano, Yasaman Ahmadi, Tadija Kekic, and Ivan
Bariˇsi´c are with the Austrian Institute of Technology. e-mail: {elisa.dellano .fl| yasaman.ahmadi.fl | tadija.kekic.fl | ivan.barisic}@ait.ac.at .
• Tobias Isenberg is with Inria and Universit´e Paris-Saclay, France. e-mail: [email protected] .
• M. Eduard Gr¨oller is also with the the VRVis Research Center, Austria. Manuscript received xx xxx. 201x; accepted xx xxx. 201x. Date of Publication xx xxx. 201x; date of current version xx xxx. 201x. For information on obtaining reprints of this article, please send e-mail to: [email protected]. Digital Object Identifier: xx.xxxx/TVCG.201x.xxxxxxx
We address this problem with a new multiscale visualization that allows experts to deal with DNA nanostructure objects of increasing complexity, to observe, inspect, and manipulate them at the level best suited for a given task, and to connect the different levels with each other using a continuous semantic abstraction that distributes the com-plexity among the scales. This approach allows domain experts to break down the DNA building blocks of their nanostructures into different distinguishable parts and thus different descriptions at several levels. Beginning at the lowest level of the atoms with their bonds, our seman-tic abstraction gradually simplifies the depiction and allows the experts to deal with increasingly complex nanoscale objects and their intended behavior. Moreover, we describe interactions with our representation that are designed in such a way that they are interpreted similarly, regardless of the scale at which they are being used. We implement our approach using a custom data hierarchy for DNA nanostructures within SAMSON [35], an established tool for the adaptive modeling and simulation of nanosystems. In summary, we contribute
• a problem characterization of designing DNA nanostructures and analyzing the problem from the perspective of visualization, • the enhancement of the nanostructure design process by reducing
complexity through a continuous semantic abstraction of the DNA representation across many multiple scales,
• the integration of consecutive detailed and abstracted representa-tions and the seamless, cohesive transition between them, • scale-adaptive interactions that facilitate consistent manipulations
of the nanoscale objects on multiple scales, and thus
• a general visual representation of DNA nanostructures that is able to depict the result according to different DNA design concepts.
2 DNA NANOSTRUCTURES
The creation of nanoscale architecture consists of two steps: (1) the object design on the computer and (2) work in the laboratory to ex-perimentally test the design. Because it can take weeks to months to carry out the experiments and finally assemble the objects in vitro, the computational design is crucial in assessing whether the structure will self-assemble in vitro. Visualization thus plays an essential role in optimizing an efficient in silico design of these structures. Before discussing the related work on molecular visualization and the require-ments for our new multiscale visualization, we review the domain background and terminology.
2.1 DNA
DNA (Deoxyribonucleic acid) is a macromolecule that consist of two single strands, paired and twisted around each other to form the char-acteristic double helix structure. The single-stranded DNA consists of smaller units called nucleotides or bases (A, G, C, T). A nucleotide is composed of a backbone and a side-chain. The backbone comprises a sugar with an attached nitrogenous base and a phosphate group. Nucleotides are connected via the phosphate group (5’ end) with the sugar of the next nucleotide (3’ end). Single-stranded DNA can bind to another strand via hydrogen bonds at their side-chains using base pair complementarity: T bonds with A and G bonds with C. A sequence of these nucleotides defines the specificity under which two single strands can be paired to create the double-stranded DNA, or duplex. Researchers in the field of DNA nanotechnology use these outstanding properties to manufacture custom shapes from synthetic DNA.
2.2 DNA Assembly Concepts
In 1982, Seeman [46] proposed to use the base pairing rules to bind parts of DNA strands together. Since then, DNA has become a building material for complex 2D and 3D nanoscale objects due to its sequence-dependent self-assembly capability and the establishment of modern automated DNA production facilities. In the last decade, three different design approaches were developed to create DNA nanostructures: DNA origami, wireframe, and DNA tiles. The general principle, however, is the same—they all are based on folding a DNA strand by making the parts of the sequence complementary to different strands. The specific DNA sequences thus have to be determined beforehand to facilitate the spontaneous assembly. The long strand is therefore often referred to as scaffold, while short strands are called helper or staple strands.
The most popular DNA nanostructure designs are based on a tech-nique referred to as DNA origami [41]. It uses hundreds of 20–60 bases helper strands to fold a long DNA scaffold (approx. 7300 bases) into a condensed DNA object. High magnesium concentrations are re-quired to facilitate the folding reaction and to stabilize the DNA origami nanostructures. The software caDNAno [14] supports the design of such objects [17]. In caDNAno, the user draws the schematic target structure in two orthogonal 2D interfaces. The rules of DNA origami are then embedded into the schematic representation. This process facilitates fast prototyping and provides the domain experts, in combi-nation with external online resources such as Cando [28], information on the stability of the structure. Furthermore, the schematic approach of caDNAno always aligns the duplex in parallel in one of the 2D views, whereas the target structure is three-dimensional. This setup requires the user to mentally reconstruct the 3D shape, for example to understand design constraints. To address this problem, caDNAno also provides a 3D interface that depicts the duplexes of the target structure as tubes. Detailed information on its composition, however, are only available in the 2D schematic view. The schematic view, therefore, is appreciated by many researchers for its high flexibility. With progressively intricate designs of nanoscale objects, the schematic view becomes overloaded with many connections and is, therefore, increasingly difficult to read. In our work, we ensure that we can load caDNAno designs and then propose our multiscale visualization as a complementary approach to enhance the current workflow.
In contrast to DNA origami, the so-called wireframe design ap-proach allows experts to create nanostructures that are stable at physio-logical ion concentrations, a characteristic that is important for potential in vivo applications. The wireframe structures also comprise a long scaffold and short helper strands but are less condensed and, thus, structurally more flexible. vHelix [8] and Daedalus [29] are the most popular tools to create these DNA objects. Daedalus uses an automatic approach [52] that takes a closed polyhedron as an input and produces the scaffold and staple strands in the atom representation as the result. This process, however, leaves the user with little control and only the high-level target geometry can be modified as an input. The other tool, vHelix [7], defines a pipeline for creating the target geometry using several scripts. vHelix allows the user to interact with the object on a nucleotide level such as breaking bonds or placing new nucleotides. In
contrast to Daedalus, however, less symmetrical structures are created and the pipeline works only semi-automatically.
Both Daedalus and vHelix need to route the scaffold over all edges of a target geometry. This approach is equivalent to finding an Eulerian circuit in a graph whose nodes and edges are the vertices and edges of the target geometry. Moreover, this problem is NP-hard [18] and both tools handle this complexity differently. vHelix might introduce dupli-cated edges to ensure a solution to the problem and runs an efficient systematic search to find an optimal routing. Daedalus, in contrast, doubles all edges and introduces new vertices to produce a cycle graph where finding an Eulerian circuit is a trivial problem. After the routing is finished, both tools apply different stapling algorithms to complete the DNA nanostructure. The disadvantage of this method is that, once the Eulerian circuit has been calculated and we wish to introduce new edges, the whole computation has to be repeated. We see our proposed method as complementary to these design concepts as we facilitate in-tuitive manipulations on all levels of detail, which is difficult to achieve with the existing methods.
The third design approach is based on DNA tiles that form periodic and large DNA nanostructures such as tubes and sheets. A single tile comprises only a few short single strands and is, in general, designed by hand due to its low complexity.
2.3 Overall In-Silico Design
In all of the mentioned three concepts, the experts start by creating an abstract description of the targeted geometry—a high-level plan of the objects they want to create. They describe the overall shape by vertices, edges, and sizes—without much attention to DNA-specific structural behavior. Next, they route the scaffold strand to create the overall shape and then place staples along the scaffold to fixate the shape. This process creates crossovers at appropriate locations to join parts of the scaffold together. The sequence of a strand also determines the stability and structural behavior [36], both of which have to be considered carefully during the process. For example, the melting temperature is assessed by the experts using external tools to roughly understand the stability conditions of the structure [28]. With this assessment in place, the experts further optimize the structure’s stability. Finally, the atomistic details are of interest. Low-level modifications can be carried out on the atomic scale where the nucleotides are modified to add additional function, such as creating binding sites for specific molecules. When a design is finished, the experts return to high-level tasks such as connecting different architectures with each other.
All three design principles described above allow domain experts to create DNA nanostructures that can be assembled in vitro. However, they are all based on modeling the DNA from scratch, rather than on effectively modifying existing assemblies. As technology moves to-ward increasingly intricate structures with many levels of detail, better computational tools are needed to assist in the design process. Optimal tools would support an iterative design process in which experts exam-ine the created structures at many levels of abstraction. This multiscale approach would allow them to assess the global shape and function as well as the mentioned smaller-scale and low-level properties.
The ability to inspect and modify the structure at many different levels of detail is thus essential for the whole process. High-level tasks are tedious to be carried out on a low-level representation, and vice versa. A multiscale approach would allow the experts to effectively assemble and test designs in silico, before testing them in vitro. For this purpose, we extend the assembly concepts described above with a multiscale visualization approach that supports the inspection and modification of DNA nanostructures in a scale-adaptive way.
3 RELATEDWORK
Visual models of biomolecular structures used for the depiction of DNA at atomistic detail can be divided into atomistic models and into illustrative (visually abstracted) models [20]. Atomistic models directly depict the chemical bonds or the surface of a molecule. Such a realistic depiction is necessary if the atomic structure itself is essential for determining molecular properties. The bonds convey the chemical properties of a molecule and are most commonly represented by (ball
and) stick models. We use this representation in our Scale 2. Surface models, in contrast, depict the interface between a molecule and its environment. Kozlikova et al. [25, 26] and Alharbi et al. [2] gave a comprehensive overview of such atomistic representations.
In large-scale models like a complex DNA machinery, large num-bers of atoms have to be displayed simultaneously. To facilitate the rendering of such complex scenes at interactive rates, many approaches use instancing and proxy geometry/impostor rendering [6, 31, 32]. In addition, illustrative and abstract models are used to convey features that are not or hardly visible in realistic atomistic visual representations. Further, they allow for a sparse, occlusion reducing representation of the dense atomistic data. Especially in large molecule complexes like DNA strands, higher-level molecular properties such as the overall shape and the chemical stability are typically of more interest than the atomistic detail. With the introduction of a cartoon representation for molecules [40], other abstract illustrations emerged, such as ribbons to schematize the helix structure, or arrows to indicate the secondary structures of molecules [22, 53]. These visually abstracted represen-tations are, specifically used for the visualization of DNA (and RNA) structures. The ladder-like double helix of the DNA is typically rep-resented by a ribbon or tube for the phosphate-sugar backbone and by sticks or ellipsoids for the nucleotide bases. We use several such abstractions in the higher scales of our representation.
Ellipsoids [1] and beads/spheres are used as generic abstractions for coarse-grained representations of DNA structures. A related rep-resentation was chosen by Benson et al. [7], which relied on spheres and arrows to depict the nucleotides and their direction in the design of DNA wireframe structures. The authors colored the spheres to in-dicate their affiliation to the respective staple or scaffold strand. We extend this idea and separate the information encoded in the spheres into our Scales 3–4 (see Fig. 2). Coarse-grained abstractions, in gen-eral, significantly reduce the geometric and visual complexity while retaining the high-level shape of a structure [13, 48]. Many of the listed examples are supported as standard representations by a wide range of molecular visualization tools (VMD [23], PyMOL [44], Chimera [15], and Maestro [45]) that are also used by our partners. In contrast to the visually more abstract coarse-grained representations, Cipriano and Gleicher [10] simplified the form directly from the molecular surfaces to preserve significant shape features and use surface glyphs to visually encode additional properties. In another approach, Cipriano et al. [11] used multiscale shape descriptors for surface meshes to statistically characterize surface regions of varying size. Later, Cipriano et al. [12] proposed a web-based tool for the analysis of molecular surfaces. The underlying algorithm abstracts the natural bumpiness of molecular sur-faces, while preserving large-scale structural features. Ertl et al. [19] combined isosurfaces of the ion density around molecules with stream-lines that indicate ion direction and velocity to analyze the motion of ions around the DNA in a nanopore. In our case, the overall shape of the DNA structure and, consequently, of the double helix is of the highest importance. In Scale 3, we abstract the atoms that of individual nucleotides into spheres that correspond to a beads representation. In-stead of using molecule shapes, we derive the visual properties of the various scales from the atom positions and the chemical properties.
Additional properties of molecular structures such as the base pair type or the chemical stability can be included in the three-dimensional representation of the molecules [6] or can be conveyed by multiple linked views. Bernier et al. [9], for instance, used a combination of 1D plots, 2D sequence diagrams, and 3D visualizations for the visual analysis of RNA structures in ribosomes. We directly encode the information in the color of the abstracted representations.
Approaches that support multiple molecular representations have also been proposed by several authors. Bajaj et al. [6] revealed molec-ular properties by blending together several biochemically sensitive level of details of molecular representations. Guo et al. [21] transi-tioned between LOD representations based on view distance. Van der Zwan et al. [33, 51] seamlessly transformed the visualization of a molecule along three independent abstraction axes: the structural abstraction level, the visual stylization, and the support of spatial per-ception. Krone et al. [27] proposed a molecular surface extraction
approach that can also be used for LoD renderings. The user can in-teractively adjust on a continuous scale the display of structural detail between atomic resolution and various levels of surface abstractions. We apply the same principle of seamless transitions between different representations of molecules. However, in our case the different visual scales are specifically designed to support certain tasks and we cover a large range of semantic scales. Asbury et al. [4] offered a visualization of the human genome at multiple scales with the GENOME tool. Simi-larly to our solution, each scale is intended to support a specific task. In GENOME, however, the different scales are displayed in separate windows while we provide a single interactive view.
4 MULTISCALEDNA NANOSTRUCTUREVISUALIZATION
The overall goal with this work is to address the needs of our collabo-rators for a better visualization and interaction support for designing DNA nanostructures as outlined in Sect. 2. For this purpose, we started to closely cooperate with a team of domain scientists working on DNA-based molecular diagnostics and DNA nanotechnology. Their research interest focuses on the development of highly innovative detection technologies including the creation of a cell-drilling DNA robot [5].
We started with a planning period over several months that Mun-zner [34] would describe as the characterization of the domain. During this time, we had six meetings involving junior and senior researchers from the visualization and the DNA nanotechnology fields to brain-storm research challenges and to discuss multiple conceptual ideas to address these challenges. Our main problem here was to find the appro-priate visual encoding for the DNA nanostructure design-process. The resulting discussions of different forms of abstraction for the DNA led to the insight that no single visual encoding would suffice to depict the intricate structures, in particular if also taking the interactive modeling aspect into account. We thus began to integrate several semantically different representations into a multiscale visualization.
Subsequently, this paper’s first author (FA) joined the DNA nan-otechnology group and spent 2.5 days per week for 3 months with them. Most closely involved in the discussions and the development of the concept were two domain experts, a female PhD student in physics and computational biology (C1, 30 years old) and the male Principal Investigator with a background in molecular biology (C2, 35 years old). In addition, a PhD student in chemistry (C3, female, 31 years old) focusing on DNA origami design and a PhD student in bioinformatics (C4, 28 years old, male) working on atomic details provided additional feedback throughout the development. C1 and C3 had a year of expe-rience, and C4 had less than one year of experience working on DNA nanostructure modeling/design, while C2 had 10 years of experience in single-stranded DNA design. All of them are co-authors of this paper. Occasionally, also other group members were consulted.
The core team consisting of C1–4 and the FA further developed the concept and the integration of the visualization into the software used by the domain experts. The FA conducted a number of informal interviews about the domain experts’ workflow and interaction challenges. Based on this, the FA together with C1–4 developed, in multiple iterations, the concept of using several distinct semantic levels of abstraction of the DNA structures, occasionally discussing the concept with the remaining authors of the paper. The FA reported the progress in regular presentations to the DNA nanotechnology group, where he gathered additional feedback to improve the concept. The implementation was carried out mainly by the FA and C1.
4.1 Overall Approach
With our multiscale visualization we do not aim to show different spatial scales (i. e., sizes) of the DNA macromolecules. Instead, we intend to display different semantic levels of abstraction. Each of these semantic levels is based on or inspired by traditional representations and fulfills a well defined purpose by highlighting specific features of the structure. While some of these scales reduce the level of detail of the depicted structures, others adapt the visually encoded information. Moreover, we order the semantic abstractions and allow the experts to seamlessly transition between them (see Fig. 1)—inspired by the continuous transition between primary and secondary structures for
0 1 2 3 4 5 6 7 8 9
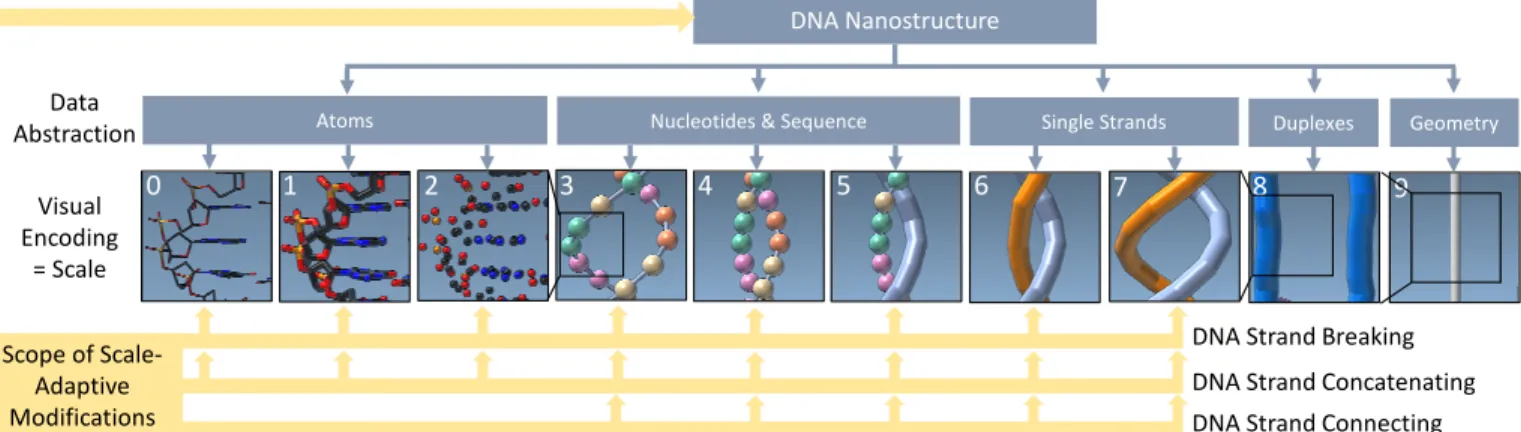
Atoms Nucleotides & Sequence Single Strands Duplexes Geometry DNA Nanostructure Data Abstraction Visual Encoding = Scale Scope of Scale-Adaptive Modifications
DNA Strand Concatenating DNA Strand Connecting DNA Strand Breaking
Fig. 1: The DNA’s atomic details are increasingly abstracted and seamlessly transitioned across ten semantic scales. Based on this multiscale visualization, scientists apply operations such as DNA strand breaking, concatenating, and connecting at different scales.
proteins from van der Zwan et al. [51]. In our approach, however, we not only explore a much higher number of abstraction stages and connect the molecular data to abstract, higher-level geometric struc-tures (e. g., wireframe representations) but also designed a number of interaction techniques that can be applied in a scale-adaptive fashion. This means that the interactions can be applied in a similar way at a number of levels (lower part of Fig. 1) and the specific interpretation is then automatically adjusted to the given level. This combined approach is thus novel not only in the field of visualization but also, for the first time, allows the scientists to inspect important aspects of the structures such as chemical stability, overall shape, and potential connection sites to other structures in a way that would be difficult to assess in a single visual scale. In addition, the different scales offer different entry points for editing the structures as we will discuss later in Sect. 4.4.
In the following detailed discussion we demonstrate our visual encod-ing on a sample dataset of a cube-shaped wireframe structure (Fig. 2). The cube was generated by our partners using the method described by Veneziano et al. [52]. Although it is a simple geometric primitive, a cube can be used as a basis for creating more intricate structures, as demonstrated by Andersen et al. [3]. The edges are built by two parallel DNA duplexes with 31 base pairs (bps) each, the edge length is 10.5 nm, and the entire cube consists of 1608 nucleotides (nts), 32903
atoms, one scaffold strand, and 20 staples.
4.2 Ten Semantic Levels of Abstraction
We begin the description at the lowest levels of abstraction. Scales 0–2 thus depict the DNA structures at the highest level of detail available, i. e., at atomic resolution. The main purpose of these scales is to facilitate manipulations of nucleotides on an atomic level. Such edits of the atomic structure are typically localized to particular sites to change the function of specific nucleotides. It is important that atomic composition and local and global geometry are easily available to scientists in order to complete these tasks. With input from our partners, we thus created three different visual encodings of the atomic structures that highlight various aspects.
In Scale 0 we display the atoms and bonds in the licorice represen-tation(Fig. 2(a)). The atom type is indicated by color. This common visualization is appreciated by our collaborators for its representation of the atomic bonds that hardly occlude the overall structure. Moreover, it allows them to efficiently spot the molecular geometry, e. g., the hexagonal and pentagonal shapes of the bases.
Scale 1 uses the sticks representation of the atoms and bonds (Fig. 2(b)). Here the bonds are thicker, i. e., the cylinders have a radius of 0.3 ˚A. This scale conveys the structure of the entire molecule better than Scale 0, especially if observed from a greater distance.
Scale 2 shows only the atoms as balls with a radius of 0.35 ˚A, without bonds (Fig. 2(c)), highlighting the different atoms of the DNA.
Next, in Scales 3 and 4 we represent each nucleotide as a sphere with a radius of 1.6 ˚A that we call nucleosphere. By reducing the visual clutter of Scales 0–2 we achieve a cleaner depiction of the overall
geometric structure and a more direct representation of the chemical composition of the DNA strands. The color of each nucleosphere indicates one of the four bases (T: orange; A: green; G: yellow; C: pink). The connection of the backbone is depicted by cylinders between the spheres with radii 0.32 ˚A. This encoding allows the scientists to analyze the sequence of the DNA strands. Scale 3 and 4 differ from each other in the spatial encoding of the nucleotides, each encoding conveying a different aspect of the helix structure.
We newly developed the spatial encoding of nucleotides in Scale 3. Here we highlight the potential crossovers between helical DNA strands. These crossovers are exploited in DNA nanotechnology to connect a long strand at different locations. Because crossovers can only appear at locations where the strands come close (i. e., where the double helices turn towards each other), we encode their proximity (Fig. 2(d)). Exist-ing crossovers are displayed by long gray connections between double helices. We position the spheres in this scale at the center of mass of the atoms in the sugar and the phosphor group, with the weight of each atom set to 1—this weight standardization is crucial for the depiction of the helix turns. Taking the actual atomic weight into account would result in an irregular pathway of the single strands.
The nucleosphere layout in Scale 4 more clearly shows the nu-cleotide pairs (Fig. 2(e)). We achieve this representation by setting the nucleosphere positions to the centers of the side-chains. The small turns of the double helices make it easy to observe the pathway of the single strand as well as of the duplex. In more densely packed scenes, this compressed spatial encoding also better conveys the strands that are part of the same duplex. Potential crossovers, however, are more difficult to spot. We deliberately omit the explicit depiction of connections between paired nucleotides to avoid an otherwise cluttered representation. Moreover, the pairing information can be read from spatial proximity alone, according to our collaborators.
In most DNA designs, a long scaffold strand is used as discussed in Sect. 2. While the location, length, and sequence of the staple strands can be adapted during the modification of DNA structures, the scaffold strand and its sequence remain constant. In Scale 5 we thus visually separate the scaffold strand from the staple strands (Fig. 2(f)) to allow the scientists to focus on the composition of the staples. We achieve the explicit visual separation by replacing the nucleosphere representation of Scale 4 with what is called the single-strand representation. The single strand is uniformly depicted as a gray tube of radius 1.6 ˚A.
In Scales 6 and 7 we display the scaffold and staple strands in the single-strand representation. We abandon the nucleosphere base infor-mation to allow the scientists to focus on the strands’ spatial composi-tion. To visually separate the staple strands from the scaffold, we color them using a set of eight colors. We call this representation plaiting due to its resemblance to basket plaiting. Analogous to Scales 3 and 4, Scales 6 and 7 differ in their spatial strand layout.
In Scale 6, we route the single strands along the nucleobases (analo-gous to Scale 4). This representation clearly shows how the scaffold is approximating the geometric shape of the intended target structure
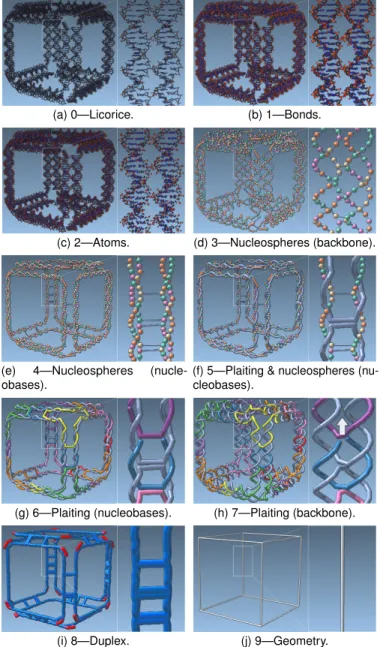
(a) 0—Licorice. (b) 1—Bonds.
(c) 2—Atoms. (d) 3—Nucleospheres (backbone).
(e) 4—Nucleospheres (nucle-obases).
(f) 5—Plaiting & nucleospheres (nu-cleobases).
(g) 6—Plaiting (nucleobases). (h) 7—Plaiting (backbone).
(i) 8—Duplex. (j) 9—Geometry. Fig. 2: The ten scales of our multiscale visualization, from high detail (lowest abstraction) to low detail (highest abstraction).
(the cube in our example). Fig. 2(g) shows how the three edges come together at each vertex of the cube and demonstrates that the edges, at each high-level geometry vertex, are held together by one staple strand. Along the high-level edge, one staple holds two parts of the scaffold together, thus creating rigidity. The long straight edges of the staples at crossover locations are a result of this spatial encoding and do not contain any nucleotides, which would be revealed in a lower scale.
Scale 7, in contrast, depicts the strands along the backbone of the DNA (analogous to Scale 3) to indicate the locations of potential crossovers. While Scale 3 depicts the nucleotide details of the strands, it can be difficult to determine the specific strand to which a sequence of nucleotides actually belongs, especially in cluttered structures. The more abstract representation in Scale 7 clearly separates the individual staple strands from each other, enabling the user a stronger focus on potential crossovers between individual strands. In Fig. 2(h) the arrow indicates a potential crossover location of the scaffold.
In Scale 8 we merge the paired strands of a double helix into a single tube representing the duplex (Fig. 2(i)), placing it along the center of the two paired strands. This highly abstract representation of the double helix allows the scientist to focus on higher-level properties of the design that are otherwise difficult to see. In this scale, we highlight in red the non-paired regions at the vertices of the target structure. These
(a) (b)
Fig. 3: Two metrics for assessing stability: (a) the melting temperature (20–75°C) and (b) the Gibbs free energy (0 to −10.000 kcal/mol). Both properties are mapped to a color scale (red: low stability; blue: high stability).
regions are of particular interest because, in wireframe designs, staple strands that span over two adjacent edges are used. At these points, the DNA double helices have to bend and it has been shown that unpaired sequences such as those depicted in red can help bending (a sequence of Ts or polyT) [47]. The polyT region can also be observed in Scale 5, but Scale 8 more clearly shows that each vertex of the cube is modeled with three polyT regions. In addition, the target structure’s geometric shape as well as the crossovers and junctions between duplexes become clearer. The zoomed-in view in Fig. 2(i), for instance, shows that the cube edge has three crossovers.
Scale 9, finally, depicts the input geometry from the mesh-based DNA structure generation ( [7,52]). It allows the scientists to verify how faithful the structure generation algorithm approximated their input design. The two parallel strands of Fig. 2(i) represent a single edge of the cube in Fig. 2(j). Angles between edges can be clearly inspected at this scale, an aspect that is of great importance to our partners. For example, it is suspected that certain angles have an adverse effect on the structure’s overall stability.
Together, the ten scales are the foundation of our visualization ap-proach. Next we describe a number of specific representations for visualizing local properties, before focusing on the seamless interpola-tion of the scales and the interacinterpola-tions they facilitate.
4.3 Stability Assessment
One challenge in DNA nanotechnology is to create structures that are stable under many conditions. The melting temperature is a metric that is widely employed to analyze the stability of two-paired synthetic DNA strands. It is defined as the temperature at which 50% of the sample has denaturated to single-stranded DNA and can be computed using a thermodynamical model [42]. Binding regions with a high melting temperature thus are more stable than those with a lower temperature. The Gibbs free energy [42] is another stability metric. It is related to the melting temperature, is relevant in DNA structure design, and is important for our collaborators. For negative energies, the binding reaction is spontaneous and the duplex state is preferred over the single-stranded state. This means binding regions with negative energy are more stable than regions with a positive one.
We thus included both metrics in our visual encoding to allow the sci-entists to identify potentially unstable parts of the structure and to inter-actively optimize them with the operations introduced in Sect. 5. First, we define the binding regions for which the metrics are computed—i. e., those parts of the duplex that are not interrupted by an end or a junction. Then, we map both metrics to a color scale between red and blue and display them at each binding region directly on the scaffold strand to in-dicate the local stability (Fig. 3). Both metrics can be displayed at those scales where the scaffold is displayed as a single strand, i. e., in Scales 5–7. In Scale 5, the scientists can analyze the nucleotide sequence that is responsible for the stability. Complementary to this analysis, Scale 6 and 7 show the influence of the staple length and binding regions on these properties. We also allow the users to toggle the visibility of the staple strands when activating the depiction of either metric (Fig. 3).
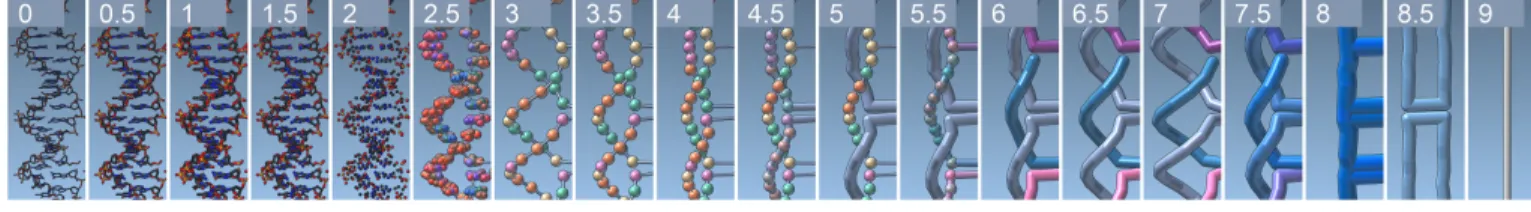
Fig. 4: Seamless transitions between two neighboring scales through linear interpolation.
4.4 Seamless Transitions Between Scales
Beyond the individual scale representations discussed so far, for being able to successfully interpret and effectively work with the semantic scales the scientists have to be able to mentally integrate the depicted information. We assist them in this task with a seamless transition between the scales, which supports mental integrations better than multiple linked views. In our case, the latter would require at least ten independent views, reducing the space available for each individual view. We thus co-register all scales with each other on the data level and then linearly interpolate between the corresponding positions, radii, and colors of the displayed visual elements. This interpolation allows the viewer to understand the relationship between the scales and interpret their composition correctly. Fig. 4 demonstrates the transition between the scales, showing the scales and the results of the interpolation half-way in-between each pair of consecutive scales.
The transitions between the atomic scales (Scales 0–2) are straight-forward: the radii of the bonds and atoms are linearly interpolated. Next (Scales 2–3), we grow, relocate, and change the colors of the atoms until they merge into nucleotides. At the same time, we let a tube appear to represent the backbone and, later, the connection between the nucleospheres. As we transit from Scale 3 to Scale 4 we relocate the nucleospheres from their backbone positions to the newly developed side-chain arrangement. To move to the plaiting representation from here, we first grow the connecting backbone tube of the scaffold strand until it hides the nucleospheres (Scale 5), before doing the same for the staples (Scale 6). Next, we relocate the scaffold and staples back to their backbone positions (Scale 7). Then we relocate both and merge them into a single double helix representation depicted in blue (Scale 8). The final transition merges parallel double duplexes into single edges of the target geometry (Scale 9), in particular to allow the scientists to understand the scaffold routing along the edges of the target structure. This transition avoids Schlegel diagrams to project the geometry from 3D to 2D for demonstrating the scaffold routing as done in previous work [7, 52]. In practice, scientists can precisely and intuitively transi-tion between the ten scales using a slider or by direct scale entry and thus relate neighboring scales to each other.
5 SCALE-ADAPTIVEDNA MODIFICATION
In addition to having a visualization that allows the scientists to view, ex-plore, and understand the different abstraction levels, an essential goal of our work is to enable them to make modifications to their designs. Such operations are crucial for increasing a structure’s chemical and structural stability as well as for the assembly of individual structures into more complex architectures or even robots. These interactions, however, are not independent from the multiscale visualization, but have to be applied to a specific or a range of semantic abstraction levels, depending on the given task. Therefore, we created scale-adaptive mod-ificationsof the DNA structure at all scales where individual strands are visible. With scale adaptive we refer to the execution of each operation so that it is adapted to the semantic granularity, i. e., the visual level of abstraction of each scale. The same operation can thus be carried out on atoms, nucleotides, or single strands, but with an impact that is consis-tent across all scales. Visual elements can be selected across all scales for this purpose. In Fig. 5, for instance, the selection is carried out directly in Scale 4 by simply clicking on a nucleosphere—in contrast to individually selecting all scattered atoms/bonds of a nucleotide.
Below we first describe three basic operations that we currently sup-port. Then, we discuss how these operations are applied in three specific tasks that are essential for the modification of DNA nanostructures.
5.1 Basic Scale-Adaptive Operations
All of our modifications are single-strand operations, which are widely employed in DNA manipulation. They can be carried out on the atomic scales (0–2), the nucleotide scales (3–5), and the single-strand scales (5–7). It does not make sense, however, to carry out single-strand operations on Scales 8–9, as they are visual encodings of higher-level abstractions, such as duplexes and edges. Nevertheless, the results of the operations are visible on all scales. To facilitate the manipulations, we allow the scientists to select visualization elements based on the depicted scale. On the atomic and nucleotide scales, individual atoms, nucleotides, or the bonds between them can be selected. On single-strand scales, a specific position on the single-strand can be selected which, internally, corresponds to a specific nucleotide within the strand.
Strand Breaking: This operation breaks the DNA backbone by removing the bond between the P and O 3’ end atom in the 3’ end direc-tion, splitting one strand into two. Experts use this modification to cut strands, to shorten them, or to prepare them for crossovers. Depending on the scale, users can break a bond directly between specific atoms (Scales 0–2), between specific nucleotides (Scales 3–5), or between specific locations on a DNA strand (Scales 6–7). On the nucleotide and single-strand scales, we thus remove the bond that corresponds to the 3’ end direction of a selected nucleotide. On the atomic scales, scientists specify the specific atom at a bond location between nucleotides or the bond itself that they want to remove. We propagate the effect of this operation to every scale as shown in Fig. 1 and Fig. 5.
Strand Concatenating: This operation is inverse to strand breaking and is also shown in Fig. 5. Two strands can be merged if their 3’ and 5’ nucleotide ends are direct neighbors. Analogous to strand breaking, for Scales 3–7 we add the bond that corresponds to the 3’ end direction of a selected nucleotide. In Scale 0–2, the scientists have again full control and can select the specific atoms to create a new bond. With such strand concatenating operations scientists can create crossovers and merge several short strands into a single longer one.
Strand Connecting: In contrast to strand concatenation, strand connectingjoins two single strands by adding a user-specified sequence of nucleotides (Fig. 6). Scientists use this operation to make a longer connection between two strands. The number of nucleotides that are necessary to bridge the gap between disconnected strand ends can be manually adjusted and is estimated. We divide the length between the two selected ends by the approximate radius of a nucleotide. Our collaborators estimate this radius to be 0.35 nm in analogy to B-DNA structural properties, even though we are manipulating single-stranded DNA. We then ask the user to specify the desired nucleotide sequence (see dialog in Fig. 9(b)). We place this sequence on a straight line between the previously selected nucleotides. We intentionally do not pair the newly created single strand with a complementary strand. Therefore, it does not have the characteristic helix shape. Moreover, the number of nucleotides in the sequence considerably influences the conformation of atoms. The atom placement can thus only be accurately calculated by a molecular dynamics simulation, which is outside the scope of this work. In contrast to the other elementary operations, the strand connecting operation also does not make sense for Scales 1 and 2 because it would be too tedious.
5.2 Applications in DNA Structure Modeling
The scale-adaptive basic operations are illustrated with three higher-level operations, frequently carried out by our collaborators for DNA structure modeling.
struc-B r e a k C o n c a te n a te
0
1
2
3
4
5
6
7
Fig. 5: Breaking & concatenating single strands, in multiple scales. After changes are done in one scale, we propagate the effects to other scales. Breaking a single strand does not break the double strand, thus Scales 8 and 9 are not visually affected.
0
1
2
3
4
5
6
7
9
Molecular Dynamics Simulations
C o n n e ct
Fig. 6: Strand connection with a user-specified sequence. Here, atomic scales are out of scope because the atom and bond conformation is subject to molecular dynamics simulations. The higher-level representations in Scales 8 and 9 are also out of scope.
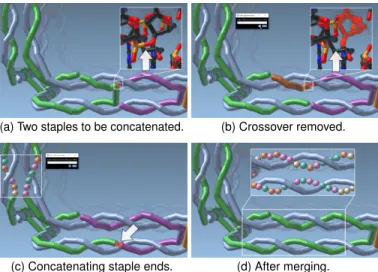
(a) Two staples to be concatenated. (b) Crossover removed.
(c) Concatenating staple ends. (d) After merging. Fig. 7: Strand Merging. The green and violet staple strands are to be merged. First the crossover is removed by breaking the strand. The strand ends are then concatenated. Views in other scales are included manually for demonstration purposes.
(a) (b) (c) (d)
Fig. 8: Creating crossovers using scale-adaptive operations: (a) at a potential scaffold crossover location (arrow), the scaffold is broken, (b) first the right strand then (c) the left strand; (d) the newly created ends are concatenated.
ture’s chemical stability. The scientist may merge two short staples to form a longer strand as shown in Fig. 7. The scientist starts by selecting the respective position to interrupt the crossover of a staple (green in Fig. 7(a)). As mentioned above, Scale 6 is well suited for this task because it prominently shows the crossovers. This operation results in two new, separate strands (green and brown in Fig. 7(b)). Next, the scientist applies the strand concatenation operation to connect the previously separate staples. First the brown and the purple strands in our example are connected to yield the longer purple strand in Fig. 7(c). Then the purple and the green strands are connected (see Fig. 7(d)). The result of the operations is a longer single staple, without a crossover. The closeups in Fig. 7 demonstrate how the scale-adaptive operations are propagated to the nucleotide and atomic scales.
Crossover Removal & Creation: The strand merging operation just discussed was demonstrated for the important operation of remov-ing a crossover. In addition to this crossover removal, DNA
nanostruc-(a) Before (5’ and 3’ end selected). (b) Sequence input.
(c) Connected staple. (d) Added sequence. Fig. 9: Prolonging staples with a user specified input sequence. ture design often requires the opposite operation: creating a crossover. Scientists thus start by inspecting the structures for potential crossover locations, which our Scales 3 and 7 support best. If the double he-lices are aligned in parallel, these locations appear every 10.5 base-pairs at one full helix turn. For example, Fig. 8(a) shows a potential crossover in the scaffold strand (gray), indicated by an arrow. Again using strand breaking, scientists interrupt the previously continuous scaffold (Fig. 8(b) and (c)). Then they re-connect the loose ends using strand concatenating operations to establish the crossover (Fig. 8(d)).
Strand Prolongation: Beyond the local operations, it is sometimes also necessary to add entirely new strands. These are either new pillars to increase the rigidity within a DNA structure or binding sites for other molecules that can add new functional behavior to an existing structure. For both tasks, scientists can now use the strand connecting operation we provide. The example in Fig. 9 demonstrates this operation by adding a diagonal to the cube. First, the scientists select two strand ends (arrows at green and red staples in Fig. 9(a)) and then enter the new nucleotide sequence from the 5’ to 3’ direction (Fig. 9(b)) based on the estimated length (20.5 nm) and suggested number of 60 nucleotides. Our strand connecting operation then adds the new strand (Fig. 9(c)), which can also be inspected in other scales (Fig. 9(d) shows Scale 4).
6 IMPLEMENTATION ANDPERFORMANCE
We implemented our concept within a nanostructure design suite, which our partners are developing, based on the established SAMSON [35] platform for fast prototyping in computational nanoscience. The im-plementation can thus be used for other projects with the SAMSON
framework. Specifically, we use SAMSON’s capability for illustra-tive rendering of geometric primiillustra-tives. SAMSON itself takes care of the specific GPU-based implementations of the primitives, while we compute the transitions on the CPU. For our data model we directly extend SAMSON’s data graph and its logic to realize the multiscale visualizations and scale-adaptive modifications. We also use the ntthal package from the Primer3 software [50, 54] for calculating both melt-ing temperature and Gibbs free energy. Based on a loaded project, we automatically create all scale representations. The user interface com-prises a 3D view for basic interactions. The representation is precisely controlled through a single slider to depict the current (interpolated) scale. Depending on the scale, the user can select all visible elements and apply the scale-adaptive operations through respective buttons. We tested the implementation on a laptop with an Intel Core i7 CPU and an Nvidia GTX 1060 GPU. For the datasets shown in this paper, we achieve approx. 20 fps including the transitions—fast enough for a smooth exploration and fluid interaction.
7 EXPERIMENTALRESULTS ANDVALIDATION
Our approach applies to structures from different concepts and we make, e. g., no difference between DNA origami or wireframe structures. First, we discussed the feedback on two different designs of a cage received from focus group discussions with our collaborators. Next, we present a case study that demonstrates how different components can be connected with each other, to create a higher order of nanoscale devices. We show the realization using our approach, compare it to the existent approach, and report a tremendous increase in time efficiency.
7.1 Focus Group Discussions
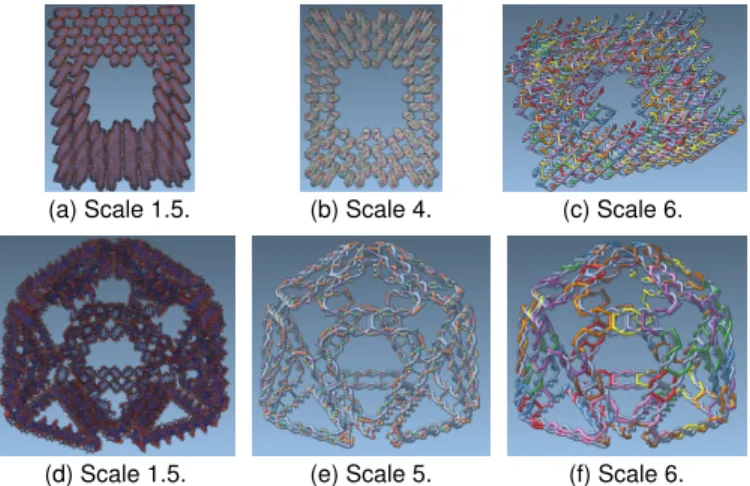
The cage shown in Fig. 10(a)–(c) is a DNA origami structure with an estimated height of 16 nm. We loaded the structure into our system and demonstrated it to C3, the creator of this object. The familiarity with the data allowed her to make a direct comparison to the existing tools she was used to. In contrast to tools such as caDNAno, she immediately appreciated the ability to analyze the structure in 3D. In contrast to the limited 3D views, existing in some established tools, where one “cannot see much,” she particularly appreciated our novel way to show all important details depending on the chosen semantic scale. She noted that the multiscale concept allows her an “all-in-one” solution for the design of structures with modified behavior that would require scientists with different specializations. While the design of the static nanostructure could be done by her using Scales 3–7, another scientist (e. g., C4) can work on the same dataset and modify the atomic details available in the Scales 0–2. The multiscale concept thus provides them with a collaboration possibility that did not exist before. Furthermore, Scale 4 was appreciated for its “straightforward” representation of the single strands and their sequences. Before, this information could only be obtained by combining two views. Although C3 appreciated the color coding of the nucleotides, she would have preferred an optional labeling, especially while still unfamiliar with the software. In Scale 5, she could clearly see and understand the sequence of staples along the paired scaffold due to the 3D depiction. For her work, she stated, Scales 6 and 7 are the most useful ones as they allow her to inspect the staple placements. A limitation of our approach for DNA origami structures is, however, that we cannot display all scales: the duplex representation of Scale 8, which is computed as the center of two paired bases, is not available in the data and Scale 9 is missing because DNA origami structures have no underlying geometry definition.
When asked about modifications, she saw no need to change this structure because the design was already mature. She stated, however, that the abstractions and visual encodings are “simple” and easy to understand—a prerequisite for efficient modifications. C3 also asked to see the computational predictions of the solution shape, but such a representation would require an advanced finite-element analysis, which is beyond the scope of this work. Furthermore, C3 suggested to create an untwisted and parallel representation of two paired single strands, a feature which we plan to add in the future. Overall, C3 highly appreciated our visualizations and asked us to integrate them with her current tools to enhance the nanostructure design workflow.
(a) Scale 1.5. (b) Scale 4. (c) Scale 6.
(d) Scale 1.5. (e) Scale 5. (f) Scale 6. Fig. 10: A DNA origami (top) and a wireframe structure (bottom).
In a second focus group, we discussed the wireframe cage shown in Fig. 10(d)–(f), created using the approach by Veneziano et al. [52]. This object is larger and more complex than the cube we used as an example throughout the paper. Our partners’ current approach for modifying such structures is to interact on the atomic level to connect staple strands or to change the input to the entirely automatic pipeline. Considering the large number of atoms and bonds, this is a very tedious process that, according to our partners, was up to now only possible in this way. Moreover, any change to the input polyhedron has a global effect in the current approach, resulting in the scaffold being rerouted and the staples being replaced. With our approach, we allow the scientists to modify the structure at all scales, always with local effects. C1 stated that she is very satisfied with this possibility—it allows her to inspect the structure in a “high-level” visualization that goes beyond atomistic representations. C1 is working on the development of DNA algorithms for wireframes, and she mentioned that our visualizations assist her a lot in the process. In general, the edges and vertices of the targeted architecture can be much easier recognized in Scales 3–8 than with atomic details. The routing of the scaffold strand along the edges is an important task, as described in Sect. 2, and can be inspected in Scales 5 and 6. The placement of staples completes the wireframe design. According to the C1, our Scales 6–7 were often used to inspect the placed staples. Finally, the transitions from Scale 9 to 0 allows her to comprehend the link between the input data and the resulting DNA wireframe design. No conventional tool provides this interaction, which drastically simplifies the design process.
7.2 Case Study
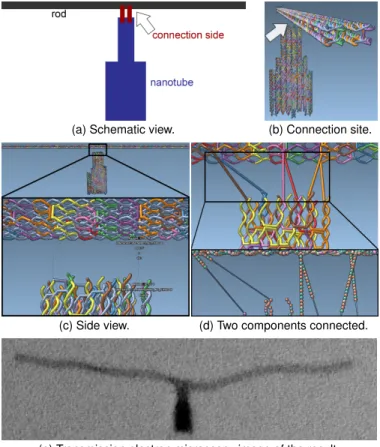
To better understand the practical application of our tool, we created a case study for connecting two individually designed components. The concept of such connections is illustrated in Fig. 11(a) where a nanotube is connected to a longer rod. With existing tools this is a difficult task. Based on the structures modeled in caDNAno, scientists have to identify the correct strands that are candidates for prolongation/connection in a simple 3D viewer. Then, both components cannot be spatially aligned in caDNAno for the connection—the scientists have to mentally integrate both parts and their individual schematic representations. Next, they have to consider the lengths and distances, without being able to estimate these values from the dimensionless schematics. All these aspects make it difficult to decide on the strands to connect and on the lengths of the needed extensions. According to C3, such a task takes several weeks with the existing tools. Moreover, the scientists have to rely on their experience to be confident that the created structure will assemble in vitro, making the existing approach temporally and financially expensive and inefficient.
In the case study, we asked C3 to carry out exactly the same task using our system. She started by loading the two datasets to create the multiscale visualizations, which allowed her to quickly inspect the structure. She first inspected the sequence and then the overall placement of the staples and scaffold. The atomic details were not
(a) Schematic view. (b) Connection site.
(c) Side view. (d) Two components connected.
(e) Transmission electron microscopy image of the result. Fig. 11: Connecting two components via strand prolongation. of interest for her at this point. Because C3 was not familiar with 3D interactions, the FA assisted her by arranging the two parts to be connected (Fig. 11(b)). C3 particularly appreciated the spatial arrangement in the same 3D view, which allowed her to inspect both structures for finding the best possible location for the connection. Fig. 11(c) shows views of this inspection. Next, C3 identified six staple strands of the rod and the nanotube, which she wanted to connect. She applied our strand prolongation method to add the appropriate sequences from the 5’ to 3’ direction using the same sequences as in her traditional tools. Because C3 stated that the strand ends are not always easy to see due to the density of the overall structure, we deactivated the visibility of the scaffold (Fig. 11(d)). One way to improve the interaction would be to highlight the strand ends. While this contradicts our general design guideline of reducing the complexity as much as possible for each scale, it would be possible to show this information on-demand. After C3 had completed all six prolongations (Fig. 11(d)) she inspected the connection in a close-up view in Scale 4. C3 stated that the ability to visually inspect the result with our straightforward visualizations gave her great confidence of the resulting stability. Finally, we exported the connected structure and compared it to the result of the old method, verifying that it was identical. The transmission electron microscopy image of this structure is shown in Fig. 11(e). The entire work on this dataset took C3 less than 30 minutes, demonstrating the potential for a much more economic design process than is possible with existing tools. As a result, C3 and her entire team are very satisfied with the new possibilities.
8 CONCLUSION ANDOUTLOOK
With this paper we have provided the first effective way of representing DNA nanostructures and for allowing scientists to manipulate them. We have achieved this result based on two fundamental contributions: First, we derived a meaningful multiscale semantic abstraction sequence for representing the DNA structures and, second, we introduced the concept of scale-adaptive manipulation to facilitate manipulations. The series of semantic abstractions starts at established atom/bond representations via secondary and tertiary structures. These are then
connected seamlessly to the different domain of high-level geometric shapes, which are the building blocks in nanotechnology. Moreover, with the scale-adaptive manipulations we are the first to discuss and solve fundamental interaction issues in abstract visualizations in which the user freely controls the abstraction level.
With our approach we have demonstrated an application of illustra-tive visualization concepts to a practical domain with realistic datasets (e. g., 264,005 non-hydrogen atoms in Fig. 10(a)) and use cases from the DNA nanotechnology field. We grounded our work by first ana-lyzing the domain and its needs (i. e., a UWP approach [24, 30]) and then by working embedded in the team of our collaborating domain scientists. Throughout the work, we asked for direct feedback and, after completing our new system, discussed its applicability to solve their relevant tasks (VDAR evaluation [24, 30]). With this analysis we showed the applicability of the overall visualization and interaction design, and also demonstrated a drastic increase in time efficiency. The implementation is integrated into the software suite used in DNA nanotechnology and will soon be released as open source. At the time of writing, the collaborators are in the first stages of integrating our system into their work practices and have already completed the first experiments based on it, as documented in Fig. 11(e).
Of course, our approach is not without limitations. The multiscale concept only lays the foundation for basic operations to allow domain scientists to solve essential tasks. In this ongoing project we will continue to work on novel scale-adaptive operations for multiple scales to create advanced multi-component complexes. Multiple levels of semantic abstractions, for example, may leave us with an extreme number of primitives to display in high-detail scales. Currently we are limited to datasets that have less than half a million of atoms. Larger assemblies can no longer be rendered at high-enough refresh rates. We are exploring the use of view-dependent abstraction techniques [31, 38, 39] to later also be able to process datasets with millions of atoms, which is already possible in some DNA nanostructures. Applying our approach to other domains is limited by requiring a sequence of abstraction stages that can be meaningfully interpolated.
The field of nanotechnology is starting to use the outcome from decades of research in computational geometry and graph drawing. The adopted algorithms are just the tip of the iceberg of all the opportunities for scientific cross-pollination between nanotechnology and computer science. For example, while our modeling happens directly in 3D, a 2D modeling is certainly needed when focusing on a certain detail. 2D views eliminate many ambiguities and orientational issues associated with 3D. As a next step we will investigate techniques for structural local flattening of nanostructures for interactive computer aided design.
We see that currently we are dealing with modeling a structure, modeling a function will likely involve the generation of hybrid macro-molecules, partially constructed from nucleotides and partially from aminoacids. Such models will require more complex abstraction schemes, but they will also require understanding the needs for a CAD design of functional components.
Currently we are building the most elementary structural compo-nents. Soon there will be larger collections of nanomodels available, forming the screws-and-bolts of the nanoscale. On a long term, we en-vision to build and support a digital warehouse with nanocomponents. Designing nanostructures will be similar to producing macroscopic man-made artifacts such as cars and furniture: more complex objects are a composition of pre-made simpler objects.
ACKNOWLEDGMENTS
This project has received funding from the European Unions Horizon 2020 research and innovation programme under grant agreement No 686647. This work was also partially funded under the ILLUSTRARE grant by FWF (I 2953-N31), ANR (ANR-16-CE91-0011-01), and the WWTF (VRG11-010). The TEM samples were prepared / data was recorded at the EM Facility of the Vienna Biocenter Core Facilities GmbH (VBCF), Austria.
REFERENCES
[1] E. Abrahamsson and S. S. Plotkin. BioVEC: A program for biomolecule visualization with ellipsoidal coarse-graining. Journal of Molecular Graph-ics and Modelling, 28(2):140–145, Sept. 2009. doi: 10.1016/j.jmgm.2009.05. 001
[2] N. Alharbi, M. Alharbi, X. Martinez, M. Krone, M. Baaden, R. S. Laramee, and M. Chavent. Molecular visualization of computational biology data: A survey of surveys. In EuroVis Short Papers, pp. 133–137. Eurographics Association, Goslar, Germany, 2017. doi: 10.2312/eurovisshort.20171146 [3] E. S. Andersen, M. Dong, M. M. Nielsen, K. Jahn, R. Subramani, W.
Mam-douh, M. M. Golas, B. Sander, H. Stark, C. L. P. Oliveira, J. S. Pedersen, V. Birkedal, F. Besenbacher, K. V. Gothelf, and J. Kjems. Self-assembly of a nanoscale DNA box with a controllable lid. Nature, 459(7243):73–76, May 2009. doi: 10.1038/nature07971
[4] T. M. Asbury, M. Mitman, J. Tang, and W. J. Zheng. Genome3D: A viewer-model framework for integrating and visualizing multi-scale epigenomic information within a three-dimensional genome. BMC Bioinformatics, 11(1):444:1–444:7, 2010. doi: 10.1186/1471-2105-11-444
[5] Austrian Institute of Technology. MARA – Molecular analytical robotics assays. Website: http://maraproject.eu/, 2017. Visited in March 2017.
[6] C. Bajaj, P. Djeu, V. Siddavanahalli, and A. Thane. TexMol: Interactive visual exploration of large flexible multi-component molecular complexes. In Proc. Visualization, pp. 243–250. IEEE Computer Society, Los Alami-tos, 2004. doi: 10.1109/VISUAL.2004.103
[7] E. Benson, A. Mohammed, J. Gardell, S. Masich, E. Czeizler, P. Orponen, and B. H¨ogberg. DNA rendering of polyhedral meshes at the nanoscale. Nature, 523(7561):441–444, 2015. doi: 10.1038/nature14586
[8] E. Benson, A. Mohammed, J. Gardell, S. Masich, E. Czeizler, P. Orponen, and B. H¨ogberg. vHelix – Free-form DNA-nanostructure design. Website: http://www.vhelix.net/, 2017. Visited in March 2017.
[9] C. R. Bernier, A. S. Petrov, C. C. Waterbury, J. Jett, F. Li, L. E. Freil, X. Xiong, L. Wang, B. L. R. Migliozzi, E. Hershkovits, Y. Xue, C. Hsiao, J. C. Bowman, S. C. Harvey, M. A. Grover, Z. J. Wartelle, and L. D. Williams. Ribovision suite for visualization and analysis of ribosomes. Faraday Discussions, 169:195–207, Nov. 2014. doi: 10.1039/C3FD00126A [10] G. Cipriano and M. Gleicher. Molecular surface abstraction. IEEE
Transactions on Visualization and Computer Graphics, 13(6):1608–1615, Nov./Dec. 2007. doi: 10.1109/TVCG.2007.70578
[11] G. Cipriano, G. N. Phillips, Jr., and M. Gleicher. Multi-scale surface descriptors. IEEE Transactions on Visualization and Computer Graphics, 15(6):1201–1208, 2009. doi: 10.1109/TVCG.2009.168
[12] G. Cipriano, G. Wesenberg, T. Grim, G. N. Phillips, Jr., and M. Gleicher. GRAPE: GRaphical Abstracted Protein Explorer. Nucleic Acids Research, 38(Web Server issue):W595–W601, 2010. doi: 10.1093/nar/gkq398 [13] C. Clementi. Coarse-grained models of protein folding: Toy models or
predictive tools? Current Opinion in Structural Biology, 18(1):10–15, Feb. 2008. doi: 10.1016/j.sbi.2007.10.005
[14] N. Conway and S. Douglas. caDNAno. Website: http://cadnano.org/, 2016. Visited in March 2017.
[15] G. S. Couch, D. K. Hendrix, and T. E. Ferrin. Nucleic acid visualization with UCSF Chimera. Nucleic Acids Research, 34(4):e29:1–e29:5, Jan. 2006. doi: 10.1093/nar/gnj031
[16] S. M. Douglas, I. Bachelet, and G. M. Church. A logic-gated nanorobot for targeted transport of molecular payloads. Science, 335(6070):831–834, Feb. 2012. doi: 10.1126/science.1214081
[17] S. M. Douglas, A. H. Marblestone, S. Teerapittayanon, A. Vazquez, G. M. Church, and W. M. Shih. Rapid prototyping of 3D DNA-origami shapes with caDNAno. Nucleic Acids Research, 37(15):5001–5006, Aug. 2009. doi: 10.1093/nar/gkp436
[18] J. A. Ellis-Monaghan, A. McDowell, I. Moffatt, and G. Pangborn. DNA origami and the complexity of Eulerian circuits with turning costs. Natural Computing, 14(3):491–503, Sept. 2015. doi: 10.1007/s11047-014-9457-2 [19] T. Ertl, M. Krone, S. Kesselheim, K. Scharnowski, G. Reina, and C. Holm.
Visual analysis for space-time aggregation of biomolecular simulations. Faraday Discussions, 169:167–178, July 2014. doi: 10.1039/C3FD00156C [20] D. S. Goodsell. Atomistic vs. continuous representations in molecular
biology. In R. Paton and I. Neilson, eds., Visual Representations and Interpretations, pp. 146–155. Springer, London, 1999. doi: 10.1007/978-1 -4471-0563-3 15
[21] D. Guo, J. Nie, M. Liang, Y. Wang, Y. Wang, and Z. Hu. View-dependent level-of-detail abstraction for interactive atomistic visualization of
biologi-cal structures. Computers & Graphics, 52:62–71, 2015. doi: 10.1016/j.cag. 2015.06.008
[22] A. Halm, L. Offen, and D. Fellner. Visualization of complex molecular ribbon structures at interactive rates. In Proc. IV, pp. 737–744. IEEE Computer Society, Los Alamitos, 2004. doi: 10.1109/IV.2004.1320224 [23] W. Humphrey, A. Dalke, and K. Schulten. VMD: Visual molecular
dy-namics. Journal of molecular graphics, 14(1):33–38, Feb. 1996. doi: 10. 1016/0263-7855(96)00018-5
[24] T. Isenberg, P. Isenberg, J. Chen, M. Sedlmair, and T. M¨oller. A systematic review on the practice of evaluating visualization. IEEE Transactions on Visualization and Computer Graphics, 19(12):2818–2827, Dec. 2013. doi: 10.1109/TVCG.2013.126
[25] B. Kozl´ıkov´a, M. Krone, M. Falk, N. Lindow, M. Baaden, D. Baum, I. Vi-ola, J. Parulek, and H.-C. Hege. Visualization of biomolecular structures: State of the art revisited. Computer Graphics Forum, 2017. To appear. doi: 10.1111/cgf.13072
[26] B. Kozl´ıkov´a, M. Krone, N. Lindow, M. Falk, M. Baaden, D. Baum, I. Vi-ola, J. Parulek, and H.-C. Hege. Visualization of biomolecular structures: State of the art. In R. Borgo, F. Ganovelli, and I. Viola, eds., EuroVis State-of-the-Art Reports, pp. 61–81. Eurographics Association, Goslar, Germany, 2015. doi: 10.2312/eurovisstar.20151112
[27] M. Krone, J. E. Stone, T. Ertl, and K. Schulten. Fast visualization of Gaussian density surfaces for molecular dynamics and particle system trajectories. In EuroVis Short Papers, pp. 67–71. Eurographics Association, Goslar, Germany, 2012. doi: 10.2312/PE/EuroVisShort/EuroVisShort2012/067 -071
[28] Laboratory for Computational Biology and Biophysics at MIT. Cando. Website: https://cando-dna-origami.org/, 2015. Visited March, 2017.
[29] Laboratory for Computational Biology and Biophysics at MIT. Daedalus. Website: http://daedalus-dna-origami.org/, 2016. Visited in March 2017.
[30] H. Lam, E. Bertini, P. Isenberg, C. Plaisant, and S. Carpendale. Empirical studies in information visualization: Seven scenarios. IEEE Transactions on Visualization and Computer Graphics, 18(9):1520–1536, Sept. 2012. doi: 10.1109/TVCG.2011.279
[31] M. Le Muzic, L. Autin, J. Parulek, and I. Viola. cellVIEW: A tool for illustrative and multi-scale rendering of large biomolecular datasets. In Proc. VCBM, pp. 61–70. Eurographics Association, Goslar, Germany, 2015. doi: 10.2312/vcbm.20151209
[32] N. Lindow, D. Baum, and H.-C. Hege. Interactive rendering of materials and biological structures on atomic and nanoscopic scale. Computer Graphics Forum, 31(3pt4):1325–1334, June 2012. doi: 10.1111/j.1467-8659. 2012.03128.x
[33] W. Lueks, I. Viola, M. van der Zwan, H. Bekker, and T. Isenberg. Spatially continuous change of abstraction in molecular visualization. In IEEE BioVis Abstracts, 2011.
[34] T. Munzner. A nested model for visualization design and validation. IEEE Transactions on Visualization and Computer Graphics, 15(6):921–928, Nov. 2009. doi: 10.1109/TVCG.2009.111
[35] NANO-D, Inria. SAMSON – Software for adaptive modeling and simula-tion of nanosystems. Website: https://samson-connect.net, 2016. Visited March 2017.
[36] W. K. Olson, A. A. Gorin, X. J. Lu, L. M. Hock, and V. B. Zhurkin. DNA sequence-dependent deformability deduced from protein-DNA crystal complexes. Proceedings of the National Academy of Sciences of the United States of America, 95(19):11163–11168, Sept. 1998. doi: 10.1073/pnas.95. 19.11163
[37] L. Orlando, A. Ginolhac, G. Zhang, D. Froese, A. Albrechtsen, M. Stiller, M. Schubert, E. Cappellini, B. Petersen, I. Moltke, P. L. Johnson, M. Fu-magalli, J. T. Vilstrup, M. Raghavan, T. Korneliussen, A. S. Malaspinas, J. Vogt, D. Szklarczyk, C. D. Kelstrup, J. Vinther, A. Dolocan, J. Sten-derup, A. M. Velazquez, J. Cahill, M. Rasmussen, X. Wang, J. Min, G. D. Zazula, A. Seguin-Orlando, C. Mortensen, K. Magnussen, J. F. Thomp-son, J. Weinstock, K. Gregersen, K. H. Røed, V. Eisenmann, C. J. Rubin, D. C. Miller, D. F. Antczak, M. F. Bertelsen, S. Brunak, K. A. Al-Rasheid, O. Ryder, L. Andersson, J. Mundy, A. Krogh, M. T. Gilbert, K. Kjær, T. Sicheritz-Ponten, L. J. Jensen, J. V. Olsen, M. Hofreiter, R. Nielsen, B. Shapiro, J. Wang, and E. Willerslev. Recalibrating Equus evolution using the genome sequence of an early Middle Pleistocene horse. Nature, 499(7456):74–78, July 2013. doi: 10.1038/nature12323
[38] J. Parulek, D. J¨onsson, T. Ropinski, S. Bruckner, A. Ynnerman, and I. Viola. Continuous levels-of-detail and visual abstraction for seamless