HAL Id: hal-00328507
https://hal.archives-ouvertes.fr/hal-00328507
Submitted on 25 Jun 2007
HAL is a multi-disciplinary open access
archive for the deposit and dissemination of
sci-entific research documents, whether they are
pub-lished or not. The documents may come from
teaching and research institutions in France or
abroad, or from public or private research centers.
L’archive ouverte pluridisciplinaire HAL, est
destinée au dépôt et à la diffusion de documents
scientifiques de niveau recherche, publiés ou non,
émanant des établissements d’enseignement et de
recherche français ou étrangers, des laboratoires
publics ou privés.
Validation of MIPAS-ENVISAT NO2 operational data
G. Wetzel, A. Bracher, B. Funke, Florence Goutail, F. Hendrick, J.-C.
Lambert, S. Mikuteit, C. Piccolo, Michel Pirre, Ariane Bazureau, et al.
To cite this version:
G. Wetzel, A. Bracher, B. Funke, Florence Goutail, F. Hendrick, et al.. Validation of
MIPAS-ENVISAT NO2 operational data. Atmospheric Chemistry and Physics, European Geosciences Union,
2007, 7 (12), pp.3261-3284. �10.5194/acp-7-3261-2007�. �hal-00328507�
www.atmos-chem-phys.net/7/3261/2007/ © Author(s) 2007. This work is licensed under a Creative Commons License.
Chemistry
and Physics
Validation of MIPAS-ENVISAT NO
2
operational data
G. Wetzel1, A. Bracher2, B. Funke3, F. Goutail4, F. Hendrick5, J.-C. Lambert5, S. Mikuteit1, C. Piccolo6, M. Pirre7,
A. Bazureau4, C. Belotti8, T. Blumenstock1, M. De Mazi`ere5, H. Fischer1, N. Huret7, D. Ionov4, M. L´opez-Puertas3,
G. Maucher1, H. Oelhaf1, J.-P. Pommereau4, R. Ruhnke1, M. Sinnhuber2, G. Stiller1, M. Van Roozendael5, and
G. Zhang1,*
1Institut f¨ur Meteorologie und Klimaforschung (IMK), Forschungszentrum Karlsruhe, Karlsruhe, Germany
2Institute of Environmental Physics and Remote Sensing (IUP/IFE), University of Bremen, Bremen, Germany
3Instituto de Astrof´ısica de Andaluc´ıa (IAA), Consejo Superior de Investigaciones Cientificas, Granada, Spain
4Service d’A´eronomie, CNRS, Verri`eres-le-Buisson, France
5Belgian Institute for Space Aeronomy (IASB-BIRA), Brussels, Belgium
6Oxford University, Oxford, UK
7Laboratoire de Physique et Chimie de l’Environnement (LPCE), CNRS, Orl´eans, France
8IFAC-CNR, Firenze, Italy
*now at: Shangqiu Normal College, Shangqiu, China
Received: 18 December 2006 – Published in Atmos. Chem. Phys. Discuss.: 2 March 2007 Revised: 15 May 2007 – Accepted: 12 June 2007 – Published: 25 June 2007
Abstract. The Michelson Interferometer for Passive
At-mospheric Sounding (MIPAS) instrument was launched aboard the environmental satellite ENVISAT into its sun-synchronous orbit on 1 March 2002. The short-lived species
NO2is one of the key target products of MIPAS that are
op-erationally retrieved from limb emission spectra measured in the stratosphere and mesosphere. Within the MIPAS val-idation activities, a large number of independent observa-tions from balloons, satellites and ground-based staobserva-tions have been compared to European Space Agency (ESA) version
4.61 operational NO2data comprising the time period from
July 2002 until March 2004 where MIPAS measured with full spectral resolution. Comparisons between MIPAS and balloon-borne observations carried out in 2002 and 2003 in the Arctic, at mid-latitudes, and in the tropics show a very good agreement below 40 km altitude with a mean devia-tion of roughly 3%, virtually without any significant bias. The comparison to ACE satellite observations exhibits only a small negative bias of MIPAS which appears not to be signif-icant. The independent satellite instruments HALOE, SAGE II, and POAM III confirm in common for the spring-summer time period a negative bias of MIPAS in the Arctic and a positive bias in the Antarctic middle and upper stratosphere exceeding frequently the combined systematic error limits. In contrast to the ESA operational processor, the IMK/IAA
retrieval code allows accurate inference of NO2volume
mix-ing ratios under consideration of all important non-LTE
pro-Correspondence to: G. Wetzel
cesses. Large differences between both retrieval results ap-pear especially at higher altitudes, above about 50 to 55 km. These differences might be explained at least partly by non-LTE under polar winter conditions but not at mid-latitudes. Below this altitude region mean differences between both processors remain within 5% (during night) and up to 10% (during day) under undisturbed (September 2002) conditions and up to 40% under perturbed polar night conditions (Febru-ary and March 2004). The intercomparison of ground-based NDACC observations shows no significant bias between the
FTIR measurements in Kiruna (68◦N) and MIPAS in
sum-mer 2003 but larger deviations in autumn and winter. The mean deviation over the whole comparison period remains within 10%. A mean negative bias of 15% for MIPAS day-time and 8% for nightday-time observations has been determined
for UV-vis comparisons over Harestua (60◦N). Results of a
pole-to-pole comparison of ground-based DOAS/UV-visible sunrise and MIPAS mid-morning column data has shown that the mean agreement in 2003 falls within the accuracy limit of the comparison method. Altogether, it can be indicated that
MIPAS NO2profiles yield valuable information on the
verti-cal distribution of NO2in the lower and middle stratosphere
(below about 45 km) during day and night with an overall ac-curacy of about 10–20% and a precision of typically 5–15% such that the data are useful for scientific studies. In cases
where extremely high NO2occurs in the mesosphere (polar
winter) retrieval results in the lower and middle stratosphere are less accurate than under undisturbed atmospheric condi-tions.
2
1 Introduction
The abundance of reactive nitrogen and its partitioning plays an important role in the understanding of gas-phase and het-erogeneous processes in stratospheric chemistry. The
short-lived species nitrogen dioxide (NO2) is involved in catalytic
cycles leading to the destruction of stratospheric ozone. In
addition, NO2regulates the ozone budget via reactions with
radicals to form reservoir species like HNO3, ClONO2,
BrONO2, and N2O5 which temporarily remove these
radi-cals from fast ozone destroying reactions.
NO2exhibits a strong diurnal variation in the stratosphere
and is in photochemical equilibrium with NO and N2O5(see,
e.g. Brasseur and Solomon, 2005). At sunset, NO is rapidly
converted to NO2mainly via the reaction with O3:
NO + O3→NO2+O2 (R1)
During the night, NO2 is gradually decomposed to form
N2O5by the following reactions:
NO2+O3→NO3+O2 (R2)
NO2+NO3+M → N2O5+M (R3)
After sunrise, N2O5is photolyzed back into NO2and NO3:
N2O5+hν → NO2+NO3 (R4)
It can also be destroyed by collisional decomposition via the
reverse reaction of (R3). At the same time, NO2reacts very
rapidly to reform NO either by photolysis or by reaction with atomic oxygen:
NO2+hν → NO + O(3P ) (R5)
NO2+O → NO + O2 (R6)
This diurnal variation of NO2results in a minimum
concen-tration after sunrise and a maximum concenconcen-tration shortly after sunset.
Stratospheric NO2 measurements have been carried out
since the 1970s from a variety of airborne and ground-based platforms using in-situ and remote sensing techniques (e.g., Noxon et al., 1979; Coffey et al., 1981; Kondo et al., 1985; Roscoe et al., 1986; Pommereau and Goutail, 1988; Webster et al., 1990; Pfeilsticker and Platt, 1994; Chance et al., 1996; Renard et al., 1996; Wetzel et al., 1997; Sen et al., 1998; Payan et al., 1999).
Satellite measurements are essential for monitoring the be-haviour and trends of chemical species in the atmosphere since a global set of simultaneously derived atmospheric pa-rameters can be obtained. Early spaceborne observations
of NO2 were performed between 1978 and 1979 by the
LIMS radiometer (Gille and Russell III, 1984). The Atmo-spheric Trace Molecule Spectroscopy experiment (ATMOS) has flown four times on the Space Shuttle between 1985 and
1994 measuring NO2 in infrared solar occultation (Russell
III et al., 1988; Newchurch et al., 1996). The families of the Stratospheric Aerosol and Gas Experiment (SAGE I, II, and III; Chu and McCormick, 1986; Cunnold et al., 1991; NASA LaRC, 2006) and Polar Ozone and Aerosol Measurement (POAM II and III; Randall et al., 1998; Randall et al., 2002)
observe NO2 by solar occultation in the visible while the
Halogen Occultation Experiment (HALOE; Russell III et al., 1993) on the Upper Atmosphere Research Satellite (UARS) spacecraft operated in the infrared spectral domain. On the
same platform, NO2was observed in the infrared by the
Im-proved Stratospheric and Mesospheric Sounder (ISAMS) by means of pressure modulator radiometer technique (Reburn et al., 1996) and by the Cryogenic Limb Array Etalon Spec-trometer (CLAES; Dessler et al., 1996). Further satellite
sen-sors measuring NO2 in the infrared spectral region are the
two Improved Limb Atmospheric Spectrometers (ILAS I and II; Sasano et al., 1999; Nakajima et al., 2006) and the Atmo-spheric Chemistry Experiment Fourier Transform Spectrom-eter (ACE-FTS; Bernath et al., 2005).
The Environmental Satellite (ENVISAT) was launched into its sun-synchronous orbit on 1 March 2002 and oper-ates in an altitude of 800 km. The Scanning Imaging Ab-sorption Spectrometer (SCIAMACHY; Bovensmann et al.,
1999) measures NO2and a number of climate relevant trace
gases during day in nadir and limb viewing geometries, as well as in solar and lunar occultation modes (Amekudzi et al., 2005; Bracher et al., 2005; Meyer et al., 2005; Rozanov et al., 2005). The Global Ozone Monitoring by Occulta-tion of Stars (GOMOS; Bertaux et al., 1991) instrument
ob-serves NO2and some other species during twilight and night
(Marchand et al., 2004). The Michelson Interferometer for Passive Atmospheric Sounding (MIPAS; Fischer and
Oel-haf, 1996; Fischer et al., 20071) is one of the three
chem-istry instruments aboard ENVISAT. MIPAS operates in the mid-infrared spectral region with high spectral resolution measuring many climate relevant species within the nitro-gen, chlorine and hydrogen chemical families together with tropospheric source gases simultaneously. Increasing com-plexity of such space instruments and enhanced diversity of products expected from instruments like MIPAS demand for even increased efforts in validation. Apart from satellite measurements, balloon-borne observations are a very useful tool to obtain distributions of a large number of molecules with sufficiently high vertical resolution. However, due to large logistical efforts the number of these flights is very limited. This holds also for aircraft measurements which may cover larger horizontal regions compared to balloons
1Fischer, H., Birk, M., Blom, C., Carli, B., Carlotti, M., von
Clarmann, T., Delbouille, L., Dudhia, A., Ehhalt, D., Endemann, M., Flaud, J.-M., Gessner, R., Kleinert, A., Koopmann, R., Langen, J., L´opez-Puertas, M., Mosner, P., Nett, H., Oelhaf, H., Perron, G., Remedios, J., Ridolfi, M., Stiller, G., and Zander, R.: MIPAS: An instrument for atmospheric and climate research, Atmos. Chem. Phys. Discuss., submitted, 2007.
but from distinctly lower flight altitudes. Ground-based mea-surements can be carried out all over the year but, apart from LIDAR observations, the vertical resolution is generally very low. The use of independent satellite measurements to val-idate trace gas products has the great advantage that global coverage for all seasons is available and that validation ac-tivities are not limited to a certain period and location. This paper outlines the results of the MIPAS validation activities
concerning the molecule NO2. The comparisons were made
with the European Space Agency (ESA) operational version 4.61 data comprising the time period from July 2002 until March 2004 where MIPAS measured with full spectral reso-lution.
2 MIPAS NO2data
The limb viewing Fourier transform spectrometer MIPAS on ENVISAT (MIPAS-E) operates in the mid-infrared
spec-tral region covering five specspec-tral bands within 685 cm−1and
2410 cm−1 with an unapodized full spectral resolution of
0.035 cm−1(Fischer and Oelhaf, 1996; Fischer et al., 20071).
Owing to its sun-synchronous orbit (98.55◦ inclination) in
about 800 km, MIPAS passes the equator in southwards di-rection at 10:00 am local time 14.3 times a day. During each orbit approximately 72 limb scans (full resolution mode) are recorded covering tangent altitudes from 8 to 68 km in steps of 3 km. The vertical resolution is about 3 km coinciding with the vertical field of view (FOV) of 3 km while the hor-izontal field of view extends to 30 km. Level 1B and level 2 processing of the data (version 4.61) including all processing steps from raw data to calibrated spectra and volume mix-ing ratio (VMR) profiles of species has been performed by ESA using the operational retrieval algorithm described by Raspollini et al. (2006) and references therein. Calibrated spectra are analyzed using a global fit approach (Carlotti, 1988) by varying the input parameters of the forward model according to a non-linear Gauss-Newton procedure. In a first step, temperature and pressures at the tangent altitudes are retrieved simultaneously (p, T retrieval), then the VMR
profiles of the primary target species O3, H2O, CH4, N2O,
HNO3and NO2are retrieved individually in sequence.
The NO2operational analysis of the version 4.61 data has
been performed in three microwindows of the ν3band near
6.2 µm (1615 cm−1). A random error due to the
propaga-tion of instrument noise through the retrieval can be extracted from the diagonal elements of the error variance covariance matrix calculated during the retrieval process. Systematic er-ror sources are calculated for day and night conditions and different seasons. The following systematic errors have been taken into account: pressure-temperature random retrieval errors; spectroscopic data errors due to uncertainties in the intensity, width and position of emission lines; radiometric gain, instrumental line shape and spectral calibration inac-curacies; uncertainties in assumed profiles of the
contami-nant species H2O and CH4; horizontal gradient effects due to
assuming a horizontally homogeneous atmosphere for each profile; and errors due to the effects of non local thermo-dynamic equilibrium (non-LTE). For most cases and at most altitudes in the stratosphere, the random error is the dominant error source with a magnitude of roughly 10%. However, in the upper stratosphere and mesosphere, the systematic non local thermodynamic equilibrium (non-LTE) error gets very important, especially under winter conditions. The total er-ror is calculated as the root sum square of systematic and random components. A detailed discussion of all error com-ponents together with their magnitudes is given in Raspollini et al. (2006).
3 Intercomparison results
In this section, profiles and vertical column amounts of NO2
measured by several instruments are compared to MIPAS
version 4.61 NO2 data. A comprehensive study
concern-ing validation methods and strategies is given by von Clar-mann (2006) and references therein. Differences in VMR profiles of measured quantities are expressed as either rela-tive or absolute differences. The mean relarela-tive difference of several profiles is calculated by dividing the mean absolute difference by the mean profile value of the validation instru-ment for all coincident altitudes. Differences are displayed
together with the combined errors σcombof both instruments
which are defined as:
σcomb= q
σM2 +σI2, (1)
where σM and σI are the precision, systematic or total
er-rors of MIPAS and the validation instrument, respectively. Precision errors (which characterize the reproducibility of a measurement) correspond, in general, to random noise er-rors, while other error sources are treated as systematic. It should be mentioned that not all systematic error sources (as specified in Sect. 2) could be characterized for all validation instruments. However, dominant error sources (e.g. temper-ature profile errors) have been included. For statistical
com-parisons, errors of the temperature profile used for the NO2
retrievals behave more randomly and are therefore included in the precision (random) part of the error budget. The un-certainty of the calculated mean difference (standard error of
the mean, SEM) is given by σ/N0.5where σ is the standard
deviation (SD) and N the number of compared observations. The comparison between the standard deviation of the mean difference and the combined random error helps to validate the precision of MIPAS. The comparison between the mean VMR difference and the combined systematic error of the two instruments is appropriate to identify unexplained biases
in MIPAS NO2observations which turn out to be significant
when they exceed the combined systematic error limits.
As mentioned in Sect. 1, NO2 volume mixing ratios
2
Table 1. Overview on balloon flights for the validation of MIPAS-E. Distances between MIPAS-E and the validation instrument refer to an
altitude of 30 km. Concerning MIPAS-B, distances refer to direct coincidences with MIPAS-E overpasses and 2-day trajectory calculations (in parenthesis).
Location Date Instrument Distance (at 30 km) Time difference
Kiruna 21 Jan 2003 SPIRALE 623 km 81 min
(Sweden, 68◦N) 20/21 March 2003 MIPAS-B <241 km (500 km) ≤20 min (1 h)
30 March 2003 SAOZ <700 km ≤3 days
3 July 2003 MIPAS-B 9 km (500 km) 507 min (1 h)
Vanscoy 3 Sep 2003 SAOZ <700 km ≤3 days
(Canada, 54◦N) 4 Sep 2003 SAOZ <700 km ≤3 days
Aire sur l’Adour 24 Sep 2002 MIPAS-B <147 km (500 km) ≤16 min (1 h)
(France, 44◦N) 02 Oct 2003 SPIRALE 401 km 4.5 days
Bauru 18 Feb 2003 SAOZ <700 km ≤3 days
(Brazil, 23◦S) 23 Feb 2003 SAOZ <700 km ≤3 days
10 100 0 2 4 6 8 10 12 14 16 10 100 0 2 4 6 8 10 12 14 16 -2 -1 0 1 2 100 10 -2 -1 0 1 2
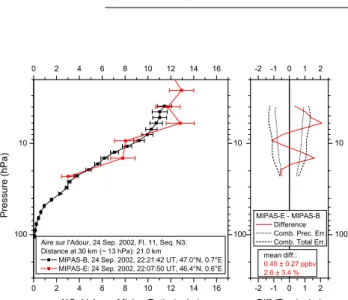
Aire sur l'Adour, 24 Sep. 2002, Fl. 11, Seq. N3: Distance at 30 km (~ 13 hPa): 21.0 km
MIPAS-B, 24 Sep. 2002, 22:21:42 UT, 47.0°N, 0.7°E MIPAS-E: 24 Sep. 2002, 22:07:50 UT, 46.4°N, 0.6°E
NO2 Volume Mixing Ratio (ppbv)
Pre ssu re (h Pa ) mean diff.: 0.40 ± 0.27 ppbv 2.6 ± 3.4 % MIPAS-E - MIPAS-B Difference Comb. Prec. Err. Comb. Total Err.
Diff./Err. (ppbv)
σ
Fig. 1. Direct comparison of NO2profiles measured by MIPAS-B (flight no. 11, sequence N3) and MIPAS-E (orbit 2975) on 24 September 2002 above southern France together with difference and combined errors (1σ ). The mean difference value is calculated over all coincident altitudes.
mixing ratio may reach several ppbv within half an hour
around sunrise and sunset. Consequently, photochemical
corrections have been applied to account for temporal and in some cases also spatial differences between MIPAS and the validation instrument.
3.1 Intercomparison of balloon-borne observations
As part of the validation program of the chemistry instru-ments aboard ENVISAT a number of balloon flights were carried out within dedicated campaigns. An overview of all balloon flights used within this comparison study is given in Table 1. A total of three validation flights were carried out with the cryogenic Fourier transform infrared spectrom-eter MIPAS-B, the balloon-borne version of MIPAS, from
Aire sur l’Adour (France, 44◦N) on 24 September 2002,
Kiruna (Sweden, 68◦N) on 20/21 March 2003, and again
from Kiruna on 3 July 2003. MIPAS-B measures all atmo-spheric parameters covered by MIPAS-E. Essential for the balloon instrument is the sophisticated line of sight stabiliza-tion system, which is based on an inertial navigastabiliza-tion system and supplemented with an additional star reference system. Averaging several spectra during one single elevation angle yields to a reduction of the noise equivalent spectral radi-ance (NESR) and therefore to an improvement of the sig-nal to noise ratio. The MIPAS-B data processing including instrument characterization is described in Friedl-Vallon et al. (2004) and references therein. Retrieval calculations of atmospheric target parameters were performed with a least squares fitting algorithm using analytical derivative spectra calculated by the Karlsruhe Optimized and Precise Radiative transfer Algorithm (KOPRA; Stiller et al., 2002; H¨opfner et al., 2002). A Tikhonov-Phillips regularization approach con-straining with respect to the form of an a priori profile was adopted. The resulting vertical resolution lies typically be-tween 2 and 3 km and is therefore comparable to the
verti-cal resolution of MIPAS-E. NO2 was analyzed in
MIPAS-B proven microwindows in the ν3band between 1585 cm−1
and 1615 cm−1. Spectroscopic parameters chosen for the
MIPAS-B retrieval are consistent with the database taken for the MIPAS-E data analysis (Flaud et al., 2003) and originate mainly from the HITRAN 2004 database (Rothman et al., 2005). A further overview on the MIPAS-B data analysis is given in Wetzel et al. (2006) and references therein.
Figure 1 shows an example for perfect coincidence be-tween MIPAS-B and MIPAS-E on 24 September 2002 above southern France. The mean distance of both observations in the compared altitude region was about 57 km and the mean time difference was only 14 min. The MIPAS-E pro-file shows some retrieval instabilities which occur quite
10 100 0 1 2 3 4 5 6 7 8 10 100 0 1 2 3 4 5 6 7 8 -1 0 1 100 10 -1 0 1
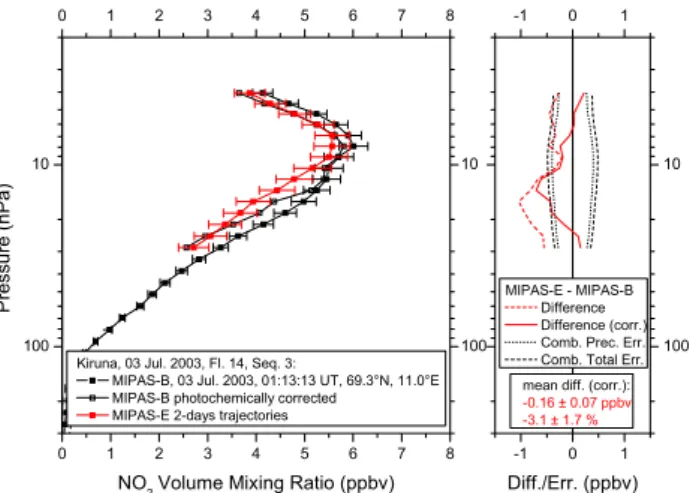
Kiruna, 03 Jul. 2003, Fl. 14, Seq. 3:
MIPAS-B, 03 Jul. 2003, 01:13:13 UT, 69.3°N, 11.0°E MIPAS-B photochemically corrected
MIPAS-E 2-days trajectories
NO2 Volume Mixing Ratio (ppbv)
Pre ssu re (h Pa )
mean diff. (corr.):
-0.16 ± 0.07 ppbv -3.1 ± 1.7 %
MIPAS-E - MIPAS-B Difference Difference (corr.) Comb. Prec. Err. Comb. Total Err.
Diff./Err. (ppbv)
Fig. 2. Trajectory comparison for the MIPAS-B flight carried out
from Kiruna on 3 July 2003. The MIPAS-B NO2values have been
transferred to the time and location of the individual MIPAS-E ob-servations with the help of KASIMA model calculations. The mean 2-day trajectory MIPAS-E profile (consisting of several averaged coinciding profiles) can then be compared to the accordingly cor-rected MIPAS-B profile. The mean difference value is calculated over all coincident altitudes.
instabilities, the MIPAS-B profiles are fairly well reproduced by MIPAS-E and differences are mostly within the combined errors. A small positive bias of 0.4 ppbv, more pronounced at higher altitudes, can be recognized in the satellite data.
To increase the number of matches between MIPAS-B and MIPAS-E, trajectory calculations have been performed at the FU (Freie Universit¨at) Berlin (K. Grunow, private communi-cation, 2005). The trajectory model (Langematz et al., 1987; Reimer and Kaupp, 1997) uses operational analyses and fore-casts of the European Centre for Medium-Range Weather
Forecasts (ECMWF) on a 2.5◦×2.5◦latitude/longitude grid.
The trajectories are calculated on 25 isentropic levels from the surface up to 1600 K with interpolation between these levels. For this study forward and backward trajectories up to two days were calculated, starting on the MIPAS-B tan-gent point locations. MIPAS-E measurement points have been searched within a match criterion of not more than an hour in time and less than 500 km horizontal distance to the centre of the satellite scan.
To balance temporal and spatial differences of the observa-tions of both sensors, simulaobserva-tions have been carried out with the three-dimensional Chemistry Transport Model (CTM) KASIMA (Karlsruhe Simulation model of the Middle
Atmo-sphere; Kouker et al., 1999) which was run in a 5.6◦×5.6◦
horizontal resolution. MIPAS-B NO2values were corrected
by scaling them with the altitude-dependent NO2ratio
deter-mined from the modelled NO2profiles for the MIPAS-B and
MIPAS-E measurement times and locations.
Figure 2 displays an example for the trajectory comparison for the balloon flight on 3 July 2003 which was carried out from Kiruna. Dependent on altitude, a total of 5 to 7
trajec-40 35 30 25 20 15 10 -3 -2 -1 0 1 2 3 -3 -2 -1 0 1 2 3 -3 -2 -1 0 1 2 3 40 35 30 25 20 15 10 -3 -2 -1 0 1 2 3 100 10 Coincident comparison Mean diff.: 0.29 ± 0.09 ppbv 24 Sep. 2002, Seq. S 24 Sep. 2002, Seq. N3 20 Mar. 2003, Seq. N3a 21 Mar. 2003, Seq. D15c 03 Jul. 2003, Seq. 3
Mean difference ( sd)
prec. tot. mean comb. err.
Al ti tu d e (km) Al ti tu d e (km) Trajectory comparison Mean diff.: -0.10 ± 0.09 ppbv 24 Sep. 2002, Seq. S 24 Sep. 2002, Seq. N3 24 Sep. 2002, Seq. W 24 Sep. 2002, Seq. E 20 Mar. 2003, Seq. N3a 21 Mar. 2003, Seq. D15c 03 Jul. 2003, Seq. 2 03 Jul. 2003, Seq. 3
Mean difference ( sd)
prec. tot. mean comb. err.
NO2 VMR Difference (ppbv): MIPAS-E - MIPAS-B
Pre ssu re (h Pa )
Fig. 3. Differences of all coincident (left) and trajectory (right)
comparisons between MIPAS-B and MIPAS-E including combined errors and standard deviation. A photochemical correction has been applied for all trajectory comparisons and the coincident compari-son on 3 July 2003, where only a coincidence in space but not in time could be achieved. No photochemical correction was neces-sary for the other coincident cases since temporal differences are less than 33 min and spatial differences are less than 250 km in all altitudes and since the observations were not taken during sunrise
and sunset conditions where NO2 changes rapidly with time. A
mean difference value is calculated over all coincident altitudes.
tory matches have been averaged by taking into account the individual random error to yield a mean MIPAS-E profile. The graph shows, that the bias between the measured profiles of both sensors vanishes at many altitudes when comparing the photochemically corrected MIPAS-B profile to the mean satellite profile.
A summary of all MIPAS balloon comparisons is depicted in Fig. 3. A mean positive bias of 0.29 ppbv (4.2%) is vis-ible in the coincidence case, especially for altitudes above
about 28 km (18 hPa). The mean difference lies clearly
within the combined total error and, except a small region around 38 km, even within the combined precision error. The trajectory comparison, however, reveals a small nega-tive bias between 25 and 35 km altitude while, below and
above, MIPAS-E tends to higher NO2 values compared to
the balloon instrument. The mean deviation over all alti-tudes is −0.10 ppbv (–2.2%). The combined coincidence and trajectory comparison results in a small mean deviation of 0.21 ppbv (3.8%) between MIPAS-E and MIPAS-B
mea-sured NO2values.
The tunable diode laser instrument SPIRALE (Spec-trom`etre Infra Rouge pour l’´etude de l’Atmosph`ere par diodes Laser Embarqu´ees) is a balloon-borne instrument for the in situ measurement of stratospheric trace species. 86 reflections of six laser beams in a 3.5 m multipass Herriott cell exposed to ambient air above the tropopause lead to a 300 m optical path length. Species concentrations are re-trieved from direct absorption in the mid-infrared spectral
2 10 100 0.0 0.5 1.0 1.5 2.0 2.5 3.0 10 100 0.0 0.5 1.0 1.5 2.0 2.5 3.0 -1.0 -0.5 0.0 0.5 1.0 100 10 -1.0 -0.5 0.0 0.5 1.0 Kiruna, 21 Jan. 2003: Distance at 30 km (~ 9.6 hPa): 623 km
SPIRALE, 21 Jan. 2003, 20:13:23 UT, 67.8°N, 25.5°E SPIRALE, smoothed with MIPAS-E AK MIPAS-E, 21 Jan. 2003, 21:34:31 UT, 71.2°N, 8.4°E
NO2 Volume Mixing Ratio (ppbv)
Pre ssu re (h Pa ) mean diff.: -0.02 ± 0.05 ppbv -3.0 ± 4.6 % -0.05 ± 0.13 ppbv -9.3 ± 11.4 % MIPAS-E - SPIRALE Difference Diff., smoothed Comb. Prec. Err. Comb. Total Err.
Diff./Err. (ppbv)
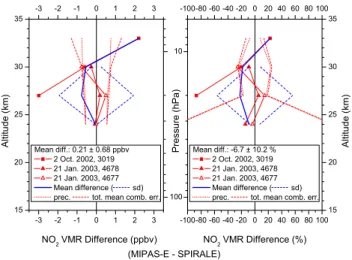
Fig. 4. Comparison of NO2profiles measured by SPIRALE and
MIPAS-E (orbit 4678) on 21 January 2003. The highly resolved vertical profile of SPIRALE has been smoothed with the MIPAS-E averaging kernel matrix.
35 30 25 20 15 -3 -2 -1 0 1 2 3 -3 -2 -1 0 1 2 3 -100-80 -60 -40 -20 0 20 40 60 80 100 35 30 25 20 15 -100-80 -60 -40 -20 0 20 40 60 80 100 100 10 Mean diff.: 0.21 ± 0.68 ppbv 2 Oct. 2002, 3019 21 Jan. 2003, 4678 21 Jan. 2003, 4677 Mean difference ( sd) prec. tot. mean comb. err.
Al ti tu d e (km) Al ti tu d e (km) Mean diff.: -6.7 ± 10.2 % 2 Oct. 2002, 3019 21 Jan. 2003, 4678 21 Jan. 2003, 4677 Mean difference ( sd) prec. tot. mean comb. err.
NO2 VMR Difference (ppbv) NO2 VMR Difference (%) (MIPAS-E - SPIRALE) Pre ssu re (h Pa )
Fig. 5. Differences of all comparisons between SPIRALE and MIPAS-E. An ascent profile of SPIRALE from 2 October 2002 is compared to a MIPAS-E limb scan performed during orbit 3019. The SPIRALE profile from 21 January 2003 has been compared to MIPAS-E observations carried out during orbits 4677 and 4678.
region by fitting experimental spectra and spectra calculated using spectroscopic parameters of absorption lines from the HITRAN database (Rothman et al., 2005). With this
tech-nique concentrations of CH4, N2O, NO2, HNO3, HCl, CO
and O3can be observed simultaneously. A detailed
descrip-tion of the instrument and of its operating modes can be found in Moreau et al. (2005). Validation flights were car-ried out from Aire sur l’Adour on 2 October 2002 and from Kiruna on 21 January 2003.
An example for a SPIRALE comparison with MIPAS-E is given in Fig. 4 for the arctic flight on 21 January 2003. The SPIRALE profile has been smoothed with the averaging
ker-100 10 0 2 4 6 8 10 12 14 16 100 10 0 2 4 6 8 10 12 14 16 Vanscoy, 4 September 2002 Distance at 20 km (56 hPa): 182 km
SAOZ 4 Sep. 2002, 1:48 UT, Lat.: 53.5°, Lon.: -107.0° (SZA=90°) MIPAS 5 Sep. 2002, 5:20 UT, Lat.: 51.9°, Lon.: -106.6° (SZA=112°) SAOZ photochemically corrected
Pre s s u re (h Pa ) NO2 VMR (ppbv) -2 -1 0 1 2 100 10 -2 -1 0 1 2 mean difference: -0.05 ppbv (-0.9%) MIPAS-E - SAOZ Difference Comb. Prec. Err. Comb. Total Err.
Diff./Err. (ppbv)
Fig. 6. Comparison of SAOZ and MIPAS NO2measurements above
Vanscoy (Canada, 54◦N) on 4 September 2002. The SAOZ
sun-set observations were photochemically corrected to fit the MIPAS nighttime measurements.
nel of MIPAS according to the method described in Rodgers (2000). Both measurements were performed inside the polar vortex. Mean differences are small with –0.05 ppbv (–9.3%) in the smoothed case.
Figure 5 shows all SPIRALE comparisons with MIPAS-E. Mean differences in potential vorticity (PV) are less than 8% for the January flight between 24 and 30 km altitude. For the 2 October 2002 flight no MIPAS-E data for a coincident com-parison is available. Hence, backward trajectories ending at
the location of the SPIRALE profiles (44◦N, 0◦E) on 2
Oc-tober 2002 (07:15–08:30 UT at ascent) have been computed as a function of potential temperature in 25 K steps (about 1 km). Profiles 14 and 15 of orbit 3019 have been proven to be the best matches for comparison with SPIRALE. These
profiles were measured close to 00 UT near 42◦N and 46◦N
on 28 September, 4.5 days before the SPIRALE flight. A
correction for the diurnal variation of NO2has been applied
to the smoothed SPIRALE profiles with the help of a pho-tochemical model. For the highest altitude (around 33 km) MIPAS-E overestimates the SPIRALE observations, while
below a tendency of underestimation of the NO2values,
es-pecially in the non-coincident October 2002 case, is obvious. The balloon-borne diode array UV-visible spectrometer SAOZ (Syst`eme d’Analyse par Observation Z´enitale)
mea-sures vertical profiles of O3 and NO2 (Pommereau and
Pi-quard, 1994). A Global Positioning System (GPS) and
an accurate pressure and temperature sensor (PTU) are at-tached to the gondola reaching a flight altitude of typically 30 km. Solar occultation measurements are performed dur-ing the ascent of the balloon and durdur-ing sunset from float or during sunrise and descent of the balloon. Slant columns of measured species along the line of sight are retrieved by the DOAS technique (Differential Optical Absorption Spectroscopy). Vertical profiles are deduced using a linear
100 10 -2 -1 0 1 2 100 10 -2 -1 0 1 2 All Night NO 2 VMR Difference (ppbv) Pre s su re (h Pa ) MIPAS-E - SAOZ Mean diff.: 0.18 ± 0.35 ppbv Mean Difference ( sd)
prec. tot. mean comb. err.
100 10 -2 -1 0 1 2 100 10 -2 -1 0 1 2 All Day NO 2 VMR Difference (ppbv) Pre ssu re (h Pa ) MIPAS-E - SAOZ Mean diff.: 0.35 ± 0.18 ppbv Mean Difference ( sd)
prec. tot. mean comb. err.
Fig. 7. NO2measured differences between MIPAS and SAOZ for
all MIPAS night (top panel) and MIPAS day (bottom panel) com-parisons.
onion peeling inversion procedure after calculating the tan-gent height from GPS. Since the full solar disk is observed, the vertical resolution of the profile is 1.4 km. A chemical
box model is included for taking into account the NO2
varia-tions during twilight as a function of solar zenith angle (SZA) and altitude. A comprehensive description of the data analy-sis is given in Denis et al. (2005). Fifteen flights have been carried out since the launch of ENVISAT, namely three in the Arctic (Kiruna, August 2002 until March 2003), eight at
mid-latitudes (Vanscoy, Canada, 54◦N, September 2002 and
August 2004, Aire sur l’Adour, France, 44◦N, May 2002
until October 2005), and four in the tropics (Bauru, Brazil,
23◦S, February 2003 and February 2004). Flights and direct
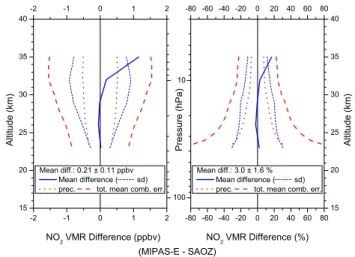
coincidence criteria used for this validation study are listed in Table 1. 40 35 30 25 20 15 -2 -1 0 1 2 -2 -1 0 1 2 -80 -60 -40 -20 0 20 40 60 80 40 35 30 25 20 15 -80 -60 -40 -20 0 20 40 60 80 100 10 Mean diff.: 0.21 ± 0.11 ppbv Mean difference ( sd) prec. tot. mean comb. err.
A lt it u d e (km) A lt it u d e (km) Mean diff.: 3.0 ± 1.6 % Mean difference ( sd) prec. tot. mean comb. err.
NO2 VMR Difference (ppbv) NO2 VMR Difference (%) (MIPAS-E - SAOZ) Pre ssu re (h Pa )
Fig. 8. Differences of all comparisons between MIPAS and SAOZ.
An example for a comparison between SAOZ and MIPAS for the flight from Vanscoy on 4 September 2002 is shown in Fig. 6. Correcting the SAOZ data with a photochemical model yields a close to perfect agreement with MIPAS for this comparison with a mean difference of less than 1% be-tween about 10 and 23 hPa (about 32 to 25 km). Figure 7 shows that there is in general a good agreement for the night-time comparisons up to about 10 hPa while above MIPAS
NO2 mixing ratios are too high compared to the SAOZ
ob-servations. A positive bias is also visible in the daytime comparison (see Fig. 7) at higher altitudes. Differences of all comparisons are depicted in Fig. 8. Except the region above about 30 km where MIPAS exhibits a positive bias, differences between MIPAS and SAOZ are very small with a mean deviation over the complete altitude range of 0.21 ppbv (3.0%).
A summary of the comparison of all balloon flights is
given in Fig. 9. A mean difference profile was
calcu-lated taking into account the number of coincident measure-ment sequences. Below about 31 km, the mean difference of all intercomparisons is well inside the combined errors. However, above this altitude region, an increasing positive bias of MIPAS-E is visible reaching a magnitude of up to 0.77 ppbv (9.9%) exceeding slightly the systematic error lim-its at 38 km. The mean deviation over all altitudes between 23 and 39 km is found to be only 0.25 ppbv (3.2%). Hence the general agreement between balloon-borne observations and MIPAS-E is found to be very good.
3.2 Intercomparison of satellite observations
Satellite observations are very useful for validation of other spaceborne sensors since the number of possible coinci-dences is large and potential systematic differences appear to be very meaningful due to enhanced statistics. In the fol-lowing sections intercomparison results of different satellite sensors are being discussed. A common strategy was adapted
2 40 35 30 25 20 15 -2 -1 0 1 2 -2 -1 0 1 2 -60 -40 -20 0 20 40 60 40 35 30 25 20 15 -60 -40 -20 0 20 40 60 100 10 Mean diff.: 0.25 ± 0.08 ppbv Mean diff. MIPAS-E - SPIRALE Mean diff. MIPAS-E - MIPAS-B Mean diff. MIPAS-E - SAOZ Mean diff. MIPAS-E - All ( sd) prec. systematic tot. mean comb. err.
Al ti tu d e ( k m) Al ti tu d e ( k m) Mean diff.: 3.2 ± 1.5 % Mean diff. MIPAS-E - SPIRALE Mean diff. MIPAS-E - MIPAS-B Mean diff. MIPAS-E - SAOZ Mean diff. MIPAS-E - All ( sd) prec. systematic tot. mean comb. err.
NO2 VMR Difference (ppbv) NO2 VMR Difference (%) (MIPAS-E - Balloon) Pre ssu re (h Pa )
Fig. 9. Differences of all comparisons between MIPAS-E and balloon-borne observations of different instruments together with mean combined precision, systematic, and total errors.
for the validation of MIPAS NO2profiles by intercomparison
with these space-borne sensors, using concepts for statistical bias and precision determination with matching pairs of mea-surements as described in von Clarmann (2006). Unless oth-erwise noted, a standard collocation criterion for maximum space and time separation of 300 km and 3 h between MIPAS and the reference measurement has been applied to select the VMR comparison pairs. For each of the selected pairs, both
MIPAS and the reference instrument NO2profiles were
in-terpolated to a mean pressure grid over all collocated MIPAS measurements.
3.2.1 HALOE comparison
The Halogen Occultation Experiment (HALOE) was launched in September 1991 on board the Upper Atmo-sphere Research Satellite (UARS) and operated until Novem-ber 2005. The experiment uses solar occultation in several infrared channels and has recorded trace gas and temperature profiles of the middle atmosphere since October 1991. The
NO2data is corrected by taking into account variations of the
solar zenith angle (SZA) along the line of sight since during
day, the partitioning between NO, NO2, and N2O5depends
strongly on SZA due to the rapid photolysis of NO2and the
slower photolysis of N2O5. In this study the HALOE NO2
data version 19 is compared to MIPAS. The validation of pre-vious version 17 data (Gordley et al., 1996) shows mean dif-ferences with correlative measurements of about 10 to 15% over the middle stratosphere. Randall et al. (2002) compared
HALOE version 19 NO2 with NO2 profiles derived by the
Atmospheric Trace Molecule Spectroscopy Experiment (AT-MOS). Above 25 km the two instruments agree within about 10%. The data accuracy of ATMOS is estimated to about 6% in the altitude region between 15 and 48 km (Abrams et al., 1996). Since HALOE and MIPAS measured at different
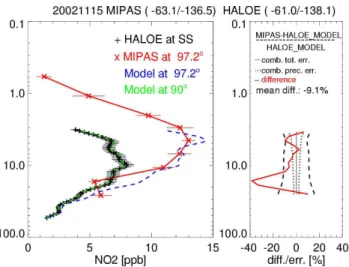
so-Fig. 10. HALOE and MIPAS comparison in the southern
hemi-sphere (Antarctic region) on 15 November 2002. HALOE measured
in occultation during sunset (SS) while MIPAS observed NO2at the
beginning of the night (SZA=97.2◦). The 1-dimensional model fits
the HALOE measurement at 90◦SZA (green and black line). The
blue line is the model output for the MIPAS SZA which compares quite well to the MIPAS observation (red line). The difference ex-ceeds the combined total errors near 15 hPa pressure altitude.
lar zenith angles a photochemical correction has been applied using a 1-dimensional photochemical model. This model is initialised with the output of a global 2-dimensional chem-istry transport model for the geolocation and day of the mea-surement. The solar occultation measurements of HALOE have been scaled to the MIPAS SZA by means of the photo-chemical model calculations (for details, see Bracher et al., 2005). An example for such a comparison is displayed in Fig. 10. Since the altitude resolutions of HALOE and MIPAS are comparable, no smoothing with averaging kernels has been applied. Differences between both sensors are shown in Tables 2 and 3. Figure 11 displays differences between MIPAS and HALOE as a function of latitude. In the south-ern hemisphere (mid-latitudes and Antarctic) and in northsouth-ern hemisphere mid-latitudes, MIPAS exhibits a positive bias to HALOE in all altitude regions. Above about 10 hPa pressure altitude this bias amounts roughly 10% or less which is close to the combined systematic error limit. For lower altitudes at mid-latitudes, the bias between both sensors is significant. In the Antarctic, however, the agreement between MIPAS and HALOE is also quite good at lower altitudes with only a small positive bias in the MIPAS data. In contrast, the arctic comparison shows a negative bias for MIPAS which is signif-icant below about 10 hPa. In general the agreement in polar latitudes is better than in mid-latitudes where the solar zenith angle distribution is more variable than in polar regions.
Table 2. Statistics of the comparison (MIPAS-HALOE)/HALOE NO2profiles as a function of the solar zenith angle (SZA). Statistical
results are given for different pressure altitudes (press. alt.) and only matches within the same air mass are included; mean relative difference (MRD), standard deviation (SD), number of collocations within the SZA range (N) are shown, too.
SZA Press. alt. MRD SD N Month of year
50◦–75◦ 8–3.1 hPa 9 to 11% 25–29% 83 Nov–Jan 03, Nov–Feb 04
75◦–89◦ 36–4.4 hPa –24 to 0% 5–9% 22 Jan 03/04, May 03, July+Aug 02/03
89◦–91◦ 20–3.4 hPa –10 to 2% 5–17% 53 Jan 03/04, Feb 03, Nov 03
91◦–101◦ 27–3.5 hPa –10 to 7% 18–27% 102 April + May 03, July 02/03
All 27–3.5 hPa 2 to 5% 20–48% 260
Table 3. Statistics of the comparison (MIPAS-HALOE)/HALOE NO2profiles for different latitudinal regions (zone). Statistical results are
given for different pressure altitudes (press. alt.) and only matches within the same air mass are included; mean relative difference (MRD), standard deviation (SD), number of collocations within the SZA range (N) are shown, too.
Zone Press. alt. MRD SD N Month of year
63◦S–74◦S 17–3.5 hPa 3 to 13% 14–28% 106 Jan 03, Nov 02/03, Dec 03
28◦S–60◦S 8–2.5 hPa 8 to 16% 25–30% 34 Jan 03, May 03, July+Aug 02/03
30◦N–52◦N 12–3.2 hPa 5 to 26% 11–53% 53 Jan 03/04, Feb 03, Nov 03
60◦N–70◦N 32–4.3 hPa –24 to –2% 9–14% 67 June 03, July 02/03
100 10 1 -40 -30 -20 -10 0 10 20 30 40 100 10 1 -40 -30 -20 -10 0 10 20 30 40
(MIPAS - HALOE_Model) / HALOE_Model [%]
Pre s su re [ h Pa ]
mean rel. dev. ± SEM SD
mean comb. sys. err. mean comb. prec. err.
Comparison of NO2 VMR at 60° to 90° (67) 100 10 1 -40 -30 -20 -10 0 10 20 30 40 100 10 1 -40 -30 -20 -10 0 10 20 30 40
(MIPAS - HALOE_Model) / HALOE_Model [%]
Pre s su re [ h Pa ]
mean rel. dev. ± SEM SD
mean comb. sys. err. mean comb. prec. err.
Comparison of NO2 VMR at 30° to 60° (53) 100 10 1 -40 -30 -20 -10 0 10 20 30 40 100 10 1 -40 -30 -20 -10 0 10 20 30 40
(MIPAS - HALOE_Model) / HALOE_Model [%]
P re ssu re [ h Pa ]
mean rel. dev. ± SEM SD
mean comb. sys. err. mean comb. prec. err.
Comparison of NO2 VMR at -60° to -28° (34) 100 10 1 -40 -30 -20 -10 0 10 20 30 40 100 10 1 -40 -30 -20 -10 0 10 20 30 40
(MIPAS - HALOE_Model) / HALOE_Model [%]
Pr e ssu re [ h Pa ]
mean rel. dev. ± SEM SD
mean comb. sys. err. mean comb. prec. err.
Comparison of NO2 VMR at -90° to -60° (106)
Fig. 11. Mean relative differences (including the standard error of the mean, SEM) between MIPAS and HALOE for different latitude
regions in the northern hemisphere (top) and the southern hemisphere (bottom). Standard deviation (SD) and mean combined precision and systematic errors are plotted, too.
2
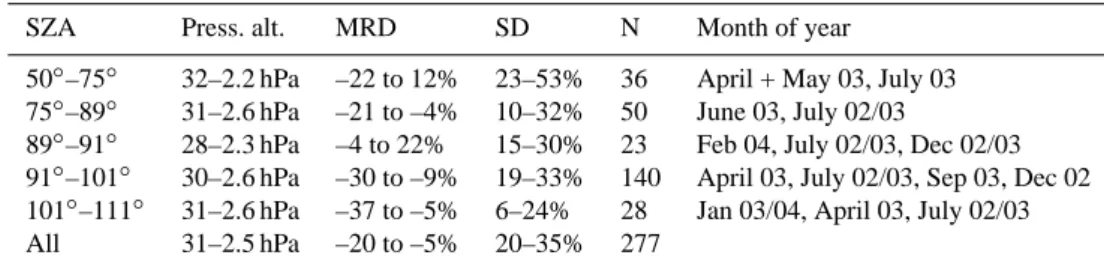
Table 4. Statistics of the comparison (MIPAS-SAGE II)/SAGE II NO2profiles as a function of the solar zenith angle (SZA). Statistical
results are given for different pressure altitudes (press. alt.) and only matches within the same air mass are included; mean relative difference (MRD), standard deviation (SD), number of collocations within the SZA range (N) are shown, too.
SZA Press. alt. MRD SD N Month of year
50◦–75◦ 32–2.2 hPa –22 to 12% 23–53% 36 April + May 03, July 03
75◦–89◦ 31–2.6 hPa –21 to –4% 10–32% 50 June 03, July 02/03
89◦–91◦ 28–2.3 hPa –4 to 22% 15–30% 23 Feb 04, July 02/03, Dec 02/03
91◦–101◦ 30–2.6 hPa –30 to –9% 19–33% 140 April 03, July 02/03, Sep 03, Dec 02
101◦–111◦ 31–2.6 hPa –37 to –5% 6–24% 28 Jan 03/04, April 03, July 02/03
All 31–2.5 hPa –20 to –5% 20–35% 277
Table 5. Statistics of the comparison (MIPAS-SAGE II)/SAGE II NO2profiles for different latitudinal regions (zone). Statistical results are
given for different pressure altitudes (press. alt.) and only matches within the same air mass are included; mean relative difference (MRD), standard deviation (SD), number of collocations within the SZA range (N) are shown, too.
Zone Press. alt. MRD SD N Month of year
63◦S–80◦S 27–2.3 hPa 0 to 38% 17–29% 28 Dec 02/03, Feb 04
28◦S–55◦S 30–2.2 hPa –30 to 7% 23–51% 63 Jan 03/04, April-May 03, July 03
45◦N–60◦N 32–2.7 hPa –40 to –18% 10–20% 28 Jan 03, April 03, July 02/03
60◦N–76◦N 32–2.7 hPa –32 to –11% 11–25% 158 April+June 03, July 02/03, Sep 03
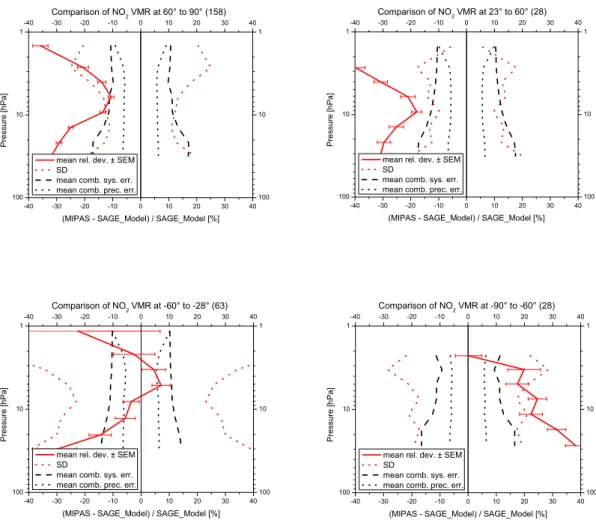
3.2.2 SAGE II comparison
The Stratospheric Aerosol and Gas Experiment II (SAGE II) on the Earth Radiation Budget Satellite (ERBS) has been launched into its non-sun synchronous orbit in October 1984. SAGE-II is a seven-channel solar occultation instrument col-lecting aerosol and trace gas data during each sunrise and sunset. It was powered off in August 2005. In this study
the NO2 data version 6.2 is used for the intercomparison
to MIPAS. The precision and accuracy of NO2 data has
been assessed by Cunnold et al. (1991). This former ver-sion 5.96 shows an agreement within 10% to balloon profiles and ATMOS measurements in the altitude range between 23 and 37 km. The photochemical correction has been ap-plied in the same way as for the HALOE-MIPAS
compari-son. Averaging kernel smoothing of the NO2profiles could
be neglected due to similar vertical resolutions of SAGE II and MIPAS. Differences between both sensors are displayed in Tables 4 and 5. Latitudinal differences of both sensors are shown in Fig. 12. In southern hemisphere mid-latitudes the agreement between MIPAS and SAGE II is quite good. Except the highest (near 1 hPa) and lowest (below 20 hPa) altitude levels, where a significant negative bias is visible, differences are within the combined errors. In the northern hemisphere, a significant negative bias is obvious especially for the mid-latitude case where mean relative deviations of more than 20% are found for most altitudes. It is known that
SAGE II NO2has a positive bias compared to HALOE NO2
(L. Thomason, personal communication, 2004). Bearing this fact in mind this would reduce the mentioned negative bias between MIPAS and SAGE II. However, in the Antarctic, a positive bias of up to 38% near 30 hPa is visible. In con-trast to HALOE, no corrections of variations of the solar zenith angle along the line of sight of SAGE II were per-formed. This may introduce some inaccuracies in the SAGE
II NO2data. Payan et al. (1999) estimated such VMR errors
to less than 6%. Anyhow, this helps to at least partly explain the comparatively large discrepancies between MIPAS and SAGE II.
3.2.3 POAM III comparison
The Polar Ozone and Aerosol Measurement III (POAM III) instrument was carried by the SPOT-4 spacecraft and was launched in March 1998. The instrument failed in December 2005. The solar occultation was performed in nine spectral channels in the visible and near-IR spectral region. The new
NO2 data version 4 has been used for the intercomparison
with MIPAS. The precision and accuracy of POAM III
ver-sion 3 NO2data is given by Lumpe et al. (2002). This data
has been validated by Randall et al. (2002) showing an agree-ment to HALOE from 20 to 33 km within 6% and from 33 to 40 km between 6 and 12%. The new POAM III version 4 data is described in a technical note (“Overview of the validation of POAM III version 4 retrievals”) available from the public web-site http://wvms.nrl.navy.mil/POAM/poam.html. Dif-ferences compared to HALOE (version 19) are within 10%
100 10 1 -40 -30 -20 -10 0 10 20 30 40 100 10 1 -40 -30 -20 -10 0 10 20 30 40
(MIPAS - SAGE_Model) / SAGE_Model [%]
Pr e s s u re [ h P a ]
mean rel. dev. ± SEM SD
mean comb. sys. err. mean comb. prec. err.
Comparison of NO2 VMR at 60° to 90° (158) 100 10 1 -40 -30 -20 -10 0 10 20 30 40 100 10 1 -40 -30 -20 -10 0 10 20 30 40
(MIPAS - SAGE_Model) / SAGE_Model [%]
Pre ssu re [ h Pa ]
mean rel. dev. ± SEM SD
mean comb. sys. err. mean comb. prec. err.
Comparison of NO2 VMR at 23° to 60° (28) 100 10 1 -40 -30 -20 -10 0 10 20 30 40 100 10 1 -40 -30 -20 -10 0 10 20 30 40
(MIPAS - SAGE_Model) / SAGE_Model [%]
P re ssu re [ h Pa ]
mean rel. dev. ± SEM SD
mean comb. sys. err. mean comb. prec. err.
Comparison of NO2 VMR at -60° to -28° (63) 100 10 1 -40 -30 -20 -10 0 10 20 30 40 100 10 1 -40 -30 -20 -10 0 10 20 30 40
(MIPAS - SAGE_Model) / SAGE_Model [%]
Pr e s su re [ h Pa ]
mean rel. dev. ± SEM SD
mean comb. sys. err. mean comb. prec. err.
Comparison of NO2 VMR at -90° to -60° (28)
Fig. 12. Mean relative differences (including the standard error of the mean, SEM) between MIPAS and SAGE II for different latitude
regions in the northern hemisphere (top) and the southern hemisphere (bottom). Standard deviation (SD) and mean combined precision and systematic errors are plotted, too.
Table 6. Statistics of the comparison (MIPAS-POAM III)/POAM III NO2profiles for different seasons (time) in both hemispheres. Statistical results are given for different pressure altitudes (press. alt.) and only matches within the same air mass are included; mean relative difference (MRD), standard deviation (SD), number of collocations (N) within the solar zenith angle (SZA) and latitude range are shown, too.
Time Press. alt. MRD SD N SZA Latitude
Northern hemisphere (March 2003–Sep 2003)
Spring 36–4.3 hPa –46 to –10% 9–14% 36 97◦–106◦ 54◦N–63◦N
Summer 34–3.8 hPa –27 to 0% 8–17% 61 98◦–107◦ 56◦N–71◦N
Winter 14–3.9 hPa 2 to 15% 5–31% 10 106◦–109◦ 65.7◦N–67◦N
All 22–4.0 hPa –9 to 8% 11–18% 107
Southern hemisphere (Nov 2002–Nov 2003)
Spring 22–3.1 hPa –7 to 28% 10–48% 125 89.6◦–93.5◦ 68◦S–82◦S
Summer 31–3.6 hPa –7 to 16% 11–17% 56 91.7◦–96◦ 67◦S–78◦S
Fall 4–2.3 hPa –20 to –14% 40–53% 43 89.9◦–93◦ 63◦S–83◦S
Winter No comparison due to large mean standard deviation
2 100 10 1 -40 -30 -20 -10 0 10 20 30 40 100 10 1 -40 -30 -20 -10 0 10 20 30 40
(MIPAS - POAM_Model) / POAM_Model [%]
Pr e s s u re [ h Pa ]
mean rel. dev. ± SEM SD
mean comb. sys. err. mean comb. prec. err.
Comparison of NO2 VMR at NH Jan.-Mar. (10) 100 10 1 -600 -400 -200 0 200 400 600 100 10 1 -600 -400 -200 0 200 400 600
(MIPAS - POAM_Model) / POAM_Model [%]
Pr e ssu re [ h Pa ]
mean rel. dev. ± SEM SD
mean comb. sys. err. mean comb. prec. err.
Comparison of NO2 VMR at SH Jul.-Sep. (43) 100 10 1 -40 -30 -20 -10 0 10 20 30 40 100 10 1 -40 -30 -20 -10 0 10 20 30 40
(MIPAS - POAM_Model) / POAM_Model [%]
Pr e s s u re [ h Pa ]
mean rel. dev. ± SEM SD
mean comb. sys. err. mean comb. prec. err.
Comparison of NO2 VMR at NH Apr.-Jun. (36) 100 10 1 -40 -30 -20 -10 0 10 20 30 40 100 10 1 -40 -30 -20 -10 0 10 20 30 40
(MIPAS - POAM_Model) / POAM_Model [%]
Pr e s s u re [ h Pa ]
mean rel. dev. ± SEM SD
mean comb. sys. err. mean comb. prec. err.
Comparison of NO2 VMR at SH Oct.-Dec. (125) 100 10 1 -40 -30 -20 -10 0 10 20 30 40 100 10 1 -40 -30 -20 -10 0 10 20 30 40
(MIPAS - POAM_Model) / POAM_Model [%]
P re ss u re [ h Pa ]
mean rel. dev. ± SEM SD
mean comb. sys. err. mean comb. prec. err.
Comparison of NO2 VMR at NH Jul.-Sep. (61) 100 10 1 -40 -30 -20 -10 0 10 20 30 40 100 10 1 -40 -30 -20 -10 0 10 20 30 40
(MIPAS - POAM_Model) / POAM_Model [%]
P re ss u re [ h Pa ]
mean rel. dev. ± SEM SD
mean comb. sys. err. mean comb. prec. err.
Comparison of NO2 VMR at SH Jan.-Mar. (56)
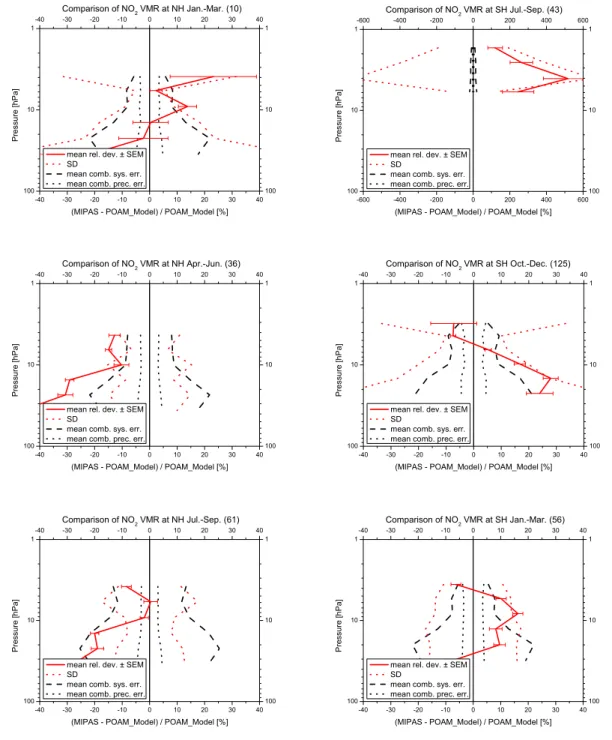
Fig. 13. Mean relative differences (including the standard error of the mean, SEM) between MIPAS and POAM III for different seasons:
winter (top), spring (middle), summer (bottom) in the northern (left) and southern (right) hemisphere. Standard deviation (SD) and mean combined precision and systematic errors are plotted, too (please note different scale for the graph top right).
from 25–35 km, but approach 20% or higher (POAM higher than HALOE) near 20 km and 40 km. POAM III sunrise or sunset data and SAGE II (version 6.2) sunset data is within
±10% from 25–35 km. Comparisons with SAGE II sunrise
data, however, suggest a SAGE II sunrise negative bias of more than 15%. The photochemical correction was applied like in the previous satellite comparisons. A smoothing with
averaging kernels was not necessary due to similar vertical resolutions of POAM III and MIPAS. Differences between both sensors in dependence of season are given in Table 6 and Fig. 13. In the northern hemisphere (NH) winter (Jan-uary to March) measurements of both sensors agree within about 15%. In the NH spring (April to June) a negative bias
about 10 hPa. A negative bias appears also in the NH summer (July to September) observations, especially below 10 hPa, but due to the quite large combined systematic errors this bias is not significant. The comparison in SH summer (January to March) exhibits an agreement of both sensors within 15%. Except the altitude region below about 10 hPa this holds also for the SH spring comparison (October to December). In the SH fall (April to June, see Table 6) below 4 hPa and winter (July to September, see Fig. 13) very large deviations be-tween MIPAS and POAM occur, which might be connected to observations near and across the vortex edge and/or con-nected limitations of the correction with the photochemical model. One reason could be effects of strong horizontal
gra-dients in temperature and NO2along the line of sight which
are not included in the NO2data retrievals. This holds for the
SH winter where no comparison was possible due to large standard deviations. It should be mentioned that POAM SH measurements (and therefore the MIPAS-POAM SH
collo-cations) have been performed at higher latitudes (63◦S to
83◦S) as compared to the NH latitudes (54◦N to 71◦N). This
explains the higher possibility of polar vortex coverage. Like SAGE II, no corrections of variations of the solar zenith an-gle along the line of sight of POAM III were performed what
may introduce inaccuracies in the POAM III vertical NO2
profiles. On the other hand, it should be emphasized that
un-der extreme winter conditions standard NO2microwindows
used by the MIPAS retrieval processor do not contain
signif-icant information in the lower stratosphere such that the NO2
data are not very reliable in this case (see also Sect. 3.2.5).
3.2.4 ACE comparison
The Atmospheric Chemistry Experiment (ACE), on the SCISAT-1 satellite, was launched into its orbit in August 2003 (Bernath et al., 2005). The primary instrument is a
high resolution (0.02 cm−1) Fourier transform spectrometer
(ACE-FTS) operating between 750 and 4400 cm−1 in solar
occultation. In this work, we only examine results from the FTS, and hereafter refer to the ACE-FTS simply as ACE. Vertical profiles of various atmospheric constituents are re-trieved from measured spectra with a vertical resolution of 3–
4 km with a nearly global coverage from about 85◦N to 85◦S
with a majority of observations in the Arctic and
Antarc-tic. NO2profile comparisons (data version 1.0) to HALOE
version 19 NO2have shown that both sensors agree within
10% between 22 and 35 km altitude with lower values of ACE compared to HALOE (McHugh et al., 2005). For this study, only arctic daytime sunset profiles (data version 2.2)
around 75◦N are compared to MIPAS daytime observations.
A photochemical correction has been applied to the data with the help of calculations performed by the three dimen-sional CTM KASIMA according to the method described in Sect. 3.1. The limited horizontal resolution of the model may introduce systematic inaccuracies in the photochemical cor-rection when transferring the sunset ACE data to the time and
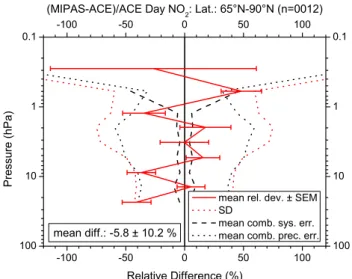
100 10 1 0.1 -100 -50 0 50 100 100 10 1 0.1 -100 -50 0 50 100
(MIPAS-ACE)/ACE Day NO2: Lat.: 65°N-90°N (n=0012)
Relative Difference (%) P re ssu re (h P a )
mean rel. dev. ± SEM SD
mean comb. sys. err. mean comb. prec. err.
mean diff.: -5.8 ± 10.2 %
Fig. 14. Mean relative difference (including the standard error of
the mean, SEM) of MIPAS and ACE NO2 profiles (12
colloca-tions) between 65◦and 90◦N latitude in February and March 2004
(red solid line). Random (black dotted line) and systematic (black dashed line) parts of the combined errors are shown together with the standard deviation (red dotted line). Some significant system-atic differences appear mainly below about 6 hPa pressure altitude (about 32 km).
location of MIPAS day measurements. To avoid such effects, the collocation criterion was tightened in terms of time and set to 1 h.
The mean difference of all collocations (between 4 Febru-ary and 26 March 2004) is shown in Fig. 14. The overall agreement of both sensors is very good. A tendency to a small negative bias is visible for pressure altitudes below 6 hPa (about 32 km) and extends to about 40% at the low-est altitude level. However, the overall negative mean bias is only 5.8% and remains mostly within the combined system-atic error, which is underestimated since no systemsystem-atic error data is available for the ACE observations.
3.2.5 Retrieval processor comparison
It has been shown that atmospheric NO2ν3 IR emissions
might depart from local thermodynamic equilibrium (LTE) in the mesosphere and upper stratosphere (see, e.g., L´opez-Puertas and Taylor, 2001). An innovative non-LTE retrieval scheme (Funke et al., 2001) has been included in the scien-tific MIPAS data processor (von Clarmann et al., 2003) de-veloped at the Institut f¨ur Meteorologie und Klimaforschung (IMK) and the Instituto de Astrof´ısica de Andaluc´ıa (IAA). In contrast to the ESA operational processor, the IMK/IAA
retrieval code allows accurate inference of NO and NO2
vol-ume mixing ratios under consideration of all important non-LTE processes. Main results of this processor comparison are depicted in Fig. 15. These comparisons have been per-formed for undisturbed conditions (24 September 2002) and
2 70 60 50 40 30 20 0 5 10 15 20 70 60 50 40 30 20 0 5 10 15 20 -100-80 -60 -40 -20 0 20 40 60 80 100 70 60 50 40 30 20 -100-80 -60 -40 -20 0 20 40 60 80 100 NO2 VMR (ppbv) NO2 day all 20020924 IMK/IAA ESA Al ti tu d e (km) Diff. ± SEM SD
Mean VMR Diff. (ESA-IMK/IAA) (%)
Al ti tu d e (km)
ESA-IMK/IAA Mean Difference
70 60 50 40 30 20 0 5 10 15 20 70 60 50 40 30 20 0 5 10 15 20 -100-80 -60 -40 -20 0 20 40 60 80 100 70 60 50 40 30 20 -100-80 -60 -40 -20 0 20 40 60 80 100 NO2 VMR (ppbv) NO2 night all 20020924 IMK/IAA ESA Al ti tu d e (km) Diff. ± SEM SD
Mean VMR Diff. (ESA-IMK/IAA) (%)
Al ti tu d e (km)
ESA-IMK/IAA Mean Difference
70 60 50 40 30 20 1 10 100 70 60 50 40 30 20 1 10 100 -100-80 -60 -40 -20 0 20 40 60 80 100 70 60 50 40 30 20 -100-80 -60 -40 -20 0 20 40 60 80 100 NO2 VMR (ppbv) NO 2 polar night 2004 IMK/IAA ESA A lt it u d e ( k m) Diff. ± SEM SD
Mean VMR Diff. (ESA-IMK/IAA) (%)
A lt it u d e ( k m)
ESA-IMK/IAA Mean Difference
Fig. 15. Comparison of MIPAS NO profiles and mean deviations (including the standard error of the
Fig. 15. Comparison of MIPAS NO2profiles and mean deviations (including the standard error of the mean, SEM, and the standard deviation,
SD) retrieved by the IMK/IAA scientific and ESA operational processors from sequences measured on 24 September 2002 during day (top left) and night (top right). Mean polar night profiles and deviations within the period from 17 February to 25 March 2004 are also shown (bottom, please note different scale in left graph). The comparison is performed on a pressure grid although altitudes are shown.
perturbed conditions (nighttime only, NH winter 2003/2004)
with a strong subsidence of mesospheric NOx. Large
differ-ences appear especially at higher altitudes above about 50 to 55 km for the September comparison. ESA results at these high altitudes show extremely high variability. IMK/IAA trievals have shown that residuals could be significantly
re-duced by readjusting the collisional rate for N2to a value 20
times higher than the nominal one. The non-LTE effect in
NO26.2 µm emissions is thus less important than previously
estimated (i.e. up to 30%, Funke et al., 2005a) and gener-ally amounts to only 3%, although more than 20% can be reached under extreme polar winter conditions above 60 km. Non-LTE, however, cannot account alone for the discrepancy at these altitudes.
In the stratosphere (September 2002 case) the ESA
re-trievals yield up to 10% lower NO2 volume mixing ratios
during day and mostly less than 5% during nighttime com-pared to the IMK/IAA retrievals. The instrumental line shape
(ILS) models of IMK/IAA and ESA used for the retrievals are slightly different. Sensitivity studies for the September case have shown that this could partly explain the VMR dif-ferences between ESA and IMK/IAA retrievals. Difdif-ferences
in temperature profiles used for the NO2retrievals have been
checked for 24 September 2002. In general, ESA retrieved temperatures are higher than those inferred by IMK/IAA by up to 5 K at 70 km and 1–2 K between 35 and 50 km
alti-tude. Estimating the Planck function effect for NO2
emis-sions at 1600 cm−1, a 1.5 K overestimation by ESA would
result in roughly 6% underestimation of NO2volume mixing
ratios. This helps to explain differences between ESA and IMK/IAA retrievals below 50 km altitude.
The comparison of IMK/IAA and ESA retrievals during perturbed conditions (winter 2003/04, see Fig. 15, bottom)
shows qualitatively good agreement (note, that NO2VMRs
at these conditions vary over several orders of magnitude), although ESA values are 10–40% higher between 30 and
40 km and 20–60% lower at 50–65 km. Differences above 50 km might be explained at least partly by non-LTE (under polar winter conditions); below they are probably related to
horizontal NO2gradients, which are explicitly treated in the
IMK/IAA retrieval, and differences in the retrieved
temper-ature profiles. It should be noted that whenever NO2
val-ues are very high in the upper stratosphere and lower meso-sphere, which was the case in the Antarctic polar region in winter 2003 (Funke et al., 2005b) and in the Arctic winter
2003/04, NO2values retrieved by the operational processor
at 30 km and below suffer from very large errors. The rea-son seems to be that under these extreme conditions standard
NO2microwindows used by the ESA processor do not
con-tain significant information in the lower stratosphere. This fact can also help to explain why large deviations prevented a reasonable comparison between MIPAS and POAM III in the Antarctic winter 2003 (cp. Sect. 3.2.3).
3.3 Intercomparison of NDACC ground-based
observa-tions
Nitrogen dioxide is one of the key species monitored from pole to pole by the ground-based Network for the Detection of Atmospheric Composition Change (NDACC), a main con-tributor to WMO’s Global Atmosphere Watch program and formerly known as the Network for the Detection of Strato-spheric Change (NDSC). In the framework of this worldwide network of high-quality remote-sounding stations, two dif-ferent measurement techniques provide complementary
ob-servations of the vertical column amount and profile of NO2
and its diurnal variation along the day. Sunrise and sun-set columns are retrieved from zenith-scattered sunlight ab-sorption measurements in the 400–500 nm range performed year-round by more than 30 Differential Optical Absorption (DOAS) UV-visible spectrometers (Roscoe et al., 1999;
Van-daele et al., 2005, and references therein). Daytime NO2
column is retrieved at various solar zenith angles from solar
radiation absorption measurements by the NO2 multiplet at
2914.65 cm−1 performed, weather permitting, by about 10
Fourier Transform infrared (FTIR) spectrometers (Notholt and Schrems, 1994; De Mazi`ere et al., 1998). Both measure-ment techniques are sensitive mainly to the stratospheric part of the vertical column. In addition to those column retrievals,
height-resolved information on NO2is also derived at a few
NDACC/DOAS stations taking into account the significant variation of the mean scattering height of zenith-sky observa-tions during twilight (McKenzie et al., 1991; Hendrick et al., 2004). The independent validation of atmospheric chemistry satellite missions is a main objective of the NDACC
(Lam-bert et al., 1999). Although measuring stratospheric NO2at
poor vertical resolution, its ability to provide high-quality, continuous time-series at a variety of sites from pole to pole has been helpful in validating seasonal signals and
merid-ian structures reported by NO2satellite sensors like HALOE
(Gordley et al., 1996), GOME (Lambert et al., 2002), POAM
III (Randall et al., 2002) and SCIAMACHY (Piters et al., 2006). In this section we will study how partial stratospheric columns derived from MIPAS measurements are consistent with correlative observations reported by the various compo-nents of the NDACC.
The confrontation of MIPAS and NDACC data has to
ad-dress two main issues: the diurnal variation of NO2 which
can generate dramatic differences between data recorded at different hours of the day, and the fact that MIPAS accuracy degrades rapidly at altitudes below 24 km. FTIR observa-tions can offer the best time coincidence with MIPAS data acquired in the mid-morning part of the orbit, without the use of a photochemical model to allow for time differences of less than 1 h. We will concentrate here on the instrument at the Institutet foer Rymdfysik (IRF) in Kiruna (Arctic
Swe-den, 67.8◦N, 20.4◦E). It is operated by IMK Karlsruhe, IRF
Kiruna, and University of Nagoya. This instrument records atmospheric absorptions of the infrared solar spectrum with
a high spectral resolution of approximately 0.003 cm−1.
Ex-perimental details have been published elsewhere (e.g. Blu-menstock et al., 1997). Measured spectra are evaluated using the retrieval code PROFFIT (Hase et al., 2004), one of the reference codes accepted by the NDACC, and the forward model KOPRA (Stiller et al., 2002). Spectroscopic param-eters are taken from the HITRAN database (Rothman et al.,
2005). The precision of individual NO2measurements
per-formed by FTIR spectrometry is less than 10% (Sussmann et al., 2005). The accuracy is estimated to be about 10%.
The spectroscopic characteristics of the NO2multiplet (weak
lines, interfering with strong methane absorptions) make it impossible to separate the contribution of the tropospheric
NO2 column to the measured absorption. In fact, the
ab-sorption of the tropospheric NO2column is covered by broad
band absorption of methane and therefore the retrieved NO2
column amount is representative mainly for the stratospheric column.
Results of the FTIR-based comparison in Kiruna are dis-played in Fig. 16 for the period February until September 2003. No significant deviations are visible between MIPAS columns, calculated directly from the profile VMRs or calcu-lated after smoothing to the altitude resolution of the
ground-based FTIR. The seasonal variation of the NO2 columns is
captured similarly by both instruments. Differences between FTIR and MIPAS partial columns are very small in summer with less than 10% and without a bias. However, in autumn (September) and winter, deviations are larger and reach up to 45% on 24 February 2003 with a general positive bias in the MIPAS data. The PV difference at 475 K is within 15% for these collocations.
The problem of altitude limitations of MIPAS can be min-imized when comparing with height-resolved data retrieved from ground-based UV-visible spectra measured before and during twilight. Here, we will concentrate on the instru-ment operated by BIRA-IASB in Harestua (Southern