Development of Statistical Methodologies and Risk Models to
Perform Real-Time Safety Monitoring in Interventional Cardiology
By
Michael E. Matheny, M.D.
M.D. (2001)
University of Kentucky, Lexington, KY
Submitted to the Harvard-MIT Division of Health Sciences & Technology in Partial Fulfillment of the Requirements to the Degree of Master of Science in Biomedical Informatics
At th.
-L LL1%
Massachusetts Institute of Technology
June 2006 MASSACHUSETTS i OF TECHNOLC JUN 3 0 2 NSTiTUE )GY 0ES EZS Signature of Author
/1
AlHarvard-MIT Division of Health9ciences and Technology May 12, 2006 /(
Certified by
Frederic S. Resnic, MD, MS Assistant Professor of Medicine Harvard Medical School
Thesis Supervisor
\.~~~~~~~1
Accepted by k A , ,
Accepted \ v v Martha Gray, PhD
Edward Hood Taplin Pro essor of edical and Electrical Engineering Director, Harvard-MIT Division Health Sciences and Technology
jeMay, 2006z
May, 2006
© Michael E. Matheny, M.D. All Rights Reserved.
The author hereby grants to MIT permission to reproduce and distribute copies of this thesis document in whole or in part in any medium now known or hereafter created.
LIBRARII
RCHIVES
__
Development of Statistical Methodologies and Risk Models to Perform
Real-Time Safety Monitoring in Interventional Cardiology
By
Michael E. Matheny, M.D.
Submitted to the Harvard-MIT Division of Health Sciences & Technology on May 12, 2006 in Partial Fulfillment of the Requirements to the Degree of Master of Science in Biomedical
Informatics
Abstract
Post-marketing surveillance of medical pharmaceuticals and devices has received a great deal of media, legislative, and academic attention in the last decade. Among medical devices, these have largely been due to a small number of highly publicized adverse events, some of them in the domain of cardiac surgery and interventional cardiology. Phase three clinical trials for these devices are generally underpowered to detect rare adverse event rates, are performed in near-optimal environments, and regulators face significant pressure to deliver important medical devices to the public in a timely fashion.
All of these factors emphasize the importance of systematic monitoring of these devices after being released to the public, and the FDA and other regulatory agencies continue to struggle to performthis duty using a variety of voluntary and mandatory adverse event rate reporting policies. Data quality and comprehensiveness have generally suffered in this environment, and delayed awareness of potential problems. However, a number of mandatory reporting policies combined with improved standardization of data collection and definitions in the field of interventional cardiology and other clinical domains have provided recent opportunities for nearly "real-time" safety monitoring of medical device data.
Existing safety monitoring methodologies are non-medical in nature, and not well adapted to the relatively heterogeneous and noisy data common in medical applications. A web-based database-driven computer application was designed, and a number of experimental
statistical methodologies were adapted from non-medical monitoring techniques as a proof of concept for the utility of an automated safety monitoring application. This application was successfully evaluated by comparing a local institution's drug-eluting stent in-hospital mortality rates to University of Michigan's bare-metal stent event rates. Sensitivity analyses of the experimental methodologies were performed, and a number of notable performance parameters were discovered. In addition, an evaluation of a number of well-validated external logistic regression models, and found that while population level estimation was well-preserved, individual estimation was compromised by application to external data. Subsequently,
exploration of an alternative modeling technique, support vector machines, was performed in an effort to find a method with superior calibration performance for use in the safety monitoring application.
Thesis Supervisor: Frederic S. Resnic
Biography: Michael E. Matheny received a National Merit Scholarship to attend the University
of Kentucky's School of Engineering (1991-1997), and participated as a co-operative student (1994-1995) in activated carbon research at the Center For Applied Energy Research (Lexington, KY). He subsequently graduated Cum Laude in Chemical Engineering. He then attended
University of Kentucky's School of Medicine (1997-2001) and was awarded the Robert P. Meriwether Scholarship (2000-2001). Dr. Matheny conducted his Internal Medicine training at St. Vincent's Hospital (Indianapolis, IN), and was awarded 1st place for a research abstract at the
Indiana chapter of the American College of Physicians (2003) as well as receiving the Internal Medicine Research Award from St. Vincent's Hospital (2004). He was the recipient of a National Library of Medicine sponsored fellowship in biomedical informatics (2004-2007) conducted with the Decision Systems Group at Brigham & Women's Hospital under the direction of Dr. Robert Greenes. Dr. Matheny is a Diplomat of the American Board of Internal Medicine.
Contents:
Introduction... 5
Chapter 1: Performance Evaluation of Logistic Regression Risk Models ... 9
Chapter 2: Performance Evaluation of Support Vector Machine Risk Models ... 19
Chapter 3: Design and implementation of an Automated Real-Time Safety Monitoring Application ... 27
Chapter 4: Sensitivity Analysis of SPC and BUS Alerting Thresholds ... 42
Summary ... 50
Introduction
Post-marketing surveillance of medical devices by the Food and Drug Administration (FDA) has undergone tremendous change in the last few decades. 1-4 These changes were largely
due to a small number of highly publicized adverse events; some of them in the domain of cardiac surgery and interventional cardiology.3' 5-13
Medical devices are frequently released quickly because of the need to deliver potentially lifesaving medical advances to the public. Rare adverse events are an ongoing concern in this environment because they may not be discovered in pre-marketing trials due to a small sample sizes and a bias towards healthier subjects.14 To balance this, the FDA has shifted more of its device evaluation to the post-marketing period.1 5 This creates the potential for large numbers of
patients to be exposed to a new product in the absence of long-term follow-up data, and emphasizes the need for comprehensive methods in post-marketing surveillance.1 6
The data the FDA uses to conduct this surveillance is very heterogeneous, and results from a variety of voluntary and mandatory reporting policies.1 6 14, 7-22 The voluntary policies create significant limitations in event rate recognition through underreporting, bias, and highly variable reporting quality.'4 In response, some agencies have implemented mandatory reporting for medical devices in certain clinical areas, and medical societies have made strides in
standardizing data element definitions within their respective domains.23
Continued improvements in the quality and volume of reported data have created opportunities for timely and efficient analysis and reporting of alarming trends in patient outcomes. However, standard techniques regarding alerting thresholds and benchmarking methodologies do not exist for post-marketing medical device surveillance. Non-medical
industries have been using a variety of automated statistical process control (SPC) techniques for some time for comparable quality control purposes. 28-32 These systems rely on high-quality
automated data collection, and apply stringent error thresholds24that make direct application of these methods for medical devices difficult.
Statistical process control is a classical frequentist technique typically comparing observed event rates to acceptable rates of adverse events based on previously published or observed empirical data. However, this is very limiting when no or very limited prior empirical data are available. Another methodology, Bayesian updating statistics (BUS), seeks to address
this limitation directly through the construction and explicit use of prior probability estimates and provide direct comparison of the final posterior distribution to the prior estimate.
Establishing a standard methodology for the selection and incorporation of prior
empirical data to generate alerting thresholds integral is integral to this endeavor. Both SPC and BUS provide for population-level thresholds with static risk stratification. Logistic regression (LR) is the most popular of the modeling techniques that have been developed over the last few decades to help stratify and predict risk for patient subpopulations. These models have been widely used to improve the quality of care,2 5provide institutional quality scorecards2 6, provide risk stratification2 7 and assist patient selection2 8 in research, evaluate futility of care,2 9 and to provide individual patient prognostications. The ability of LR to individually risk stratify a patient using a large number of clinical factors could be used to develop a stand-alone
monitoring methodology, or be used synergistically with other methods as a risk stratification tool.
Interventional cardiology (IC) is an ideal medical domain to pioneer prospective real-time safety monitoring in medical devices for a number of reasons. Not only has IC been an active area of medical device development in recent years, but it is one of the few domains with high quality comprehensive data. This is largely due to the development of a national
standardized data dictionary,23 and an increase in mandatory electronic data collection and reporting by some state agencies.
In addition, there are a number of well-known LR mortality risk models that have been developed in IC over the last 15 years.3 0 3 5 Several studies of these models have shown good
36-40
external validation with respect to both calibration and discrimination.3 6 4 Others have shown a loss in either discrimination, calibration,4 or both.42 This is thought to be primarily related to medical practice and patient composition changes related to geography and time.43' 44 A study comparing the demographics of percutaneous coronary intervention (PCI) patients in two
registries collected twelve years apart found significant differences in a number of important risk factors.4 5
This highlights the need for a thorough evaluation of existing and newly developed LR models for use with a safety monitoring system. Also, exploration of alternative modeling techniques, such as a new machine learning technique called Support Vector Machines (SVM), could potentially improve risk stratification performance in this domain.
The specific goals of this project are to:
1) Develop local logistic regression (LR) risk models, and validate both local and well-known external LR models in order to optimize this modeling method for use in a real-time safety monitoring tool.
2) Explore a recent advance in machine learning, support vector machines, as an alternative risk modeling and stratification method for use in the monitoring application.
3) Develop prospective methods of statistical monitoring and alerting thresholds. Exploration of these methods will include derivations of statistical process control, Bayesian updating statistics, and logistic regression based risk stratification and assessment.
4) Implement a web-based safety monitoring tool in interventional cardiology that allows detailed evaluation of specific outcomes.
5) Perform a sensitivity analysis between statistical process control and Bayesian statistical updating monitoring methods on interventional cardiology data.
Manuscript Organization
This manuscript will be organized into four chapters. Chapter One will describe the design of a new local logistic regression model for the outcome of post-intervention in-hospital death. This model will then be internally validated, and external validation will be conducted on a number of well-known logistic regression models for this outcome from other centers.
Chapter Two which will explore a new machine learning methodology, support vector machines, to determine if the use of this risk modeling method would be a reasonable addition to the safety monitoring tool.
The results of the LR model evaluations were incorporated into the design and
development of the statistical methodologies necessary to conduct real-time safety monitoring. The development of these methods, as well as the implementation of a web-based application providing this type of analysis, will be described in Chapter Three.
A sensitivity analysis between statistical process control and Bayesian updating statistics methodologies will be performed in Chapter Four. Actual interventional cardiology data will be used to provide scaled outcome rates for evaluation over a range of baseline event rates and volumes. A conclusion will then summarize the findings in each portion of the work.
Chapter 1: Performance Evaluation of Logistic Regression Risk Model
Background
In the last decade, significant emphasis has been placed on the development of statistical models to help predict risk in various patient populations. In addition to providing the basis for quality scorecards, 26 46 these risk profiles can be helpful on the procedural level to both patients and physicians. Numerous studies have shown that subjective prediction of risk tends to be poor at very low and very high probabilities.4 7' 48 The use of various statistical methods can provide an objective estimation of outcome risk.
There has been conflicting literature on whether or not these models can be used outside of their development population. Initial validation is usually based on patients from a given geography and time frame. These evaluations are only directly applicable in that respect, and concerns have been raised about the applicability of a model when patient demographics change with geography, clinical practice changes with time, and disease prevalence changes with both. Some of this concern stems from prior analyses showing deleterious effects on accuracy by changes in geography and time.4 3 A study comparing the demographics of percutaneous coronary intervention (PCI) patients in two registries collected twelve years apart found significant differences in age, lesion severity, thrombolytic use, stent use, and death that highlight how much the characteristics of a population can change with a decade of medical advances.45
Continuous evaluation of model performance is important to ascertain that classification performance does not degrade with time. Some models are re-developed periodically to adjust for temporal trends.49 Also important is validation of a model on geographically or temporally distant populations.50 Constructing a model using a large numbers of patient encounters across a wide variety of geographic areas increases the probability that the model will be suited for different populations, but the only way to determine the model's applicability is to verify the performance empirically in representative sample.
In the field of cardiology, one of the most widely studied areas of risk stratification has been coronary angiography. This article seeks to build on prior work on the applicability of risk models in different geographies and over time. Several prior studies of PCI risk models have
shown good external validation with respect to both calibration and discrimination.36-40 Others
41 4
have shown a loss in either discrimination, calibration,4 or both.4 2 In the present study we consider the hypothesis that models exhibit differences in discrimination and calibration over space and time.
Methods
Data Collection
Brigham & Women's Hospital (BWH), Boston Massachusetts has maintained a detailed database of all cases of PCI since 1997. The dataset is based on the American College of Cardiology National Data Repository dataset,23 with a variety of additional, detailed, data elements. The registry is part of the quality assessment and quality improvement program of Brigham & Women's Hospital, and was approved by the hospital Institutional Review Board. All catheterization laboratory procedures performed are included in the database, and real-time data acquisition is accomplished through a dedicated team of trained nurses, physicians and technologists. A total of 5,216 PCI procedures were recorded between January 01, 2002 and September 30, 2004 on all patients who underwent PCI at BWH. This data set serves as the source for the evaluation of each model in this study.
Model Evaluation
Evaluation of all models was done with 2 and maximum log likelihood methods.
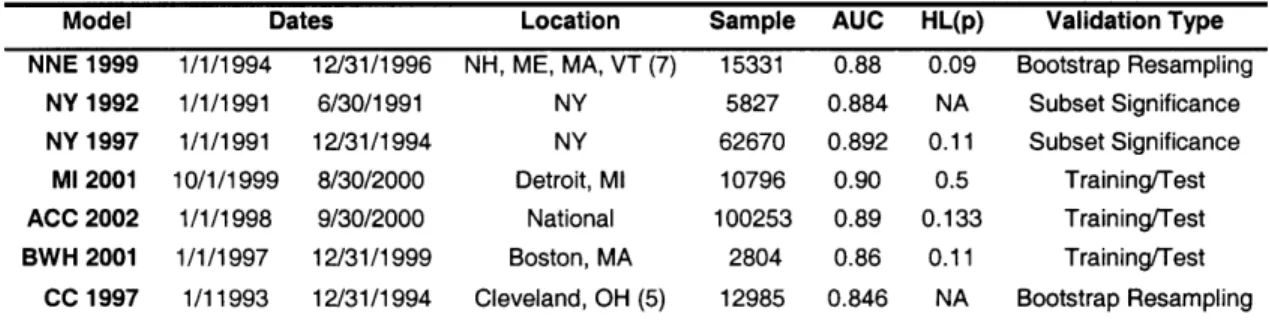
Discrimination was assessed with the area under the receiver operating characteristic curve (AUC).51' 52 A summary of each of the models used is shown in Table 1. Calibration was evaluated with Hosmer-Lemeshow goodness-of-fit x2- estimates using deciles.53 95%
confidence intervals for these parameters were computed with the non-parametric bootstrapping method of STATA (Version 8.2, College Station, TX).54 These CIs were reported using the percentile method, or bias corrected method if the estimation bias was greater than 25% of the standard error.5 5
Model Dates Location Sample AUC HL(p) Validation Type NNE 1999 1/1/1994 12/31/1996 NH, ME, MA, VT (7) 15331 0.88 0.09 Bootstrap Resampling
NY 1992 1/1/1991 6/30/1991 NY 5827 0.884 NA Subset Significance NY 1997 1/1/1991 12/31/1994 NY 62670 0.892 0.11 Subset Significance
Ml 2001 10/1/1999 8/30/2000 Detroit, Ml 10796 0.90 0.5 Training/Test ACC 2002 1/1/1998 9/30/2000 National 100253 0.89 0.133 Training/Test BWH 2001 1/1/1997 12/31/1999 Boston, MA 2804 0.86 0.11 Training/Test
CC 1997 1/11993 12/31/1994 Cleveland, OH (5) 12985 0.846 NA Bootstrap Resampling Table 1: Summary of the training data sets for the models used in this study. Sample = sample size. AUC = area under the receiver operating characteristic. HL(p) = Hosmer-Lemeshow p value.
External Validation of Risk Models
Six external and one local previously described multivariate post-PCI in-hospital mortality risk models were evaluated using the BWH data set: the Northern New England Cooperative Group (NNE 1999),3 ° the New York State (NY 1992 & NY 1997),31 32 University of Michigan Consortium (MI 2001),3 3 the American College of Cardiology-National
Cardiovascular Data Registry (ACC 2002),34the Cleveland Clinic Foundation Multi-Center (CC 1997),35 and the Brigham & Women's Hospital (BWH 2001)56models. Pair-wise comparison of
the area under the ROC curve for each model was performed by Analyse-It (Version 1.71, Leeds, England, UK).
Local Model Development
To test the hypothesis that time and space degrade the accuracy of a risk model, a new local model was developed using the same BWH data that was used to evaluate the
discrimination and calibration of existing models. Standard univariate methods were used to generate odds ratios (ORs) with 95% confidence intervals (CIs) and p values to select variables that would be included in the new model.5 7 Additionally, all available covariates which have been shown to be univariate risk factors in previous studies were included in the analysis (Table 2). Backward stepwise logistic regression was performed using STATA.19 Variables were first removed using a residual Wald chi-square p value of 0.1, and then considered for inclusion based on a p value of 0.05. Since there was no independent test set, the evaluation was based on
Factor % Pts % Deaths OR 95% CI p Age <50 50-59 60-69 70-79 >79 Gender Male Female Diabetes PVD COPD Shock Unstable Angina Urgency Elective Urgent Emergent Salvage LVEF >39 20-39 <20 Tachycardia Pre-PCI IABP AMI 24 Hr Cr > 2.0 mg/dL CHF Prior PCI Prior CABG Lesion Risk Low High Intervention LAD Disease Location Proximal LAD RCA Diseased Vessels 0 1 2 3 11.0 21.6 27.8 27.6 11.9 70.7 29.3 31.7 9.5 10.6 1.7 4.9 49.9 37.9 11.8 0.4 91.3 7.6 1.1 2.4 0.7 10.6 5.3 10.1 33.8 1101 66.3 33.7 42.4 47.2 52.3 9.0 52.6 25.5 12.8 0.2 1.00 0.4 2.55 0.9 5.20 1.5 8.91 4.8 29.3 1.4 1.4 1.8 2.4 2.0 37.4 11.6 0.3 0.9 5.7 45.4 1.1 3.6 5.5 13.5 19.4 5.2 5.0 4.0 0.5 1.1 0.5 3.0 1.9 2.2 1.7 0.4 0.9 1.9 3.0 1.00 1.02 1.58 1.97 1.55 82.0 15.8 1.00 2.98 19.6 270.3 1.00 3.22 5.04 14.5 19.3 6.1 4.5 3.9 0.28 0.76 1.00 5.5 1.87 3.34 1.69 1.00 2.07 4.5 7.3
Table 2: Univariate Association of Factors with In-Hospital Mortality and Registry Demographics. % Pts = percent of sample population. % Deaths = percent of deaths within the sub-population. OR = Odds Ratio. 95% CI = 95% Confidence Interval. p = p Value. PVD = Peripheral Vascular Disease. COPD = Chronic Obstructive Pulmonary Disease. LVEF = Left Ventricular Ejection Fraction. PCI = Percutaneous Coronary Intervention. IABP = Intra-Aortic Balloon Pump. AMI = Acute Myocardial Infarction. Cr = Creatinine. CHF = Congestive Heart Failure. CABG = Coronary Artery Bypass Grafting. LAD = Left Anterior Descending. RCA = Right Coronary Artery.
Ref 0.30 - 39.9 0.68 - 39.9 1.199 - 66.3 3.98 - 215.5 Ref. 0.61 - 1.70 0.99 - 2.5 1.05 - 3.69 0.81 - 2.97 48.1 - 139.8 9.7 - 25.7 Ref 1.3 - 6.9 9.1 -42.6 91 - 803.2 Ref 1.77 - 5.84 1.53- 16.6 8-17 - 25.9 8.15 -45.7 3.8 - 9.8 2.5 - 8.3 2.3 - 6.5 0.14 - 0.57 0.41 - 1.42 Ref 3.24 - 9.4 1.17 - 3.01 1.95 - 5.72 1.03 - 2.76 Ref. 0.49 - 8.8 1.06- 19.1 1.7 - 31.2 0.392 0.112 0.033 0.001 0.952 0.058 0.034 0.183 <0.001 <0.001 0.010 <0.001 <0.001 <0.001 0.008 <0.001 <0.001 <0.001 <0.001 <0.001 <0.001 0.385 <0.001 0.010 <0.001 0.036 0.323 0.041 0.008
Results
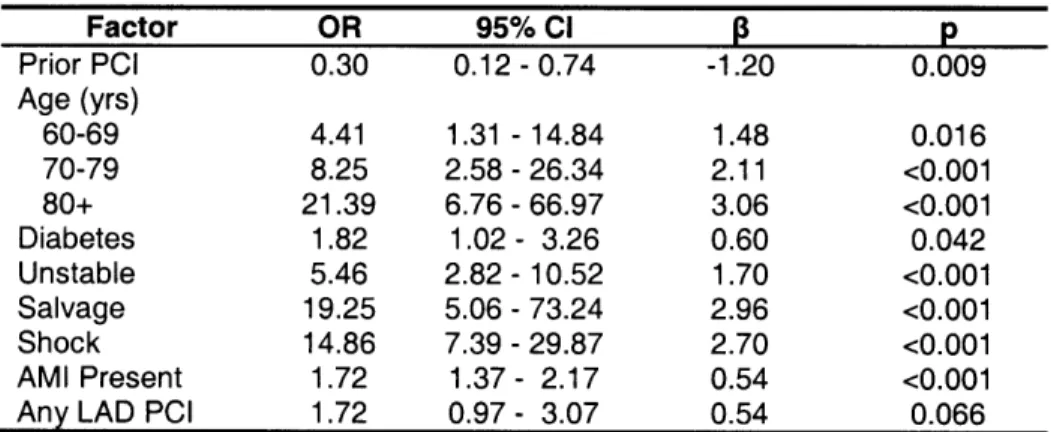
Local Multivariate Prediction Rule Development
After full backward stepwise variable selection, the variables associated with an increased risk included older age, diabetes, unstable angina, salvage procedure, cardiogenic shock, AMI, and any intervention on the left anterior descending artery as shown in Table 3. The AUC was 0.929 revealing excellent discriminatory ability of the new model, and bootstrap re-sampling the data to obtain a 95% CI of 0.90-0.96 with an SE of 0.017, indicating a good ability to discriminate with respect to the outcome of death. The model had an adequate
2
goodness of fit (HL X=7.61 with 8 d.f., p=0.473).
Factor OR 95% CI p Prior PCI 0.30 0.12 -0.74 -1.20 0.009 Age (yrs) 60-69 4.41 1.31 - 14.84 1.48 0.016 70-79 8.25 2.58 - 26.34 2.11 <0.001 80+ 21.39 6.76 - 66.97 3.06 <0.001 Diabetes 1.82 1.02- 3.26 0.60 0.042 Unstable 5.46 2.82 - 10.52 1.70 <0.001 Salvage 19.25 5.06 - 73.24 2.96 <0.001 Shock 14.86 7.39 - 29.87 2.70 <0.001 AMI Present 1.72 1.37 - 2.17 0.54 <0.001
Any LAD PCI 1.72 0.97 - 3.07 0.54 0.066
Table 3: Multivariate Analysis of Factors Significantly Associated with In-Hospital Mortality in the New BWH model. OR = Odds Ratio. 95% CI = 95% Confidence Interval. 13 = Beta Coefficient. p = p Value. Constant (intercept) = -7.777; Hosmer and Lemeshow goodness-of-fit X2= 7.61; p = 0.473; AUC = 0.929. AMI = acute myocardial infarction. LAD = left anterior descending. PCI = percutaneous coronary intervention.
External Validation
The external model performances on the BWH dataset are shown in Table 4. During the study period there were 71 observed deaths (1.36%). BWH 2004 very closely approximated this with 70.5 deaths, NY 1992, CC 1997, and BWH 2001 over predicted, and the remainder under predicted. The AUC indicates excellent discrimination across all models, with the worst being the New York State 1992 model and the best being the new local model. A summary view of the AUC for all models is shown in Figure 1. Of the external models, the best AUC was obtained by the ACC 2002 model.
Curve Deaths AUC 95% CI HL X2 95% CI HL (p) 95% CI NY 1992 96.7 0.82 0.76 -0.88 31.1 13.9 -50.0 <0.001 <0.001 - 0.003 NY 1997 61.6 0.88 0.81 - 0.92 32.2 16.4 -45.5 <0.001 <0.001 - 0.004 CC 1997 78.8 0.88 0.82 - 0.93 27.8 19.6 - 38.7 <0.001 <0.001 - 0.013 NNE 1999 56.2 0.89 0.84 - 0.94 45.9 31.9 - 67.4 <0.001 <0.001 - <0.001 MI 2001 61.8 0.86 0.81 -0.90 30.4 16.7 -43.1 <0.001 <0.001 -0.011 BWH 2001 136.1 0.89 0.84 - 0.93 39.7 23.2 - 73.3 <0.001 <0.001 - 0.001 ACC 2002 49.9 0.90 0.84 - 0.95 42.0 24.9 -63.3 <0.001 <0.001 - 0.002 BWH 2004 70.5 0.93 0.89 - 0.96 7.61 1.5 - 14.2 0.473 0.073 - 0.992
Table 4: Summary of discrimination and calibration performance for each model. Deaths = Estimated Deaths. AUC = Area Under the Receiver Operating Characteristic Curve. 95% CI = 95% Confidence Interval. HL x2 = Hosmer-Lemeshow X2. HL(p) = Hosmer-Lemeshow probability > x2Value.
1 0.9 0.8 Q 0 0 0. ._ Cs .= ._ 0.7 0.6 0.5 0.4 0.3 0.2 0.1 0 0 0.2 0.4 0.6 0.8 1
1 - Specificity (false positives)
Figure 1: AUC for all models. The grey line shows no discrimination.
Pair-wise AUC comparisons were performed as well, shown in Table 5, by using the method described by Hanley and McNeil.5 9 Overall, the best discrimination was obtained by the new local model, which attained significance with respect to every model but ACC 2002. The second best performance was by the external model constructed with the largest training set (ACC 2002), followed by the old local model (BWH 2001). Significant differences were noted between NY 1992 and every model but MI 2001, as well as between MI 2001 and ACC 2002. This indicates that the NY 1992 model, and to a lesser extent the MI 2001 model, is the least discriminatory. No discrimination BWH 2004 ACC 2002 NNE 1999 BWH 2001 -NY 1992 .... NY 1997 - M 2001 CC 1997
NY 1992 NY 1997 CC 1997 NNE 1999 MI 2001 BWH 2001 ACC 2002
Diff p Diff p Diff p Diff p Diff p Diff p Diff p
NY 1992 NY 1997 0.056 0.007 CC 1997 0.051 0.101 0.004 0.859 NNE 1999 0.062 0.013 -0.007 0.712 0.011 0.644 MI 2001 0.041 0.165 -0.015 0.485 -0.01 0.627 -0.022 0.310 BWH 2001 0.066 0.019 0.011 0.602 0.015 0.551 0.004 0.849 0.026 0.287 ACC 2002 0.080 0.002 0.025 0.145 0.03 0.176 0.018 0.254 0.040 0.045 0.014 0.519 BWH 2004 0.105 0.001 0.049 0.007 0.053 0.011 0.043 0.048 0.064 0.003 0.038 0.050 0.024 0.176
Table 5: Pair-wise Discrimination Model Comparison. Diff = AUC difference. p = p value of difference.
The Hosmer-Lemeshow goodness-of-fit test reveals poor calibration (p < 0.05) for all the models but the newly developed one. Calibration for all models was further explored by plotting the observed to expected frequency of death for each quintile of every model. Figure 2-B is
provided to more clearly show the relationships for the low risk population. As shown in Figure 2. the NY 1992 model underestimated the risk of death for low scoring patients, and over estimated this risk for high scoring patients. NY 1997 performed fairly well for low risk
patients, but overestimated the probability of death for high risk patients. ACC 2002 performed well under low risk conditions, but significantly underestimated the probability of death for high risk conditions. NNE 1999 consistently under predicted deaths, and CC 1997 as well as BWH 2001 consistently overestimated mortality risk. As expected, BWH 2004 performs well, but since this is not an independent test sample, this result should be interpreted with caution.
0.07
Figure 2-A: The observed and expected mortality rates for each quintile of patient risk. Each risk quintile contains approximately 1050 patients. The diagonal line represents a perfect agreement between observed and expected mortality estimates.
Figure 2-B: Expanded View from 0 to 0.15 of the Observed to Expected Probability Ratios.
0.06 0.05 £5 0 . 004 o 0.022 CL la 0.03 0 0.02 0.01 0 * NY1992 * NY 1997 * CC 1997 NNE 1999 M1 2001 * BWH 2001 + ACC 2002 a BWH 2004 -Perfect Fit 0 0.02 0.04 0.06 Predicted Probability U.Ulb 0.01 . 0.01 I-t. 2 'O 0 0.005 0 0o * NY1992 * NY1997 · CC 1997 NNE 1999 , M1 2001 * BWH 2001 + ACC 2002 BWH 2004 - Perfect Fit 0 0.005 0.01 0.015 Predicted Probability l A A.J
Discussion
Interventional cardiology practice has changed significantly over the last decade.
Procedural skill development, pharmacology, and device development have all contributed to the evolution of the field, and patient outcomes have changed over that time period in response to these advances. There as been a substantial reduction in risk of death and major adverse cardiac events (MACE)60 over the past decade. All of these factors create a moving target for any risk stratification model.
All the external models evaluated on the BWH data set showed good discrimination. The model with the worst discrimination was NY 1992, which was to be expected due to the age of the study, and small sample size with which the model was developed. The best external model was the one developed on a national database with the most patient records, suggesting that geographic issues may be related to discrimination. Although these results are promising, it is important to note that discrimination is not the only (and possibly not the most important) factor in determining the applicability of a prognostic model from the perspective of physicians and patients. A model can exhibit perfect discrimination but still be useless for application on individual cases. Good calibration is essential for this type of application. All models, except possibly the one developed locally with recent data, but including a model derived locally, showed poor calibration for our test set, suggesting that time may play an important role in the applicability of a model.
Similar findings have been previously reported. Some techniques have been suggested to recalibrate the model.61 One of these techniques was employed by Kizer, et al41 and Peterson, et
,162
al62 with some success, and may offer a strategy to maintain discrimination and improve calibration.
This study supports routine evaluation of any risk model, including aging local models, prior to local implementation. Discrimination was maintained for most risk adjustment models, though those more recently published and those based on the largest original datasets appeared to have the most robust discrimination when applied to a current clinical dataset. The preservation of discrimination supports the use of these models for generic risk stratification, but the poor
calibration indicates that they are not useful for application in individual cases: the estimated risk of death for a single patient that is produced by these models is incorrect.
The poor calibration of the prior models suggests that variations in practice and patient demographics as well as clinical features over time have a large effect at the patient level on the risk estimate's accuracy. Further study is required to identify the optimum frequency of model recalibration.
Chapter 2: Performance Evaluation of Support Vector Machine Risk Models
Background
In the last few decades, significant emphasis has been placed on the development of statistical models to help predict risk in various patient populations. These models have been
'25 S26
widely used to improve the quality of care,2 provide institutional quality scorecards26, provide risk stratification 27 and assist patient selection28in research, evaluate futility of care,2 9 and to
provide individual patient prognostications.
Percutaneous coronary intervention (PCI) is one of the most common procedures in cardiology, and is associated with significant morbidity and mortality. Opportunities for providing objective risk assessment in this domain have been improving since the development
23
of a national standardized data dictionary,23 and an increase in mandatory electronic data collection and reporting by some state agencies.
The gold standard modeling technique in this domain is logistic regression (LR). There are a number of well-known LR mortality risk models that have been developed over the last 15 years.30-3 5 Discrimination of these models is generally high, and has been retained in external
validation studies. However, calibration degraded when these models were applied to subsequent local or external data.74 There are a number of possible explanations for this, including changing medical practice, differing patient demographics, and different access to
44
resources.
Calibration failure primarily affects individual patient prognostication, and negatively impacts risk stratification and any application that relies on individual estimates. Recalibration techniques are being explored to provide adequate calibration over time, but no method has emerged as a standard.
Application of a modeling technique that outperforms LR in terms of calibration can extend the useful life of a risk model before recalibration or model refitting is required. One of the most recent developments in artificial intelligence modeling has been Support Vector Machines (SVM). These models are able to find an optimal separation hyperplane in a multi-dimensional space to perform classification of a dichotomous outcome. To our knowledge, this methodology has not been explored in interventional cardiology, and has potential applications in a number of applications, such as real-time safety monitoring of new medical devices.7 5
In this study, we seek to evaluate and compare the discrimination and calibration
performance between a variety of LR and SVM risk models in the evaluation of post-procedural in-hospital mortal mortality in PCI.
Methods
Source Data
Data were collected from Brigham and Women's Hospital (BWH) (Boston, MA) containing all cases (7914) of percutaneous coronary interutaneous coronary intervention (PCI) performed at the institution from January 1, 2002 to December 31, 2005. The outcome of interest was post-procedural in-hospital death, and there were 124 (1.57%) events during the collection period. The cases were used to generate 100 random data sets. All cases were used in each set, and 5540 were allocated for training and 2374 were allocated for testing. For SVM evaluation, each training set was randomly divided into 3957 kernel training and 1583 sigmoid training portions. Data element definitions were based on the American College of Cardiology - National
Cardiovascular Data Registry (ACC-NCDR) data dictionary.2 3 The BWH Institutional Review Board approved this study.
Acute Heart Attack Hx COPD
Age Hx PVD
Body Mass Index Hx Stroke
CHF Class Hyperlipidemia
CHF on Presentation Hypertension
Creatinine > 2.0 mg/dL IABP
Diabetes Prior PCI
Elective Case Shock
Emergent Case Unstable Angina
Family Hx Heart Disease Urgent Case
Heart Rate
Table 1: Hx = history, COPD = Chronic Obstructive Pulmonary Disease, PVD = Peripheral Vascular Disease, CHF = Congestive Heart Failure, PCI = Percutaneous Coronary Intervention, IABP = Intra-Aortic Balloon Pump.
Variable Selection
After careful literature review, all previously identified risk factors for PCI were selected for inclusion in this study.3 0 3 5' 56 Univariate analysis was then performed with SAS 9.1 (Cary, NC). Variables not significantly associated with the outcome of death were removed from the data (sex, smoking status, prior myocardial infarction, prior CABG, and a history of chronic
renal insufficiency). A total of 21 variables were retained for use in model creation and analysis. These variables are listed in Table 1.
Logistic Regression
Model development for LR was performed using the PROC LOGISTIC of SAS. A standard backwards stepwise model selection method was used.80 In addition, 3-fold cross-validation (CV) was performed on each training set to determine the optimum threshold for feature selection in the backwards stepwise method. The modeling parameters were optimized separately for mean squared error (MSE), Area under the Receiver Operating Characteristic (AUC) curve, and Hosmer-Lemeshow (HL) %2goodness-of-fit values. The thresholds evaluated were 0.05 to 0.50, in 0.05 increments. The optimized threshold parameters were then used to generate a model for each entire training data set, and then applied to the respective test data.
Support Vector Machine
The Support Vector Machine (SVM) models were developed using GIST 2.2.1 (Columbia University, New York, NY). Radial (SVM-R) and polynomial (SVM-P) based kernels were selected for evaluation because of their good performance in other domains. Polynomial kernels transform the feature matrix using the following equation, where X and Y are features (predictors) and the class variable, respectively:
K(X, Y) = (X o + 1)
The primary kernel parameter is the power, represented as d in the above equation. Gaussian radial-based kernels81transform the feature matrix using the following equation:
-IIx-yll2
K(X,Y) = e 2w2
The primary kernel parameter is the width function, represented as w in the above equation. The other parameter that can be used in both kernels is the cost function, which determines the ratio of error weight between false positives and false negatives. This parameter was fixed constant at a value of 1. Classification SVMs give outputs as a binary classifier (-1, 1) and also as a
the generation of a probabilistic outcome by fitting a sigmoid function to the discriminant using independent holdout training data. In this study, we used the corrected Platt algorithm provided by Lin and colleagues.8 3
The parameters of each kernel type were optimized on the kernel training set separately for MSE, AUC and HL x2 values by a grid search method on the training set, using 3-fold cross-validation.84 The sigmoid training set was used to convert discriminant results into probabilities.
The width function for the radial-based kernel ranged from 2-4 to 24 (2 -4, 2 3 2-2, etc.), and
power for the polynomial-based kernel ranged from 1 to 6 by integers. For each respective kernel type and optimization parameter, the best kernel parameter was used to generate a model on the entire kernel training set, and a sigmoid for discriminant conversion was generated using the sigmoid training set. Each of the models was then applied to the respective test data set.
Statistical Evaluation
Discrimination was assessed with the area under the receiver operating characteristic. 5 1
Calibration was evaluated by the Hosmer-Lemeshow goodness-of-fit X2goodness-of-fit
782
estimates.7 8 X2 values with 8 degrees of freedom are considered adequately calibrated for values of 15.51 or less (corresponding to ap value >= 0.05). Pair-wise comparison between
performance measures was performed using a one-way ANOVA test for summary values with known standard errors.
Results
A summary of test data evaluation for each model type and cross validation optimization parameter is shown in Table 2. Each respective model parameter (p-value threshold for a variable to stay in the model, kernel width factor, and kernel power for LR, R, and SVM-P, respectively) and performance measure includes the mean values and 95% confidence
intervals for the respective model type.
Results of the pair-wise comparison between each optimization type of each modeling method are shown in Table 3. The upper right half of the table contains AUC comparisons, and the lower left half of the table contains HL 2comparisons. p values less than 0.05 indicate a
None of the LR models resulted in AUCs that were significantly different from any other ILR model (all p > 0.05). All of the LR models had higher AUCs than the radial-based SVMs (all p < 0.05). The LR models had significantly higher AUCs when compared to the HL x2
optimization method of SVM-P (p = 0.012, 0.012, 0.025, and 0.027), but not higher than the AUCs from MSE or AUC methods.
None of the LR models had HL %2values significantly different from any other LR model (all p> 0.05). All of the radial-based and polynomial-based SVM models showed significantly lower HL %2values than any of the LR models (all p < 0.05). The HL X2
optimization method was superior to both the MSE and AUC methods in the radial-based SVM models (p < 0.001). The HL %2optimization method in both kernel types was significantly better than all of the other model versions based on MSE and AUC, except the MSE and AUC
optimization methods of SVM-P (p < 0.05).
Model Opt Parameter Mean AUC (95% CI) HL %2 (95 % CI)
LR None 0.10 0.911 (0.905 - 0.916) 101.1 (49.4 - 152.8) LR MSE 0.25 (0.22 - 0.28) 0.912 (0.906 - 0.917) 89.8 (53.0 - 126.7) LR AUC 0.29 (0.26 - 0.33) 0.912 (0.906 - 0.917) 94.7 (46.0 - 143.4) LR HL x2 0.17 (0.14 - 0.20) 0.911 (0.905 - 0.916) 99.1 (46.8 - 151.4) SVM-R MSE 0.13 (0.08 - 0.17) 0.873 (0.874 - 0.883) 30.3 (27.9 - 32.6) SVM-R AUC 0.28 (0.19 - 0.36) 0.894 (0.888 - 0.900) 28.5 (26.0 - 30.9) SVM-R HL Z2 4.53 (3.47 - 5.59) 0.901 (0.895 - 0.908) 16.4 (13.4 - 19.4) SVM-P MSE 3.09 (2.97 - 3.21) 0.912 (0.905 - 0.919) 34.1 (12.4 - 55.8) SVM-P AUC 2.65 (2.50- 2.80) 0.915 (0.909 - 0.922) 33.5 (11.8- 55.1) SVM-P HL 2 2.98 (2.64 - 3.31) 0.899 (0.891 - 0.907) 20.0 (15.2 - 24.8) Table 2: Analysis of the test data by model method and cross validation optimization method. LR = backwards step-wise Logistic Regression model, SVM-R = radial-based kernel SVM, SVM-P = polynomial-based kernel SVM. Opt = Cross Validation optimization method. AUC = Area under the Receiver Operating Characteristic Curve. HL
2
X = Hosmer-Lemeshow Goodness-of-Fit. MSE = mean squared error. For the model parameters, the values refer to the exclusion threshold (p-value) for LR, w for SVM-R, and p for SVM-P.
LR LR LR LR SVM-R SVM-R SVM-R SVM-P SVM-P SVM-P
(MSE) (AUC) (HL) (0.10) (MSE) (AUC) (HL) (MSE) (AUC) (HL)
0.980 0.724 0.667 <0.001 <0.001 0.014 0.997 0.393 0.012 LR (MSE)
i-
+-
-
-0.857 0.741 0.311 <0.001 <0.001 0.014 0.986 0.379 0.012 LR (AUC) .. . .-0.773 0.901 0.175 <0.001 <0.001 0.032 0.756 0.239 0.025 LR (HL) -- - - - -0.725 0.858 0.958 <0.001 <0.001 0.035 0.715 0.214 0.027 LR (0.10) + +4 -0.002 0.009 0.010 0.007 <0.001 <0.001 <0.001 <0.001 <0.001 SVM-R (MSE) *- - 4' - T T T T T 0.001 0.008 0.008 0.006 0.301 0.004 <0.001 <0.001 0.354 SVM-R(AUC) . + t t t <0.001 0.002 0.002 0.001 <0.001 <0.001 0.025 0.002 0.677 SVM-R(HL) .. . . X . +4 T T 0.011 0.025 0.024 0.019 0.729 0.612 0.111 0.4378 0.019 SVM-P (MSE) . + + .-0.010 0.024 0.022 0.018 0.772 0.652 0.124 0.968 0.002 SVM-P (AUC) +. +4 +4 + <0.001 0.003 0.003 0.002 <0.001 0.002 0.204 0.212 0.232 SVM-P(HL)
--
_ ----
+-Table 3: Summary of p values for the pair-wise comparison between different versions of the modeling methods. The top right half of the table contains p values for AUC measurements, and the bottom left half of the table contains p values for the HL X2measurements. LR = backwards step-wise Logistic Regression model, SVM-R = radial-based kernel SVM, SVM-P polynomial-based kernel SVM. AUC = Area under the Receiver Operating Characteristic Curve. HL = Hosmer-Lemeshow Goodness-of-Fit. MSE = mean squared error. Bold values are statistically significant. T = Column-based model statistically superior. - = Row-based model statistically
superior.
Discussion
All of the models had excellent discriminatory (AUC) performance. This suggests that the clinical data collected in this domain is able to account for the majority of risk for in-hospital
post-PCI mortality.
The LR models had superior discrimination to the SVM-R models, and also to the HL 2 optimization method of the SVM-P models. This shows that the clinical data are probably linearly separable, and is consistent with prior studies of logistic regression in this domain. In addition, the polynomial kernel was superior to the radial kernel in its ability to discriminate using the MSE and AUC methods.
The MSE method is a common optimization score in regression model development, and the AUC and HL
X
2values were experimental optimization parameters. To our knowledge, there have been no reports on their use for optimizing variable selection. Discrimination in the LR models was insensitive to the optimization method. The SVM-R models showed a performance improvement with AUC over MSE, and with HL X2over both AUC and MSE. The SVM-Pshowed a performance improvement with both the MSE and AUC methods over the HL X2 method.
Calibration was significantly higher in both of the SVM model types compared to the LR models. Different optimization methods did not significantly impact the LR models. However, the HL X2optimization method provided significant improvement for the SVM-R models. None of the models achieved an upper 95% CI lower than 15.51, revealing that at least a portion of each model type failed to adequately calibrate. However, this is a common finding in other studies that evaluated risk models on a large volume of data sets. This happens because small numbers of models with large HL 2values skew the distribution.
When a model is generated, a balance must be maintained between overfitting and underfitting. Overfitting improves the fit of the model on the training data but reduces its performance on external data. Underfitting generalizes the fit of the model by reducing the
complexity of the fit on the training data in order to improve classification or regression results to other data sets. In these data, the AUC and MSE optimization methods significantly overfit the SVM-R models, as shown by the large difference between the mean width factors of HL X2 and the other two optimization strategies. In GIST, a decrease in the width factor is associated with an increase in the fit to the training data. However, the model parameters were not substantially different between optimization types for LR or SVM-P.
The primary limitations of this study are the lack of manual manipulation in the modeling process, although this was required by the methodology. In the single model development process, optimization in terms of model parameters, introduction of interaction terms, and feature selection would be manually performed by further optimizing a cross-validation score (MSE, AUC, etc.) if the discrimination was not deemed good or the calibration was inadequate in the training sample.
The parameter selection process used a 3-fold CV method, and the model evaluation used a separate testing sample over 100 randomized data sets. This is related to the nested stratified
10-fold CV method as described by Statnikov and colleagues.85 The small number of training folds (or inner loop) were utilized because of high computational times of GIST in the relatively large data sets. This may have increased the variance of the scores in the parameter optimization methods, although the large number of data points in each fold likely minimized this problem.
Overall, both the polynomial and radial-based SVMs achieved better calibration than the LR models. Experimentation with different scoring methods used to select parameters for model generation revealed that the regular method of MSE scoring performed as well as the others for LR. However, the HL X2 method achieved the best results for both discrimination and
calibration for the radial-based kernels, but improved calibration performance at the expense of discrimination for the polynomial-based kernels. This tradeoff requires further exploration.
Use of support vector machine risk models to promote adequate calibration and produce more accurate individualized prognostic estimates for patients is supported by this preliminary study. Future work will include investigating other calibration indices, recalibration methods, and further evaluation of this method for inclusion in an automated real-time safety monitoring system.
Chapter 3: Design and implementation of an Automated Real-Time Safety Monitoring Application
Background
Minimizing harm to patients and ensuring their safety are cornerstones of any clinical research effort. Safety monitoring is important in every stage of research related to a new drug, new medical device, or new therapeutic procedure. This type of monitoring of medical devices, under the auspices of the Food and Drug Administration (FDA), has undergone major changes over the last several decades. -4 These changes have largely been due to a small number of highly publicized adverse events.5- 13 The FDA's task is complex; the agency regulates more
than 1,700 types of devices, 500,000 medical device models and 23,000 manufacturers.3' 6 17, 19, 20, 22, 63 In pre-marketing clinical trials, rare adverse events may not be discovered due to small
sample sizes and biases towards healthier subjects.14 The FDA must balance this concern with the need to deliver important medical advances to the public in a timely fashion. In response to this, the FDA has shifted some of its device evaluation to the post-market period, allowing new devices to reach the market sooner.'5 This creates the potential for large numbers of patients to
be exposed to a new product in the absence of long-term follow-up data, and emphasizes the need for careful and thorough post-marketing surveillance.'6
The current FDA policies in this area include a heterogeneous mix of voluntary and mandatory reporting.1 6, 14, 17-22 Voluntary reporting of adverse events creates limitations in
significant event-rate recognition through underreporting bias, and highly variable reporting quality. 14 Several state and federal agencies have implemented mandatory reporting for medical devices for specific clinical areas, and national medical societies are making strides to
standardize data element definitions and data collection methods within their respective
2366
domains.2 64 6 Continued improvements in the quality and volume of reported data have created opportunities for timely and efficient analysis and reporting of alarming trends in patient outcomes.
Non-medical industries (Toronado, HGL Dynamics, Inc., Surrey, GU, WinTA, Tensor PLC, Great Yarmouth, NR) have been using a variety of automated statistical process control (SPC) techniques for quality control purposes for many years.66-68 These systems rely on
24
automated data collection, and use standard SPC methods of varying rigor. 24 However,
automated SPC monitoring has not been widely deployed in the medical domain due to a number of constraints: (a) historically, automated data collection could usually only be obtained for objective data such as laboratory results and vital signs; (b) much of the needed information about a patient's condition is subjective and may be available only in free text in the medical record; and (c) medical source data, due to heterogeneity of clinical factors, typically has more noise than industrial data, and standard industrial SPC metrics may not be directly applicable to medical safety monitoring.
Within the medical domain, the most closely related clinical systems that have been developed to date are those in clinical trial monitoring for new pharmaceuticals. A variety of software solutions (Clinitrace, Phase Forward, Waltham, MA; Oracle Adverse Event Reporting System [AERS], Oracle, Red Shores, CA; Trialex, Meta-Xceed, Inc., Freemont, CA; Netregulus, Netregulus, Inc., Centennial, CO) have been created to monitor patient data relevant to the study trial. These systems rely on standard SPC methodologies, and can provide real-time data
monitoring and analysis through internal data standardization and collection for the trial. However, the focus of these systems is on real-time data aggregation and reporting to the FDA.
The increasing availability of detailed electronic medical records and structured clinical outcomes data repositories may provide new opportunities to perform real-time surveillance and monitoring of adverse outcomes for new devices and therapeutics beyond the clinical trial environment. However, the specific monitoring methodologies that balance appropriate adverse event detection sensitivity and specificity remain unclear.
In response to this opportunity, we have developed the Data Extraction and Longitudinal Time Analysis (DELTA) system, and explored both standard and experimental statistical
techniques for real-time safety monitoring. A clinical example was chosen to highlight the functionality of DELTA, and to provide an overview of its potential uses. Interventional
23
cardiology was chosen because the domain has a national data field standard,2 3 a recent increase in mandatory case reporting from state and federal agencies, and recent device safety concerns publicized by the FDA.
Methods
System General Requirements
The DELTA system was designed to provide real-time monitoring of clinical data during the course of evaluating a new medical device, medication, or intervention. The system was designed to satisfy five principal requirements. First, the system should accept a generic dataset, represented as a flat data table, to enable compatibility with the broadest possible range of sources. Second, the system should perform both prospective and retrospective analysis. Third, the system should support a variety of classical and experimental statistical methods to monitor trends in the data, configured as analytic modules within the system, allowing both unadjusted and risk-adjusted safety monitoring. In addition, the system should support different
methodologies for alerting the user. Finally, DELTA should support an arbitrary number of simultaneous datasets, and an arbitrary number of ongoing analyses within each dataset. That is, DELTA should "track" multiple outcomes from multiple data sources simultaneously, thus making it possible for DELTA to serve as a single portal for safety monitoring for multiple simultaneous analyses in an institution.
Source Data and Internal Data Structure
A flat file representation of the covariates and clinical outcomes serves as the basis for all analyses. In addition, a static data dictionary must be provided to DELTA to allow for parsing and display of the source data in the user interface. Necessary information includes whether each field is going to be treated as a covariate, an outcome, and whether it is discrete or continuous.
The system uses a SQL 2000 server (Microsoft Corp., Redmond, WA) for internal data storage, importing all clinical data and data dictionaries from source databases at regular time intervals. This database also stores system configurations, analysis configurations, and results that are generated by DELTA at the conclusion of a given time period. The user interface is web-based, and uses a standard tree menu format for navigation. DELTA's infrastructure and external linkages are shown in Figure 1.
Security of patient data is currently addressed through record de-identification steps69 performed to the fullest extent possible while maintaining the necessary dataset granularity for
Clinica Data Entry Sori mr Manaqer DELTA Users
Figure 1: Overall DELTA infrastructure and an example external data source. SPC: Statistical Process Control; LR: Logistic Regression; BUS: Bayesian Updating Statistic.
the risk adjustment models. The system is hosted on the Partners Healthcare intranet, a secure multi-hospital network, accessible at member sites or remotely through VPN.
Statistical Methods
DELTA utilizes a modular approach to statistical analysis that facilitates further
expansion. DELTA currently supports three statistical methodologies: statistical process control (SPC), logistic regression (LR), and Bayesian updating statistics (BUS). Discrete risk
stratification is supported by both SPC and BUS. Periodic and cumulative analysis of data is supported by SPC and LR, and only cumulative analysis is supported by BUS.
Risk stratification is a process by which a given sample is subdivided into discrete groups based on predefined criteria. This process is used to allow providers to quickly estimate the probability of an outcome for a patient. Statistically, the goal of this process is to create a meaningful separation in the data to allow concurrent and potentially different analyses to be performed on each subset. Criteria are selected based on prior data, typically derived from a logistic regression predictive model, and the relative success of this stratification can be determined by a stepwise increase in the incidence of the outcome in each risk group. The LR
-method does not offer discrete risk stratification because it incorporates risk stratification on a case level.
Retrospective data analyses traditionally use the entire data set for all calculations. However, in real time data analysis, it is of interest to monitor both recent trends and overall trends in event rates. Evaluation of recent trends will intrinsically have reduced power, because of the reduced sample size, to detect true, significant shifts in event rates. However, such monitoring may serve as a very useful 'first warning' indicator when the cumulative event rate may not yet cross the alerting threshold. This type of alert is not considered definitive, but can be used to encourage increased monitoring of the intervention of interest and heighten awareness
of a potential problem. In DELTA, these recent data analyses are termed 'periodic', and can be configured to be performed on a monthly, quarterly, or yearly basis.
SPC is a standard quality control method in non-medical industrial domains. This method compares observed event rates to static alerting boundaries developed from previously published or observed empirical data. Each industry typically requires different levels of rigor in
alerting, and selection of confidence intervals (or number of standard errors) establishes this benchmark. In the medical industry, the 95% confidence interval (CI) is considered to be the threshold of statistical improbability to establish a 'true' difference. In DELTA, the 95% CI of proportions by the Wilson method is used to calculate the alerting boundaries for all statistical methods.70 The proportion of observed events are then compared to these static boundaries, and
alerts are generated if they exceed the upper CI boundary. DELTA's SPC module is capable of performing event rate monitoring on multiple risk strata provided that criteria for stratification
and benchmark event rates are included for each risk stratum. This method supports comparison of benchmark expected event rates with cumulative and periodic observed event rates.
While simple and intuitive, the SPC methodology does not support case-level risk adjustment. It is also dependent on accurate benchmark data, which may be limited for new procedures or when existing therapies are applied to new clinical conditions.70
Logistic regression is a non-linear modeling technique used to provide a probability of an outcome on case-level basis. Within DELTA, the LR method allows for continuous risk-adjusted estimation of an outcome at the case level. The LR model must be developed prior to the initiation of an analysis within DELTA, and is mostly commonly based on previously published and validated models.
Alerting thresholds are established by using the LR model's expected mortality probability for each case. These probabilities are then summated in both periodic and cumulative time frames to determine the 95% confidence interval (CI) of the event rate proportion by the Wilson method. Alerts are generated if the observed event rate exceeds the upper bounds of the 95% CI of a given boundary. This method provides accommodation for high risk patients by adjusting the alerting boundary based on the model's expected probability of death. This is can be very useful in when outcome event rates vary widely with patient co-morbidities. A limitation of this method is that the alerts become dependent on the
discrimination (measure of population prediction accuracy) and calibration (measure of small group or case prediction accuracy) of that model.
BUS is an experimental methodology pioneered in non-healthcare industries.72 This method incorporates Bayes' theorem7 3into a traditional SPC framework by utilizing prior observed data to evolve the estimates of risk. Alerting boundaries are calculated by two methods, both of which are considered cumulative analyses only. The first method includes previous current study data with the prior data used in the SPC method to calculate the 95% CI
of the event rate proportion by the Wilson method. This means that the alerting boundary shifts during the course of real-time monitoring due to the influence of the earlier study data.
The other alerting method is based on the evolution of the updated risk estimates represented as probability density functions (PDF). In each period, a new PDF is generated based on the cumulative study event rate and baseline event rate. Alerting thresholds are
generated by the user specifying minimum percent amount of overlap of the two distributions (by comparison of central posterior intervals).7 4 The first comparison PDF is the initial prior PDF, and the second is the previous period's PDF. BUS supports discrete risk stratification.
This method was included in DELTA because it tends to reduce the impact of early outliers in data and complements the other monitoring methods used in the system. It also may be particularly helpful in situations in which limited pre-existing data exist. However, the
method is dependent on accurate risk strata development, and on the methods used for weighting of the prior data in the analysis.
User Interface
The user interface is provided via a web browser and was developed in the Microsoft .NET environment, running Microsoft IIS 5.0 Web Server (Microsoft Corp., Redmond, WA). Each data set is represented as a separate folder on the main page, and all analyses for that set are nested under that folder (see Figure 2). At the initiation of an analysis, the user designates the analysis period and starting and stopping dates, selects the statistical module, and selects the outcome of interest. Data filters can be applied to restrict the candidate cases for analysis. Covariates used for risk stratification are selected. Lastly, periodic and cumulative alerts for the statistical method selected can be activated or suppressed based on user preferences. An analysis configuration can be duplicated and modified for convenience in configuring multiple statistical methods to concurrently monitor a data source.
The results screen of DELTA serves as the primary portal to all tables, alerts, and graphs generated from an analysis. Tabular and graphical outputs of the data and specific alerting thresholds by risk strata are available, and an export function is included to allow researchers to perform further evaluation of the data.
--
AnalysI~~~isf info Outcome IScoring Risk SU.I Expectd I Aef ~~
~ ~m~mmlm
Results -4
DeltaSystem Active Alerts Alert History - AllDataSets - BWH Data Set ACC LR Michgan BUS Michigan LR Michigan SPC Single Sim Analysis BUS Test Analysis BUS Test Analysis LR 'J ResearchDataSet - BWH SAT 2004 DES SAT SPC Run Analysis From: 7/1/2003 To: 12/31/2004 Periods: 18 Active Alerts: 7Last Run At: 51/112005 7:27:21 PM Last Run By:
Table I - Summary
i FJ'FB
I
...
e
qil
.s.
m Low 641 2824% 0 0.0o/0 Mod 1573 69.30% 14 0 89/ High 56 2.47% 13 23.21%. TOTAL 2270 100.00% 27 1.19% Sim. Period: ŽJ Ji F Ge lTables and Graphs
Table - Results bv Strata
Graph - Distribution - Period
Graph - Distribution - Curr ulative
Graph - Observed - Cumulative
Alerts - By Current Status Alerts - Summary Per Period
Utility -Last 10 Outcome True Samle,
Utility - Excel Summary Worksheet
Figure 2: DELTA Screenshot showing the results menu screen of the SPC clinical example described in Section 4.
The main menu is displayed on the left, and the analysis menu is displayed above the viewing area.
--LIIIIXIIXI
r ~r ~r ~~ .. .. .r----
III~
~~~~~Clinical Example
As an example of the application of DELTA to real-world data, an analysis of the in-hospital mortality following the implantation of a drug-eluting stent was performed. The cardiac catheterization laboratory of Brigham and Women's Hospital has maintained a detailed clinical outcomes database since 1997 for all patients undergoing percutaneous coronary intervention, based on the American College of Cardiology National Cardiovascular Data Repository (ACC-NCDR) data elements.39
For risk stratification, the University of Michigan risk prediction model33was used since it provides a concise method of comparing all three of DELTA's statistical methods using one reference for prior experience. The previous experience of event rates for all risk strata from this
work is listed in Appendix A. A logistic regression model with risk stratification scores are listed in Appendix B. The logistic regression model developed from the data was used to create
a discrete risk scoring model. Based on the mortality of patients in the study sample at various risk scores, these data were divided into three discrete risk categories, and the compositions of those categories are listed in Appendix B.
A total of 2,270 drug-eluting stent (DES) cases were performed from July 01, 2003, to December 31, 2004, at our institution, and the outcome in terms of in-hospital mortality was
analyzed. These data were retrospectively evaluated in monthly periods for each of the three statistical methodologies. There were a total of 27 observed deaths (unadjusted mortality rate of 1.19%) during the study. Local institutional IRB approval was obtained. Risk stratification of these cases by the University of Michigan model is listed in Table 1, and demonstrates increasing in-hospital mortality risk with 0%, 0.9%, and 23% mortality risk in the low, medium, and high risk strata respectively.
An alternative data set was generated by taking the clinical data above and changing the procedure date from the 8 cases with the outcome of interest in the last 5 periods. The
procedures dates were changed by random allocation into one of the first 13 periods. The duration of the monitoring was then shortened to 13 periods. This was done to illustrate alerts when cumulative event rates clearly exceeded established thresholds. The overall event rate for this data set is 1.71% (27/1583), and the risk stratified event rate was 0% (0/446), 1.3%
Risk Strata Sample Events Event Rate
Low 641 0 00.00%
Mod 1573 14 00.89%
High 56 13 23.21%
Table 1: Multiple Risk Strata SPC.
Results
Statistical Process Control
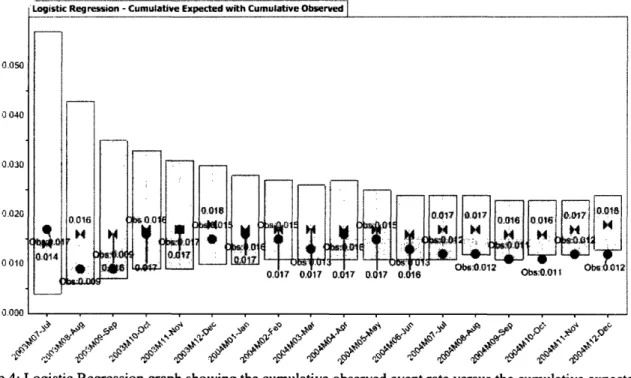
The single risk stratum SPC was configured with no risk stratification covariates. The static alert boundary was a 2.07% (upper 95% CI of 100/5863). Periodic evaluations ranged fromn 0% to 4.5%. Period 4 exceeded the boundary with a 3.4% (5/148) event rate, and period 10 with a 4.5% (5/110) event rate. Cumulative event rates ranged from 0.9% (2/213) to 1.7% (10/587). No cumulative evaluations had an event rate that exceeded the boundary. The cumulative evaluation is depicted graphically in Figure 3.
Periodic evaluations of the alternative data set ranged from 0% to 4.7%. Period 4 exceeded the boundary with a 4.7% (7/150) event rate, period 7 with a 2.6% (3/117) event rate, period 8 with a 2.6% (3/117) event rate, and period 10 with a 4.5% (5/110) event rate.
Cumulative event rates ranged from 0.9% (2/213) to 2.4%(12/490). Periods 4 through 11 had event rates exceeding the 2.07% threshold and generated alerts, and ranged from 2.1% to 2.4%.
Alerting thresholds were calculated for the low, medium, and high risk strata by using the upper 95% CI of the proportion of the event rates of each stratum in the University of Michigan data. The thresholds were 0.3% (1/1820), 1.7% (50/3907), and 44% (49/136), respectively.
There were no events in the low-risk stratum, and no alerts were generated. In the moderate-risk stratum, the periodic observed event rates ranged from 0% to 2.7%. The alerting boundary was exceeded with rates of 2.7% (2/75) in period 5, 2.6% (2/78) in period 10, and
1.9% (2/108) in period 18. The cumulative observed event rates ranged from 0.7% to 1.3%, and never exceeded the upper alert boundary. In the high-risk stratum, the periodic observed event rates ranged from 0% to 100%. The alerting boundary was exceeded with rates of 100% in periods 1 (1/1), 7 (1/1), and 10 (3/3), and by a rate of 50% (4/8) in period 4. The cumulative observed event rates ranged from 16.7% to 100%. The alerting boundary was exceeded by a rate of 100% (1/1) in period 1.