OATAO is an open access repository that collects the work of Toulouse
researchers and makes it freely available over the web where possible
Any correspondence concerning this service should be sent
to the repository administrator:
[email protected]
This is an author’s version published in:
https://oatao.univ-toulouse.fr/26638
To cite this version:
Bataillou, Léa and Martinelli, Laure and Desgranges, Clara and
Bosonnet, Sophie and Ginestar, Kevin and Miserque, Frédéric and
Wouters, Yves and Latu-Romain, Laurence and Pugliara,
Alessandro and Proietti, Arnaud and Monceau, Daniel Growth
Kinetics and Characterization of Chromia Scales Formed on Ni–
30Cr Alloy in Impure Argon at 700 °C. (2020) Oxidation of Metals,
93 (3-4). 329-353. ISSN 0030-770X
Open Archive Toulouse Archive Ouverte
Official URL :
Growth Kinetics and Characterization of Chromia Scales
Formed on Ni–30Cr Alloy in Impure Argon at 700 °C
Léa Bataillou1 · Laure Martinelli1 · Clara Desgranges1,2 · Sophie Bosonnet1 ·
Kevin Ginestar1 · Frédéric Miserque1 · Yves Wouters4 · Laurence Latu‑Romain4 ·
Alessandro Pugliara5 · Arnaud Proietti5 · Daniel Monceau3
Abstract
The oxidation of a Ni–30Cr alloy at 700 °C in impure argon was studied in order to provide new elements of understanding on chromia scale growth in low oxygen
partial pressure atmosphere (10−5 atm). Oxidation tests were carried out during 30
min to 50 h in a thermogravimetric analysis system using a symmetrical bal-ance with in situ monitoring of the oxygen partial pressure. The oxidation kinetics were determined as parabolic with an estimated stationary parabolic constant value of 10
−15 cm2 s−1, after a transient stage of about 3 h. The oxide scale was identified as a
pure chromia layer by TEM and XPS characterisations. After 50 h at 700 °C, the scale thickness estimated by TEM cross section observation was about 100 nm. A slightly thicker and more porous oxide scale was observed above the alloy’s grain boundaries. The metal/oxide interface also exhibited a deeper recession towards the substrate above the alloy’s grain boundaries. The orientation of chromia grains was determined by TKD (transmission Kikuchi diffraction). A strong preference was noted for the orientation perpendicular to the surface, along the < 0001 > direction of the corundum structure. Finally, the type of semiconduction was determined for the scales formed after 7 h and 50 h of oxidation. For the shorter oxidation time, the chromia scale exhibited an n-type semiconduction, whereas for the longer exposure, both n-type and insulating semiconduction were identified.
Keywords Ni–Cr alloy · Chromia · Oxidation · Photoelectrochemistry · TEM ·
Thermogravimetry
* Laure Martinelli
Introduction
Chromia-forming alloys are widely used in various applications at service tem-peratures not exceeding 900 °C. Their use at higher temtem-peratures is limited,
espe-cially under high oxygen and water vapour pressures because chromia (Cr2O3)
oxidizes into a gaseous oxide (CrO3) or forms an hydroxide (Cr(OH)3). When a
continuous and dense chromia scale is formed and remains at the surface of the alloy, it protects the alloy from fast, high-temperature oxidation. Indeed, chromia scales are known to grow with a diffusion m echanism h aving l ow oxygen a nd
chromium diffusion coefficients [1]. For some applications, however, the lifetime
of materials can be controlled by the growth kinetics of chromia scales. There-fore, it is important to study the chromia growth kinetics and the microstructure of chromia scales because it can drive diffusion properties. The influence of the oxide scale’s grain size evolution on oxidation kinetics has been recently studied
theoretically [2]. Studying experimentally the correlation between chromia scale
microstructure evolutions and scaling kinetics is difficult at intermediate tempera-tures due to the thinness of scales formed. After a literature review underlining the links between microstructure, kinetics and diffusion, this paper will present results obtained after the oxidation of a Ni–30Cr alloy, at 700 °C, under low oxy-gen partial pressure, with the aim of forming an exclusive chromia oxide scale. Parameters Impacting Chromia Oxidation Kinetics
Experimentally, oxidation kinetics is determined by monitoring weight gain or oxide layer thickness versus oxidation time. In the case of a dense and protective oxide growth, experimental oxidation kinetics generally follows a parabolic law
in agreement with Wagner’s theory [3]. According to this theory, the
character-istic parameter of the oxidation kinetics is the parabolic rate constant (kp) which
is proportional to the diffusion coefficient of the fastest specie in the oxide scale.
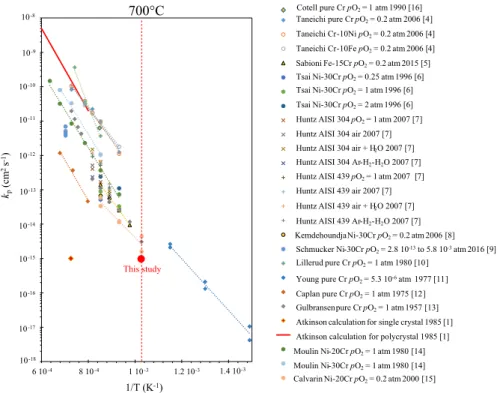
Figure 1 gathers the literature data on kp values obtained from the oxidation of
pure chromium or alloys that form an exclusive chromia scale [1, 4–16]. Reported
kp values spread out over three to six orders of magnitude for a given
tempera-ture. Figure 1 also reports theoretical kp values calculated by Atkinson [1] using
experimental data from the tracer diffusion c oefficients mea sured in a chr omia
single crystal and in a polycrystalline chromia by Hagel [17]. When reviewing
the influence o f g rain b oundary ( GB) d iffusion on hi gh-temperature ox idation,
Atkinson noticed that 1/ experimental kp are closer to the kp value calculated from
the tracer diffusion coefficient measured in polycrystalline chromia than to the kp
value calculated from the tracer diffusion coefficient measured in a single crystal
of chromia; and 2/ the calculated kp of polycrystalline chromia can be up to six
orders of magnitude higher than that of a chromia single crystal. Atkinson and
Taylor [1] then concluded that the growth kinetics of chromia scales is greatly
affected by grain boundary diffusion. The microstructure of the chromia scale can thus have a significant influence on oxidation kinetics.
There are many parameters that could explain the dispersion of the literature
values of kp obtained at a given temperature. These parameters, that can influence
scale microstructure, or oxide point defects and thereby oxidation kinetics, are: the duration of the oxidation experiment in case of a transient stage (difficult to identify if not mentioned by the authors); the nature of the oxidizing gas (in
par-ticular the presence of H2O) and the equivalent oxygen partial pressure; and the
composition of the alloy.
The nature of the dominant point defects can influence oxidation kinetics, as long as scale growth kinetics is partly controlled by volume diffusion. A recent
study from Parsa et al. [18] showed that two chromium samples oxidized in the
same conditions (10 h at 800 °C in air), after two different heat treatments (30 min
at 800 °C in pO2 = 10−13 atm or pO2 = 0.2 atm) led, for one sample, to the
forma-tion of n-type semiconducting and insulating chromia and, for the other sample, to a n- and p-type semiconducting chromia. The oxide layer obtained after 10 h of oxidation at 800 °C on the “n- and p-type chromia” sample is three times thicker than the oxide layer obtained on the “n-type and insulating chromia” sample. Parsa concluded that the presence of insulating chromia slowed down the oxida-tion kinetics. The authors did not menoxida-tion the oxide thickness and the chromia grain size of each sample after the heat treatment. These parameters could also
This study
6 10-4 8 10-4 1 10-3 1.2 10-3 1.4 10-3
Taneichi pure Cr pO2= 0.2 atm 2006 [4]
Taneichi Cr-10Ni pO2= 0.2 atm 2006 [4]
Taneichi Cr-10Fe pO2= 0.2 atm 2006 [4]
Sabioni Fe-15Cr pO2= 0.2 atm 2015 [5]
Tsai Ni-30Cr pO2= 0.25 atm 1996 [6]
Tsai Ni-30Cr pO2= 1 atm 1996 [6]
Tsai Ni-30Cr pO2= 2 atm 1996 [6]
Huntz AISI 304 pO2= 1 atm 2007 [7]
Huntz AISI 304 air 2007 [7] Huntz AISI 304 air + H2O 2007 [7]
Huntz AISI 304 Ar-H2-H2O 2007 [7]
Huntz AISI 439 pO2= 1 atm 2007 [7]
Huntz AISI 439 air 2007 [7] Huntz AISI 439 air + H2O 2007 [7]
Huntz AISI 439 Ar-H2-H2O 2007 [7]
KemdehoundjaNi-30Cr pO2= 0.2 atm 2006 [8]
Schmucker Ni-30Cr pO2= 2.8 10-13to 5.8 10-3atm 2016 [9]
Lillerud pure Cr pO2= 1 atm 1980 [10]
Young pure Cr pO2= 5.3 10-6atm 1977 [11]
Caplan pure Cr pO2= 1 atm 1975 [12]
Gulbransenpure Cr pO2= 1 atm 1957 [13]
Atkinson calculation for single crystal 1985 [1] Atkinson calculation for polycrystal 1985 [1] Moulin Ni-20Cr pO2= 1 atm 1980 [14]
Moulin Ni-30Cr pO2= 1 atm 1980 [14]
Calvarin Ni-20Cr pO2= 0.2 atm 2000 [15] -18 -17 -16 -15 -14 -13 -12 -11 -10 -9 10 10 10 10 10 10 10 10 10 10 10-8 1/T (K-1) 700°C kp (cm 2s -1)
Cotell pure Cr pO2= 1 atm 1990 [16]
Fig. 1 kp values of Cr2O3 growth. For each study, the author, the year, the substrate and the oxygen
have an influence on chromia growth kinetics. Nevertheless, it is likely that the nature and density of the point defects are the main factors affecting growth
kinet-ics. However, recent and older studies [18–22] show that the three point defects,
Cri, VO, VCr, have already been identified during the formation of chromia layers.
Determining these defects is thus required to fully characterize oxidation kinetics. Chromia Layer Morphology
Hallström et al. [23] studied the morphology of chromia scales formed on pure
chro-mium at 625 and 700 °C in pure oxygen at atmospheric pressure during 24 h. The chromia layers formed under these conditions are about 250 nm thick and present local variations in thickness that correspond to the different substrate grains of the
alloy. Considering parabolic kinetics, the value of kp = e2/t, calculated from reported
oxidation durations (t) and oxide thicknesses (e), is close to 7.10−15 cm2 s−1 (within
the lowest range of values in Fig. 1). Since this kp value was calculated for the
pre-sent work and not given by the authors, it is not plotted in Fig. 1. Transmission
elec-tron microscopy (TEM) observations showed a columnar grain microstructure with a thin layer of equiaxed grains at the metal/oxide interface. Pores are observed in the layer at the metal/oxide interface.
Pure Cr oxidation tests at 800 and 900 °C at low O2 pressures (from 10−12 to
10−14 atm) [18–20] revealed a duplex chromia layer microstructure composed of an
inner layer of equiaxed grains and an outer layer of columnar grains. The inner/outer layers interface is characterized by a layer of equiaxed textured grains oriented along the < 0001 > direction of the corundum structure. This layer corresponds to the first
stages of pure chromium oxidation [20] showing both inward and outward growth
directions. A high porosity is observed at the metal/oxide interface, and some smaller pores are found inside the chromia layer.
Zurek et al. [24] compared chromia microstructures formed on a Ni–25Cr
sub-strate at 1000 and 1050 °C, in two different atmospheres: a high pO2 dry atmosphere
(Ar-20% O2 mixture, pO2 = 0.04 bar) and a low pO2 wet atmosphere (Ar-4%H2-7%
H2O mixture, pO2 = 10−16 to 10−14 bar). The chromia formed in dry atmosphere at
high pO2 presents columnar grains. Voids and internal pores are observed at and
near the metal/oxide interface. The chromia layer formed at low pO2 in wet
atmos-phere presents a very fine grain size in the order of 100 nm with a grain size gradi-ent across the layer. The metal/oxide interface shows no porosity: the oxide layer is compact and perfectly adherent to the substrate.
In conclusion, only a few studies have thoroughly examined the microstructure of chromia scales. Those that do mention different microstructures, not one type in particular. Therefore, the microstructure of chromia scales obviously depends on experimental conditions. Conclusions on the growth mechanism of chromia found in the literature are mostly based on oxidation kinetics, oxide microstructure or pre-dominant point defects. However, in order to better understand the complex correla-tion between these three factors, the present study focuses on identifying the micro-structure of the oxide and the nature of the predominant point defects as well as on the determination of growth kinetics. Specific conditions were applied, i.e. Ni–30Cr
alloy oxidized at 700 °C in argon atmosphere (pO2 = 10−5 atm), in order to obtain exclusive chromia scales.
Experimental Procedures
The material used in this study is a Ni–30Cr alloy manufactured by Ugine-Savoie Imphy (France). Composition analysis was performed by inductively coupled plasma optical spectrometry (ICP-OES) and gave a composition of 69.85 mass% of Ni and 29.95 mass% of Cr. Impurity concentrations were measured by glow dis-charge mass spectroscopy (GDMS). The content values were lower than 500 ppm (Si 450 ppm, Fe 350 ppm, Mn 25 ppm, and S 15 ppm). The samples came from a single raw casting ingot. In order to obtain a homogeneous and controlled micro-structure, a thermomechanical treatment was applied to the alloy. A cold-rolling step was performed to reach a 60% deformation. The laminated plate was cut into 10 × 15 or 10 × 30 mm coupons. The samples were then annealed during 17 h at 1150 °C in an argon-backfilled vacuum furnace. Finally, they were ground with SiC paper down to a P1200 grit (European P-Grade) equivalent to 600 grit (ANSI grit) paper and polished using diamond pastes of 9 µm, 3 µm, 1 µm and ¼ µm diameter. After the thermomechanical treatment, the alloy was composed of equiaxed grains with a grain size of about 70 μm having no preferential orientation. The
microstruc-ture contained twined crystals. Sample surfaces contained about 27,000 grains/cm2.
The large number of grains on each sample surface makes it possible to avoid vari-ations among the different samples in case the oxidation kinetics depends on grain orientation.
Oxidation tests were carried out by thermogravimetry analysis (TGA) using a
Setaram TAG 24® apparatus in a symmetrical set up, with a mass change detection
limit equal to 5 μg. This symmetrical configuration consists in measuring the differ-ence of weight variation between the studied material and one referdiffer-ence’s material (here platinum), which does not react with the environment. Both materials are sub-jected to the same environment and temperature conditions. The heating ramp was
the following: a fast heating performed with a setpoint of 60 °C min−1 up to 670 °C,
followed by a slower ramp with a setpoint of 10 °C min−1 to avoid exceeding the
dwell temperature of 700 °C. The heating duration was 14 min, but around 15 more minutes were necessary to stabilize the temperature of the two furnaces at ± 1 °C. The dwell lasted 30 min to 50 h depending on the oxidation test. After the dwell, the furnaces were turned off with a cooling rate corresponding to the thermal inertia of the furnaces. Experimental tests were performed at 700 °C and under atmospheric
pressure in argon containing 10−5 atm of oxygen. This impure argon comes from air
products company and is sold under the name Technical Ar ® (4.8), meaning that
the purity is 99.998%. The gas is injected at the beginning of the heating ramp. The
flow rate, measured with a rotameter at the outlet of the TGA system, was 1 L h−1
for each furnace.
The oxygen content was monitored during the oxidation tests using two
oxy-gen probes. A first in situ oxyoxy-gen probe (Setnag micropoas®) was placed inside
JOK’AIR®) was placed in the gas outlet of both furnaces. The in situ zirconia oxygen probe measurement was operant when the furnace temperature exceeded 500 °C, whereas the ex situ probe was able to measure the oxygen partial pres-sure whatever the temperature of the TGA furnace, due to its own heating device.
For some oxidation tests, a mass spectrometer (Pfeiffer Vacuum Omnistar®GSD
310C) was coupled to the TGA system. Gases were analysed after sampling through a heated capillary in the TGA device, in the furnace containing the Pt sample because the in situ oxygen probe in the furnace containing studied mate-rial hinders sampling system installation.
Four different tests were conducted in the same experimental conditions
(700 °C, Ar-10−5 atm O
2) but with different durations, i.e. 30 min, 1 h, 5 h and
50 h. The oxide scale growth during these tests led to very small weight gains
(maximum value reached: 2.5 10−2 mg cm−2). Even with the use of a
symmetri-cal balance, the buoyancy effect was significant as compared to these tiny weight gains. It could correspond to about 50% of the maximum mass gain signal. The oxidation kinetics was thus corrected to remove the buoyancy effect. The
buoy-ancy correction method is given in “Appendix”.
Thin cross section foils, with a thickness ranging between 50 and 100 nm, were extracted from the 50 h oxidized sample, using a dual-beam system Helios
NanoLab 600i containing a Ga+ focused ion beam (FIB) together with a field
emission gun (FEG) scanning electron microscope (SEM). The free surface of the
sample was protected from Ga+ damage with two thin layers of C and Pt
deposi-tion. The thin foils were fixed on a TEM copper grid. TEM observations were performed with a FEG transmission electron microscope operating at 200 kV (FEG-TEM JEOL JEM 2100F) equipped with an energy-dispersive X-ray spec-troscopy (EDS) BRUKER detector. Transmission Kikuchi Diffraction (TKD) analyses were performed with a FEG-SEM JEOL JSM 7100F TTS LV equipped with an electron backscatter diffraction (EBSD) detector (Nordlys Nano, Oxford Instruments). TKD analysis consists in studying the Kikuchi diffraction patterns in transmission through a thin sample, on a SEM. The main advantage, compared with conventional EBSD, is the very good spatial resolution (~ 5 nm). X-ray pho-toelectron spectrometry (XPS) analyses were performed on a ThermoFischer Escalab 250 Xi spectrometer. The monochromatic X-ray source used was Al
kα with an incident energy of 1486.6 eV. The analysis spot size was 900 µm in
diameter.
Photoelectrochemistry was performed to determine the semiconduction type of the oxide scales formed on the samples. This technique is fully described in the
literature [20, 25]. Briefly put, a photocurrent is generated from a
semiconduct-ing surface submitted to a monochromatic light and adequately polarized in an electrolyte The oxidized sample was used as a working electrode on a three-elec-trode cell with a mercury–mercurous sulphate reference electhree-elec-trode (+ 0.650 V vs. Standard hydrogen electrode) and a platinum counter electrode. Measurements were made at room temperature, using an electrolyte of sodium sulphate 0.1 M. The light beam illuminating the oxide surface was provided with a xenon arc light source. The wavelength varied from 200 nm (~ 6.2 eV) to 620 nm (~ 2 eV) with a 1 nm step by using a monochromator.
Results
Oxidation Kinetics
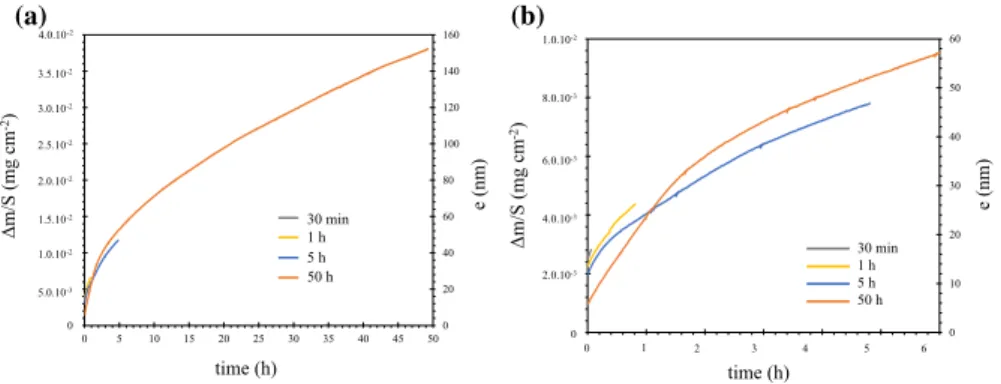
The oxidation kinetics of all oxidation durations are reported in Fig. 2 with
dif-ferent time scales. The mass gain curves are plotted from the moment the dwell temperature (700 °C) is reached. Hence, the initial mass gain corresponds to the oxidation that occurred during the heating process. The weight gain signal was converted into oxide thickness assuming the chromia scale is perfectly dense and uniform with no variation of the reactive surface area during the oxidation. The conversion equation is defined as follows:
where e is the oxide thickness (cm), MCr2O3 the molar mass of chromia equal to
152 g mol−1, M
O the molar mass of oxygen equal to 16 g mol−1, 𝜌Cr2O3 the density
of chromia equal to 5.22 g cm−3, Δm the mass gain (g) and S the surface area of the
sample (cm2).
The oxidation kinetics obtained for the different oxidation durations present the same shape. The initial mass gains, however, are different. They can vary by
a factor 3 at maximum between the different tests (Fig. 2b). But these differences
correspond to a few micrograms only. The thickness of the initial oxide layers does not exceed 20 nm. Looking at the curves, the oxidation kinetics is rather parabolic. Experimental oxidation kinetics of the 5-h and the 50-h tests was
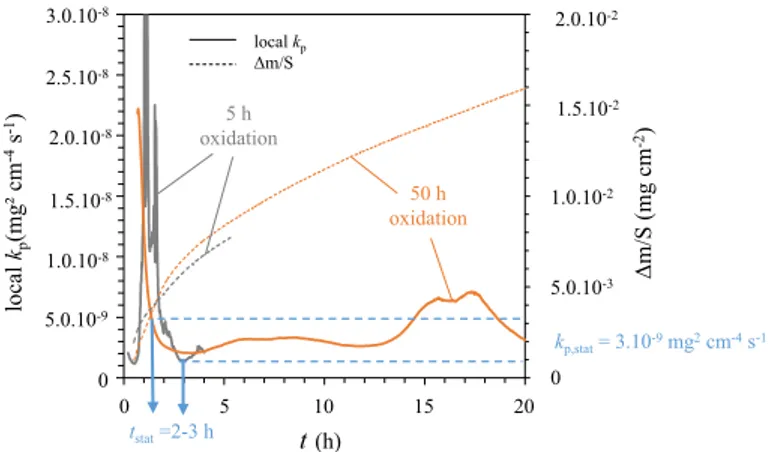
pro-cessed using the local kp method with a complete parabolic law [26] (Fig. 3).
The principle of the local kp method is to fit locally the experimental oxidation
kinetics with the complete parabolic law given by Eq. (2). The fit is performed
within a fitting window that is translated on the entire experimental oxidation
kinetics curve. For each fitting window position, a local kp value is obtained.
(1) e= MCr 2O3 3MO𝜌Cr 2O3 Δm S 0 20 40 60 80 100 120 140 160 0 5 10 15 20 25 30 35 40 45 50 e (nm) e (nm) Δm/S (mg cm -2) 30 min 1 h 5 h 50 h (a) time (h) 3.5.10-2 3.0.10-2 2.5.10-2 2.0.10-2 1.5.10-2 1.0.10-2 5.0.10-3 0 4.0.10-2 0 10 20 30 40 50 60 time (h) 0 0 Δm/S (mg c m -2) 2.0.10-3 4.0.10-3 6.0.10-3 8.0.10-3 1.0.10-2 1 2 3 4 5 6 30 min 1 h 5 h 50 h (b)
Fig. 2 Oxidation kinetics of Ni–30Cr samples oxidized in TGA system in impure Ar atmosphere (pO2 = 10−5 atm) at 700 °C for 30 min, 1 h, 5 h and 50 h; a from 0 to 50 h, b zoom in on a, from 0 to 6 h
where t is the time, Δm, the mass gain, and A, B and C constants with kp= 1∕C
This method highlights the presence of a transient regime. When the local kp
value reaches a plateau, the stationary regime controlled by diffusion is reached. The
method is thoroughly explained by Monceau and Pieraggi [26].
The local kp method cannot be applied to the shortest oxidation tests (30 min and
1 h). Indeed, these short oxidation durations lead to a low signal-to-noise ratio.
For the 5-h and the 50-h TGA tests, the evolution of kp is significant during the
first 2–3 h, which corresponds to the duration of the transient stage. From 0 to 3 h,
the local kp decreases by more than one order of magnitude. After 3 h, the local kp
can be considered as stationary, and the oxidation kinetics is then parabolic. The sta-tionary kp value is estimated at 3.10−9 mg2 cm−4 s−1, i.e. 10−15 cm2 s−1. This kp value
is plotted in the Arrhenius graph in Fig. 1 with the label “This study”. The
station-ary kp value obtained experimentally is in good agreement with the lowest range of
kp values from the literature.
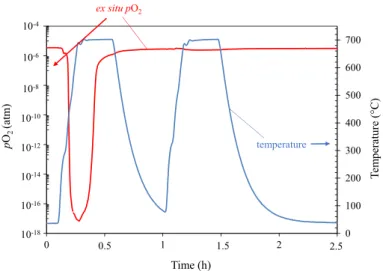
The oxygen partial pressure (pO2) was measured ex situ in the outlet gas of the
TGA system throughout the oxidation tests. Figure 4 shows the evolution of pO2 and
of the temperature recorded close to the sample during the 50-h oxidation test.
The initial phase of all oxidation tests displayed a sharp decrease in pO2 (as the
one shown in Fig. 4). This was a significant and reproducible phenomenon. In order
to verify if this oxygen consumption was due to the oxidation of the studied mate-rial, a blank test was carried out, using two platinum samples assumed to be inert to oxidation, and performing two successive thermal cycles without opening the TGA device in between so as to avoid introducing ambient air. The temperature and the ex
situ pO2 recorded during this blank test are presented Fig. 5.
There is a sharp pO2 decrease at the beginning of the blank test, during the first
heating (Fig. 5). The pO2 value reaches a minimum of about 10−17 atm after
approx-imately 0.3 h (Fig. 5). Moreover, during the second heating, there is no pO2 decrease
(2) t= A + Bm + Cm2 0 5 10 15 20 t(h) 3.0.10-8 2.5.10-8 2.0.10-8 1.5.10-8 1.0.10-8 5.0.10-9 0 0 5.0.10-3 1.0.10-2 1.5.10-2 2.0.10-2 Δm/S (mg cm -2) local kp (mg² c m -4s -1) oxidation5 h 50 h oxidation kp,stat= 3.10-9mg2cm-4s-1 tstat=2-3 h local kp Δm/S
Fig. 3 Local kp and oxidation kinetics of Ni–30Cr samples oxidized in TGA system in impure Ar
(Fig. 5). This result suggests that the pO2 decrease observed concurrently in all oxi-dation tests and in the blank test is not related to the oxioxi-dation reaction of the sample and occurs only during the first heating after having opened the TGA device.
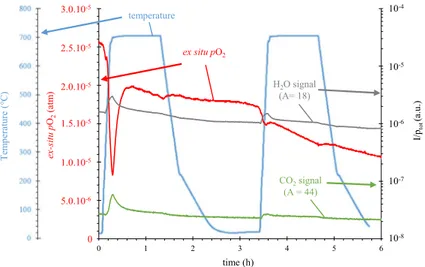
To better understand this decrease in pO2, a second blank test was performed.
The partial oxygen pressure (pO2) and the concentrations of CO2 and H2O were
monitored. The former using an oxygen probe at the outlet of the TGA gas circuit, and the latter using a mass spectrometer with atomic mass units (amu) 44 and 18,
670 675 680 685 690 695 700 705 710 715 0 1 2 3 4 5 time (h) 10-5 10-6 10-7 10-8 10-9 10-10 10-11 10-12 10-13 10-14 10-15 10-4 Tem perature (° C) temperature ex situ pO2 pO2 (atm )
Fig. 4 Ex situ oxygen partial pressure and furnace temperature as a function of time in the TGA system for the 50-h oxidation test
0 100 200 300 400 500 600 700 0 1 2 pO2 (atm ) Te mp eratur e( °C ) temperature ex situ pO2 Time (h) 10-4 10-6 10-8 10-10 10-12 10-14 10-16 10-18 0.5 1.5 2.5
Fig. 5 Ex situ oxygen partial pressure and furnace temperature as a function of time in the TGA system for the blank test with two platinum samples
respectively, corresponding to CO2 and H2O. This second blank test also underwent two consecutive thermal cycles without reopening the TGA apparatus in between
them. Temperature, ex situ pO2 and intensity collected by the quadrupole mass
spec-trometer (QMS) for amu 44 and 18 are plotted as a function of time in Fig. 6. In
order to overcome total pressure variations, the intensity reported is the ionic current measured for amu over the total pressure measured with the QMS.
The analysis of the composition of the outlet gases (Fig. 6) shows a CO2
concen-tration peak that coincides with the pO2 signal minimum, at approximately 0.3 h
after the beginning of the second blank test. The increase in CO2 concentration is
thus associated with the consumption of O2. This is probably due to the combustion,
in the TGA system, of carbon-containing impurities. Two peaks in the H2O signal
can be noticed beyond 250 °C during each heating; this observation is likely due
to the desorption of water in the TGA system. The results of pO2 monitoring and
spectrometric analysis of the two blank tests indicate that the sharp decrease in pO2
observed at the beginning of the oxidation experiments is not mainly due to the oxi-dation of the samples but to other phenomena such as the combustion of impurities
that were adsorbed onto the furnace walls or other gas tube surfaces. The pO2 drop
is smaller during the second thermal cycle, which means that impurities may come from the inlet of ambient air when the TGA apparatus is opened. These impurities were thus not eliminated by the primary vacuuming.
At the beginning of the second blank test (Fig. 6), the oxygen partial pressure
decreases but remains in the same order of magnitude, whereas, at the beginning
of the oxidation tests (Fig. 4) and of the first blank test, the oxygen partial pressure
decreases of several orders of magnitude to reach a minimum value of 10−17 atm
(Fig. 5). This difference is likely related to the connection of the mass spectrometer,
degrading the airtight of the apparatus. For the oxidation tests, in addition to the O2
0 1 2 3 4 5 6 2.5.10-5 3.0.10-5 2.0.10-5 1.5.10-5 1.0.10-5 ex-situ pO2 (atm ) 5.0.10-6 0 10-4 10-5 10-6 10-7 10-8 Temp eratur e( °C ) I/pto t (a.u .) temperature ex situ pO2 CO2signal (A = 44) H2O signal (A= 18) time (h)
Fig. 6 Evolution of temperature, 44 amu signal (corresponding to CO2) and 18 amu signal
(correspond-ing to H2O) from mass spectrometry, and pO2 signal by ex situ zirconia probe during the blank test in the
consumed by the combustion of carbonated impurities, a part of the O2 consumption is expected to be due to the oxidation phenomenon. However, this latter assump-tion cannot be quantified because the composiassump-tion of the inlet oxidaassump-tion gas was not monitored.
Nature of the Oxide Scale
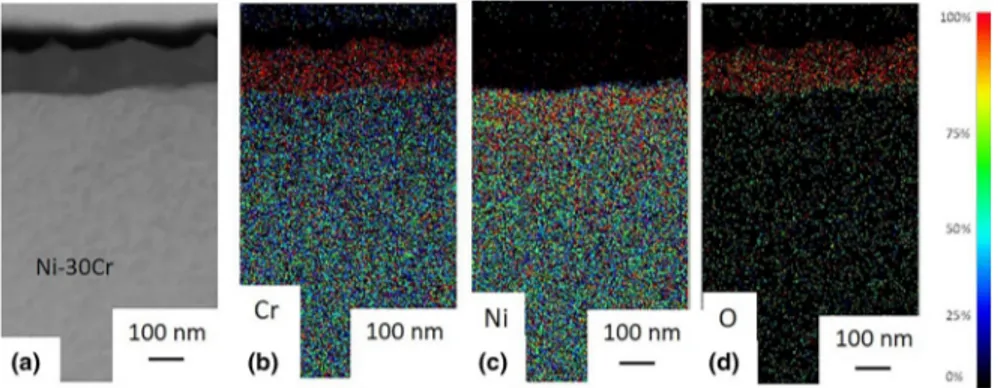
The corrosion products formed on the surface of the Ni–30Cr alloy were analysed to determine their composition and structure. EDS elemental mappings were carried out in a TEM on a FIB cross section of the 50 h oxidized sample. Mappings
pre-sented in Fig. 7 correspond to Cr, Ni and O distributions. They show the presence of
a 100-nm-thick corrosion layer composed of chromium and oxygen. This local oxide thickness is in fair agreement with the average oxide thickness calculated from the
weight gain of 2.5 10−2 mg cm−2 obtained after 50 h of oxidation which amounts to
an oxide thickness of 150 nm (Fig. 2). However, the oxide scale thickness is quite
heterogeneous: 290 measurements were performed on cross section of this sample, the average thickness is 165 nm that is in good agreement with the value obtained from the weight gain (150 nm), the minimum value is 100 nm, the maximum value is 280 nm, and the standard deviation is 47 nm.
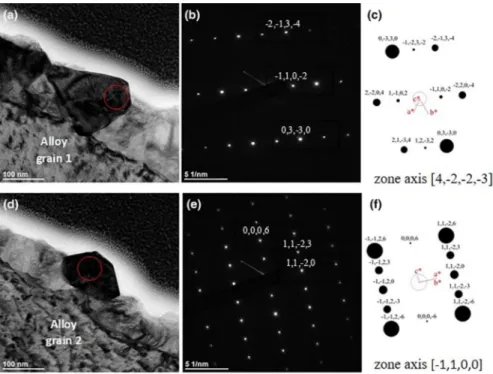
The TEM electron diffraction patterns of the oxide scale are shown in Fig. 8. A
convergent-beam electron diffraction pattern with a convergence semi-angle infe-rior to 0.01° (converged electron diffraction) was performed on two oxide grains. The analysed area corresponds to the red circle (diameter 50 nm) in the bright field
images shown in Fig. 8a, d. Converged diffraction patterns are given in Fig. 8b, e.
The single sets of parallel planes are indicated and correspond to the corundum
structure leading to the identification of chromia (Fig. 8c, f). Chromia crystal planes
are indicated in the diffraction patterns of Fig. 8b, e.
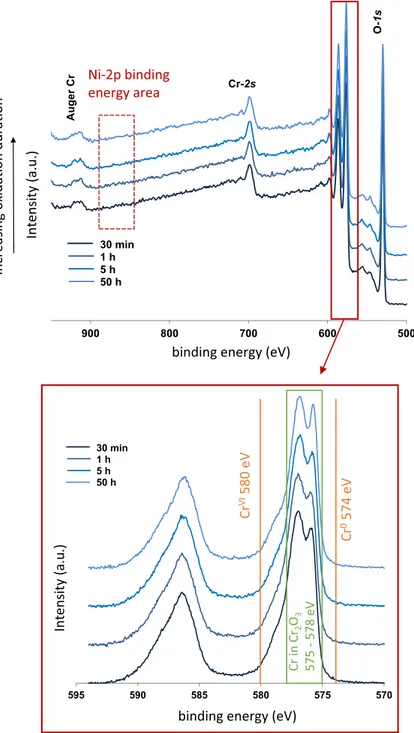
XPS analyses were performed in order to determine if other oxides, apart from chromia, were present at the surface of the oxide layer of all oxidation tests. The
XPS survey and Cr-2p core levels spectra are shown in Fig. 9 for each oxidation
Fig. 7 TEM cross sections associated with EDS maps of the 50 h oxidized sample at 700 °C in impure Ar (pO2 = 10−5 atm) a high annular dark-field image of the analysed area, and EDS mappings: b for
duration. Only photoelectron peaks corresponding to oxygen and chromium ele-ments are present. The energy range corresponding to the binding energy of Ni-2p core levels (from 850 to 880 eV) presents no peak. The binding energy peaks
detected experimentally for the Cr-2p core levels correspond to Cr3+ in chromia for
all the oxidation durations studied (30 min, 1 h, 5 h and 50 h).
Based on TEM-EDS, electron diffraction and XPS results, the oxide layer is iden-tified as crystallized chromia, whichever the duration of the oxidation test. If this layer contains other elements, their concentration is low, below the limit of detection of EDS and XPS (about 0.1 at % for XPS).
Morphology of the Oxide Layer Formed After 50 h of Oxidation
TEM observations were performed on a metal grain boundary of the sample oxi-dized 50 h. In this way, the microstructure of the chromia scale can be observed not only above the grain boundary but also above the grain. A complete view of the different observation areas (alloy grain 1, alloy grain boundary and alloy grain 2)
Fig. 8 Observations and TEM diffraction patterns on FIB cross section of the Ni–30Cr sample oxidized 50 h at 700 °C in an impure Ar atmosphere (pO2 = 10−5 atm): a and d TEM bright field image of the
oxide scale chosen for electron diffraction for alloy grains 1 and 2 (see Fig. 10 for alloy grain defini-tion); respectively, b and e correspond to the converged electron diffraction pattern of the red-circled area inside the oxide scale, and c and f calculated X-ray diffraction pattern for corundum structure of chromia in zone axis [4, − 2, − 2, − 3] and [− 1, 1, 0, 0], respectively, using CaRIne software [CaRIne crystallog-raphy software © 1989-2019] (Color figure online)
500 600 700 800 900 30 min 1 h 5 h 50 h O-1s Cr-2p Cr-2s Auge rC r 570 575 580 585 590 595 30 min 1 h 5 h 50 h Cr VI580 eV Cr 0574 eV Cr in Cr 2 O3 575 - 578 eV
Increasing oxida on dura on
Intensity (a.u.)
Ni-2p binding energy area
binding energy (eV)
binding energy (eV)
Intensity (a.u
.)
Fig. 9 XPS spectra of Ni–30Cr samples oxidized in a TGA system in impure Ar atmosphere (pO2 = 10−5 atm) at 700 °C for 30 min, 1 h, 5 h and 50 h
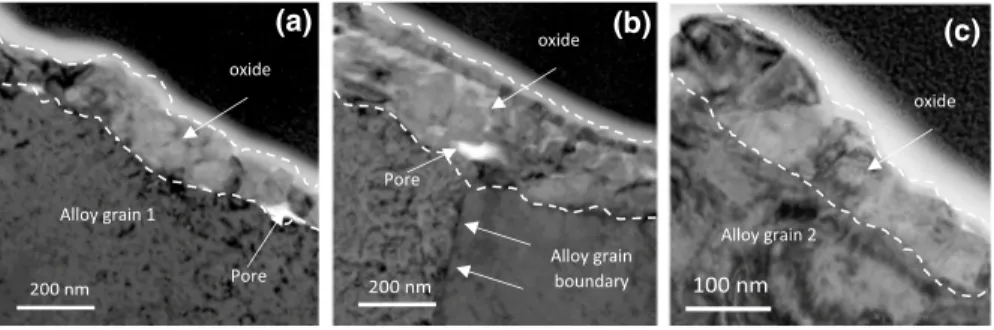
is given in Fig. 10. Figure 11 shows enlarged TEM observations zoomed in on the three observation areas.
Above grains 1 and 2 (Fig. 11a, c), the oxide layer is dense and composed of
rather dense equiaxed oxide grains with a characteristic size of a hundred nm. Fur-ther observations reveal that the oxide layer thickness is different above alloy grains 1 and 2 (130 and 100 nm, respectively).
Above the alloy grain boundary (GB) (Fig. 11b), the oxide layer exhibits a
dif-ferent structure and is thicker (about 200 nm) than above the adjacent alloy grains. Moreover, the metal/oxide interface recession is larger at the metal GB than in the middle of the metal grains. One can also notice that the oxide layer surface above the GB zone presents a duplex structure. The outermost layer is thin and dense. It is made up of a single row of small oxide grains (grain size around 20 nm) which
Fig. 10 TEM bright field image of a Ni–30Cr sample oxidized for 50 h in impure Ar atmosphere (pO2 = 10−5 atm)
at 700 °C. The thin section was extracted across a grain bound-ary of the alloy
Alloy grain 1 Alloy grain 2 1 µm (c) 100 nm Alloy grain 2 (b) 200 nm Alloy grain boundary (a) 200 nm Alloy grain 1 oxide oxide oxide Pore Pore
Fig. 11 TEM bright field images of a Ni–30Cr sample oxidized 50 h in impure Ar atmosphere (pO2 = 10−5 atm) at 700 °C. Zoom in on the areas of Fig. 10: a alloy grain 1, b alloy grain boundary, c
seems to be in continuity with the oxide layers observed above grains 1 and 2
(Fig. 10). Beneath this dense upper layer, a thicker and porous inner layer is
com-posed of several layers of grains. Pores are located at the metal/oxide interface.
Finally, the oxide/gas interface is concave above the alloy grain boundary (Fig. 10).
This particular morphology of the oxide growing above an alloy grain boundary was systematically observed on SEM images made on cross sections.
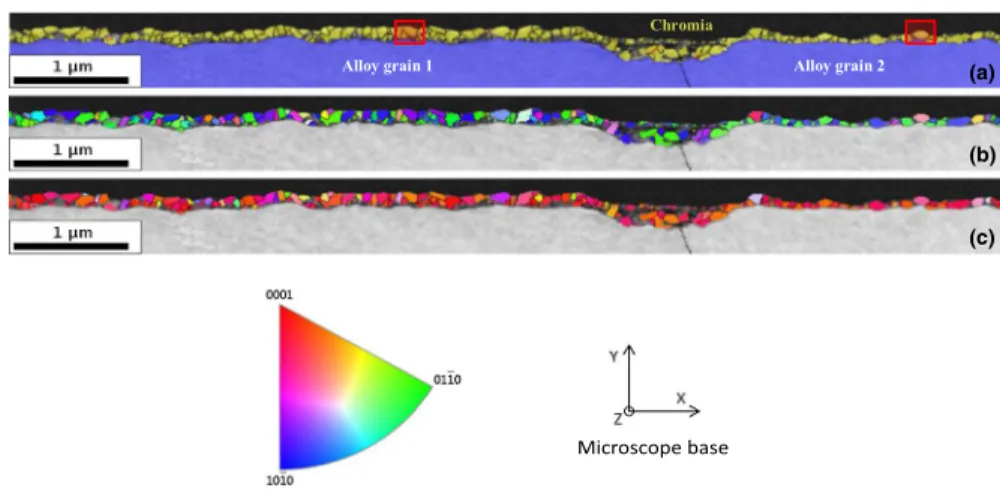
TKD maps obtained on the FIB thin section are given in Fig. 12.
The phase map (Fig. 12a) confirms that the oxide layer is composed of
chro-mia exclusively. The inverse pole figure along the Y axis (Fig. 12c), i.e. the
grow-ing direction (vertical on the image) indicates a preferential orientation of the oxide grains in the < 0001 > direction of the corundum structure, perpendicular to the sample surface. The inverse pole figure along the X axis, i.e. perpendicular to the growing direction (horizontal on the image) does not show any strong texture. The crystalline orientations of these two specific metal grains were not determined, but the EBSD map of the sample shows that the alloy is not textured. For that reason, it is not possible to know whether the preferential orientation of the chromia grains is linked to the orientation of the substrate. But this is unlikely, because the preferred orientation of the chromia scale is similar above both substrate grains.
The pole figures of chromia corresponding to crystallographic planes {0001},
{10–10} and {11–20} are given in Fig. 13. They confirm a strong texture of
chro-mia grains where {0001} planes are perpendicular to the sample surface. The same
preferential orientation of the chromia layer was observed by Parsa et al. [18] and
Latu-Romain et al. [20] in a chromia layer formed during the first stages (3 min,
900 °C, pO2 = 10−12 atm) of the oxidation of a pure chromium substrate with
mul-tiple grain orientations. In other words, the same orientation of the chromia layer was observed on a pure chromium substrate (body-centred cubic structure), and on
Microscope base
(b)
(c) (a)
Alloy grain 1 Alloy grain 2
Chromia
Fig. 12 TKD analysis of the cross section of the 50 h Ni–30Cr sample oxidized in impure Ar atmosphere (pO2 = 10−5 atm) at 700 °C, standard triangle for the corundum structure and microscope base for the
sample orientation: a phase map (in yellow the chromia phase; in blue the alloy phase), b and c orienta-tion maps along the X and Y direcorienta-tions, respectively. Red squares correspond to the grains studied by converged electron diffraction (Fig. 7) (Color figure online)
a Ni–30Cr substrate (face-centred cubic structure). In both cases, the growth direc-tion of the crystal is [0001] and does not depend on the crystallographic orientadirec-tion of the substrate. This means that there is no epitaxy with the substrate even for such thin oxide scales. This result would require additional studies to better understand the origins and consequences of this specific orientation of chromia grains.
Determination of the Semiconduction Type by Photoelectrochemistry (PEC) The semiconducting properties of the chromia scale were identified by photoelec-trochemistry (PEC) on samples oxidized 7 h and 50 h. PEC results of the sample
oxidized during 7 h are gathered in Fig. 14.
In Fig. 14a, b, the normalized photocurrent and the dephasing angle are plotted as
a function of the energy of the incident light. One semiconducting contribution can
be noticed in the energy PEC spectra presented in Fig. 14a with a classic dephasing
angle shift of about 0° whatever the photon energy (Fig. 14b). In Fig. 14d, at the
energy (E = 4.9 eV) corresponding to the maximum value of the photocurrent, the
Fig. 13 Pole figures {0001}, {10–10} and {11–20} for the oxide layer formed on a Ni–30Cr sample oxi-dized 50 h in impure Ar atmosphere (pO2 = 10−5 atm) at 700 °C. The analysis was carried out on 214
chromia grains of 75 nm average size formed above: a alloy grain 1 (143 grains analysed) and b alloy grain 2 (71 oxide grains analysed). Grey areas correspond to crystallographic domains where the density is three times higher than the density of a randomly oriented aggregate
photocurrent increases with anodic potential, exhibiting an n-type semiconduction [18, 20, 27].
In order to determine the bandgap energies of chromia, the linear transformation
(Iph E)1/2 was plotted against incident light energy (E) at a potential of − 800 mV
(Fig. 14c). A bandgap contribution is observed corresponding to an energy of
2.95 eV. This bandgap energy is in good agreement with chromia bandgap values
found in the literature [28].
PEC results of the sample oxidized 50 h are gathered in Fig. 15. For the 50-h
oxidized sample, the photocurrent behaviour is complex. Two contributions (C1 and
C2) are put in evidence with the PEC energy spectra in Fig. 15a. The contribution
labelled C1, with a bandgap energy at 2.95 eV already obtained in the 7-h sample
(Fig. 15b) and exhibiting an n-type semiconduction, is also identified in Fig. 15c, d.
The contribution labelled C2 presents a higher energy bandgap measured at 3.9 eV
(see linear transform—(Iph E)1/2 vs. E—in Fig. 15c).These bandgaps are in
agree-ment with those determined by Parsa et al. [18, 22] for chromia. The V-shaped
potential PEC spectrum (Fig. 15e) recorded at 4.9 eV, with a minimum near zero
photocurrent coming from the contribution C2, is typical of a semiconductor with
insulating properties. This would mean a very low deviation from stoichiometry.
Figure 15b presents the evolution of the dephasing angle as a function of energy
and applied potential: it shows that when the energy of the incident light is higher than the bandgap of the second contribution, the dephasing angle shows a 180° shift for low potentials (“p-type signature”), whereas it is constant for higher potentials (“n-type signature”). This information also confirms the insulating behaviour of the
-180 -140 -100 -60 -20 20 60 100 140 180
phase shift angle (°
) E (eV) V= -1000 mV V= -900 mV V= -800 mV V= -700 mV V= -600 mV V= -500 mV V= -400 mV V= -300 mV V= -200 mV V= -100 mV V= 0 mV (b) 2.5 3 3.5 4 4.5 5 5.5 (Iph E) 1/ 2(a.u. ) E (eV) 1.4 1.2 1 0.8 0.6 0.4 0.2 0 2.5 3 3.5 4 4.5 5 5.5 Eg(C1) = 2.95 eV (c) V = -800 mV -1000 -800 -600 -400 -200 0 1 0.8 0.6 0.4 0.2 0 (d) C1(E = 4.9 eV) V= -1000 mV/MSE V= 0 mV/MSE Iph (a.u.) Iph (a.u .) E (eV) V= -1000 mV/MSE C1 V= 0 mV/MSE (a) 0.2 0.3 0.4 0.5 0.6 0.7 0.8 0.9 1 0 0.1 2.5 3 3.5 4 4.5 5 5.5 V (mV/MSE)
Fig. 14 PEC characterization of the sample oxidized 7 h at 700 °C in impure Ar atmosphere (pO2 = 10−5 atm) a normalized photocurrent, Iph (in a.u.), versus incident light energy, E (in eV),
recorded at several applied potentials (V), b dephasing angle versus incident light energy, E, recorded at several potentials (V), c linear transformation, (Iph E)1/2 (in a.u.), versus incident light energy, E, recorded
at V = − 800 mV/MSE and d photocurrent Iph (in a.u.) versus applied potential (V) from − 1000 to 0 mV/
second contribution. Emergence of this insulating chromia, grown by adjusting the
oxygen activity, has already been observed by Latu-Romain et al. [20] on pure
chro-mium oxidized at 800 °C in Rhines pack with pO2 = 10−13 atm.
Consequently, the chromia formed after 50 h of oxidation at 700 °C in impure Ar
atmosphere (pO2 = 10−5 atm) contains two semiconducting regions, an n-type region
and an insulating region. According to Latu-Romain, the n-layer (C1) is located near
the metal/oxide interface where pO2 is low while the insulating region is located
where pO2 is higher, near the oxide/gas interface.
To conclude, the photoelectrochemistry results of samples oxidized 7 h and 50 h indicate a change in the type of semiconduction during the oxidation, with a
Fig. 15 PEC characterization of the sample oxidized 50 h at 700 °C in impure Ar atmosphere (pO2 = 10−5 atm) a normalized photocurrent, Iph (in a.u.) versus incident light energy, E (in eV), recorded
at several applied potentials (V), b dephasing angle versus incident light energy, E, recorded at several applied potentials (V), c linear transformation (Iph E)1/2 (in a.u.), versus incident light energy, E, recorded
at V = − 800 mV/MSE and d and e normalized photocurrent Iph (in a.u.) versus applied potential (V) from
transition from a unique n-chromia scale for the shorter oxidation duration (7 h) to an n-chromia and insulating chromia for the longer oxidation duration (50 h).
Discussion
pO2 Tracking
As stated previously, the evolution of pO2 observed during the first 2 h of the
oxida-tion experiments (Fig. 4) is not mainly due to the samples’ oxidation but rather to
the combustion of carbon-containing impurities present in the TGA furnace (Figs. 5
and 6). This pO2 drop could, nevertheless, impact the oxidation kinetics as its
tionary regime is reached after 2–3 h, which duration is similar to that of the
sta-bilization of pO2. This set of experiments shows that it is highly recommended to
use a gas analyser, or an oxygen probe when performing high-temperature oxidation under an inert gas containing oxygen impurities.
Oxidation Kinetics and Oxide Scale Microstructure
The stationary kp value obtained experimentally in this study is in good agreement
with the lowest range of kp values from the literature data [5, 11, 13, 15]. Sabioni
et al. [5] obtained a kp value of 10−14 cm2 s−1 and a chromia grain size of 0.4 µm at
750 °C. Young and Cohen [11] obtained a kp value close to 10−15 cm2 s−1 at 600 °C.
The oxide scales obtained by Young and Cohen [11] were very thin, in the order
of tens of nanometers. The associated chromia grain size was consequently in the same order of magnitude or smaller. Both authors identified the limiting step of the chromia growth to be the short circuit diffusion through the oxide scale. The
station-ary kp value obtained in the present study is, however, below the kp values found
in the literature for the same temperature. This difference could be explained by a
difference in experimental conditions. Indeed, Sabioni [5] oxidized Fe–15Cr steel
between 750 and 900 °C, in air atmosphere, Young [11] oxidized pure chromium
between approximately 400 and 600 °C in pO2 = 5.6 10−6 atm, and Hallström et al.
[23] oxidized pure chromium at 625 and 700 °C in pure O2 at atmospheric
pres-sure leading to 250-nm-thick chromia scales after 24 h of oxidation. Hallström et al.
[23] obtained chromia scales composed of outer columnar grains that were 200 nm
wide, and smaller inner grains that were 50 to 100 nm wide. These differences in experimental conditions could lead to differences in the microstructure of the oxide. Indeed, as seen in this study, even under the same experimental conditions and on the same sample, local differences of microstructure lead to different oxide scale thicknesses, i.e. growth kinetics. The morphology of the oxide scale observed after 50 h of oxidation is different above substrate grains and substrate grain boundaries
(Figs. 10, 11): the oxide above the alloy grain boundaries has a duplex structure, it
is more porous and its grain size is smaller than that of the oxide formed above the
The oxide layer observed in this study is dense and compact above the alloy
grains with equiaxed grains having a typical grain size of about 100 nm (Fig. 11).
This chromia grain size is close to the inner chromia grains observed by Hallström et al. [23].
Above substrate grain boundaries, the oxide scale is significantly thicker and porous and associated with a faster recession of the metal/oxide interface towards the substrate. This local thickening of the oxide scale above the alloy grain
bounda-ries has already been observed in the form of oxide ridges by Schmucker et al. [9]
on chromia scales grown on a Ni–30Cr substrate, and by Peraldi et al. [29] on NiO
scales grown on a pure nickel substrate. According to Peraldi et al. [29], the
pres-ence of the ridges could result from: a higher density of fast diffusion paths within the oxide, an easier annihilation of metallic vacancies on the alloy grain boundary, or a faster nucleation of oxide grains. The higher density of fast diffusion paths within the oxide above the metal grain boundary is linked to the fact that the oxide scale is porous directly above the metal grain boundary but dense directly above
the metal grains (Figs. 10, 11). The higher thickness of the oxide above the metal
grain boundary could also be explained by the fast diffusion of Cr in the metal grain boundary coupled with an oxide scale growth at least partially controlled by the dif-fusion of Cr in the metal. Even if the first suggestion, i.e. fast difdif-fusion path within the oxide, is in agreement with experimental observations, a faster Cr diffusion in the alloy grain boundary could also occur. In this study, however, the locally thicker oxide scale above the alloy grain boundary is related to groove (surface recession)
rather than ridges observed in other studies [9, 29].
Interpretations for these oxide scale morphologies are proposed schematically
in Fig. 16. When the oxide growth rate increases locally, if the total recession of
the metal/oxide interface occurs homogeneously, the vacancies created at the metal/ oxide interface, in the metal side, by oxidation of Cr atoms, are all annihilated at
the metal/oxide interface. As for the Ni–Cr/Cr2O3 couple, the Pilling Bedworth ratio
(PBR) is close to 2, and the volume of consumed metal is equal to half of the vol-ume of the oxide formed. Then, the local recession of the metal/oxide interface at
the grain boundary of the alloy (blue arrow in Fig. 16a) must be half of the oxide
Alloy grain 1 Oxide
High density of diffusion path in the oxide
Local recession of the metal/oxide interface = thickness of metal consumed
Oxide ridge
Alloy grain 1 Alloy grain 2 Oxide
Cr Cr
V Local vacancy sinkV
Alloy grain 2
(a) Oxide thickness increase above (b)
the grain boundary of the alloy
Fig. 16 Schematic interpretation of oxide scale morphologies a local thickening (ridge) of oxide scale and total recession of the metal/oxide interface, b local thickening of oxide scale and excessive reces-sion of the metal/oxide interface, observed after 50 h of oxidation at 700 °C in impure Ar atmosphere (pO2 = 10−5 atm) (Color figure online)
thickness increased above the grain boundary of the alloy (blue plus green arrows
in Fig. 16a). The thickness of the oxide ridge (green arrow in Fig. 16a) must then be
equal to the thickness of the local recession of the metal/oxide interface at the grain
boundary of the alloy (blue arrow in Fig. 16a).
In this study, however, there is no oxide ridge above the grain boundaries of the
alloy as observed in Fig. 10 and as drawn in Fig. 16b. Then, there is more metallic
Cr consumed than that contained in the overlying oxide. In other words, the local recession of the metal/oxide interface is more important than what is needed for the formation of the overlying oxide. Consequently, the metal grain boundary has to be a local vacancy sink for the vacancies that are injected by the oxidation of Cr of sur-rounding grains.
This localized vacancy annihilation generates the inward recession of the metal/ oxide interface, towards the alloy. The combination of a localized thicker oxide scale and an excessive local recession of the metal/oxide interface simply results from the combination of a high density of diffusion short circuits in the oxide and a
prefer-ential annihilation of alloy vacancies at the alloy grain boundary (Fig. 16b). The
excessive recession of the metal/oxide interface could also be explained by the pref-erential diffusion of Cr in the alloy grain boundary and the diffusion of Cr at the metal/oxide interface to sustain the growth of the oxide layer above the metal grain. For both explanations, either a flux of vacancies or a flux of Cr occurs between the
alloy grain boundary and the metal/oxide interface above the alloy grains (Fig. 16b).
The coalescence of a part of the alloy vacancies can occur simultaneously at the metal/oxide interface, and lead to the formation of pores in the oxide scale as
observed in Figs. 10 and 11.
Semiconducting Properties
The semiconducting behaviour of chromia grown on pure Cr, or by extension on
NiCr alloys [21], has been thoroughly studied by photoelectrochemistry [18–22]. At
very low oxygen partial pressure (about 10−14 atm, for temperature varying from
800 to 900 °C), chromia is only n-type. At higher oxygen partial pressure (superior
or equal to 10−12 atm, until 0.2 atm, for temperature varying from 800 to 900 °C),
chromia is both n-type (in the internal part) and p-type (in the external part). For
intermediate oxygen partial pressure (about 10−13 atm, for temperature varying from
800 to 900 °C), chromia is both n-type (in the internal part) and insulating (in the external part) [18, 22].
Assuming that the results of these studies [18, 22] can be extrapolated to a Ni-30
alloy oxidized at 700 °C, an n- and p-chromia scale is expected at 10−5 atm oxygen
partial pressure. However, in the present study, n-chromia scale is observed after 7 h of oxidation and the n and insulating chromia scale is observed after 50 h of oxida-tion. Such a discrepancy between the semiconducting properties that were expected and those that are observed can be explained by the following interpretations:
• It is not possible to extrapolate the conclusions drawn by Parsa et al. [18] and
Latu-Romain et al. [20] for Ni–30Cr alloy at a temperature of 700 °C;
• The presence of nickel in the metallic substrate could have a dopping effect on
the chromia scale thereby modifying its semiconducting properties. Indeed, the presence of nickel atoms instead of chromium in the chromia lattice could gen-erate a negative charge and foster the formation of point defects charged
posi-tively (oxygen vacancies V..
O , or chromium interstitials Cr
...
i ). These point defects
are associated with negative charge holders and therefore to n-type semiconduc-tion. A dopping effect resulting from the presence of nickel could favour n-type
semiconduction. Dopping effect of Ni has been observed by Nagai et al. [30] on
synthesized chromia but not on chromia growing over a metallic substrate. The
content of dopant can be very different for the synthesized Cr2O3 compared to
the growing one then direct comparison of the Nagai’s results to the ones in this study cannot be done.
• The change in semiconduction type observed between the 7-h and the 50-h
oxi-dation tests could be related to the important pO2 variation detected during the
experiments. In the early stages of the oxidation, pO2 drops down significantly to
a value close to 10−18 atm (Fig. 4). It can be assumed that the chromia layer then
adopts the defect (n-type) equilibrium at this low pO2 (10−18 atm). After
approxi-mately 3 h of oxidation, pO2 rises rapidly to about 10−5 atm. This should lead to
a n- and p-type chromia scale [18] if the time to reach the point defect at
ther-modynamic equilibrium is short. But, Holt [31] observed that the time needed to
reach the point defect at thermodynamic equilibrium amounts to several days for
sintered chromia samples in atmospheres switching from H2–H2O–Ar to H2–H2O
and to air at 1200 °C. Conversely, in other study at lower temperature on alloys
for interconnector application, a very rapid transition was reported [32]. In the
present study, supposing that the equilibration time is long in this impure argon
environment, the n-chromia scale formed after 7 h in varying pO2 (from 10−18 to
10−5 atm) could correspond to the defect equilibrium at low pO
2 (10−18 atm); and the n and insulating chromia scale formed after 50 h could correspond to a transi-tion towards the point defect at thermodynamic equilibrium (n and p chromia) which is not yet reached. If this interpretation is correct, a photoelectrochemistry characterization of samples oxidized during longer time periods would result in an n and p chromia.
It should be added that this study measurement has been done on three samples and is absolutely repeatable.
In any case, the main points defect associated with n-type chromia can be either
oxygen vacancies ( V..
O or chromium interstitials ( Cr
...
i , and those associated with
insu-lating chromia can be chromium vacancies and chromium interstitials ( V′′′
Cr and Cr
...
i ),
or oxygen vacancies and chromium vacancies ( V..
O and V
′′′
Conclusion
The study of the oxide layer formed during the oxidation of a Ni–30Cr alloy at
700 °C in impure Ar atmosphere (pO2 = 10−5 atm) highlighted the following points:
• An oxidation transient stage was determined using the local kp method. Its
dura-tion is about 2 to 3 h. It could result from pO2 variations due to the combustion
of impurities in the TGA system. Consequently, monitoring the oxygen partial pressure inside the thermogravimetric device is strongly recommended for
oxi-dation tests at low pO2 without buffer;
• The oxide layer is dense above the alloy grains, but above the alloy grain
bound-aries, it is porous, thicker and exhibits grooving. This local thickening of the oxide scale above the grain boundaries of the substrate can be interpreted as a local increase in fast diffusion paths within the oxide, which is consistent with the high porosity level observed at this location. The thicker but grooved oxide above the alloy grain boundary is explained by the outward flux of Cr from the metal grain boundary to the metal/oxide interface together with an opposite dif-fusion flux of vacancies that annihilate at the metal/oxide interface above the GB increasing its rate of recession;
• A layer of n-chromia is formed after 7 h of oxidation, and n- and insulating
chro-mia are formed after 50 h. These results are in disagreement with previous
stud-ies [18–22] but can be explained by a difference in oxidation temperature, a
dif-ference in alloy composition with nickel acting as a dopant, or by a long time to reach the point defect at thermodynamic equilibrium.
Acknowledgements The author warmly acknowledges Claudie Josse (Centre de microcaratérisation Rai-mond Castaing, Toulouse, France) for the preparation of TEM samples by FIB. The author also acknowl-edges Djar Oquab deeply (CIRIMAT, Toulouse, France) for his constructive and fruitful discussions.
Appendix: Buoyancy Correction Method
In a TGA system, even for a setup with symmetrical furnaces, the buoyancy effect resulting from the small volume difference between the studied sample and the ref-erence sample can have a major impact on the mass gain measured, if the overall mass variation is small.
If the oxidation kinetics is measured during a temperature dwell, a simple con-stant correction can be applied. During the cooling, at the end of the oxidation experiment, a weight gain or loss is observed due to the variation in atmosphere density. This weight difference measured between the end of the isothermal dwell and the end of the cooling must be removed from the total weight gain, in order to
correct the buoyancy effect. Figure 17 illustrates this correction method. It can be
applied if no spallation is observed during cooling.
If the oxidation kinetics is studied during transient temperature regimes, a more
References
1. A. Atkinson and R. I. Taylor, Transport in Nonstoichiometric Compounds 46, 1985 (285–295). 2. L. Bataillou, C. Desgranges, L. Martinelli and D. Monceau, Corrosion Science 2018. https ://doi.
org/10.1016/j.corsc i.2018.03.001.
3. C. Wagner, Zeitshrift für Physik 21, 1933 (25).
4. K. Taneichi, T. Narushima, Y. Iguchi and C. Ouchi, Materials transactions 47, 2006 (2540–2546).
5. A. C. S. Sabioni, J. N. V. Souza, V. Ji, F. Jomard, V. B. Trindade and J. F. Carneiro, Solid State
Ion-ics 276, 2015 (1–8).
6. S. C. Tsai, A. M. Huntz and C. Dolin, Materials Science and Engineering: A 212, 1996 (6–13). 7. A. M. Huntz, A. Reckmann, C. Haut, et al., Materials Science and Engineering: A 447, 2007
(266–276).
8. M. Kemdehoundja, J. F. Dinhut, J. L. Grosseau-Poussard and M. Jeannin, Materials Science and
Engineering: A 435, 2006 (666–671).
9. E. Schmucker, C. Petitjean, L. Martinelli, P.-J. Panteix, S. Ben Lagha and M. Vilasi, Corrosion
Sci-ence 111, 2016 (474–485).
10. K. Lillerud and P. Kofstad, Journal of the Electrochemical Society 127, 1980 (2397–2410). 11. D. Young and M. Cohen, Journal of the Electrochemical Society 124, 1977 (769–774). 12. D. Caplan and G. Sproule, Oxidation of Metals 9, 1975 (459–472).
13. E. Gulbransen and K. Andrew, Journal of the Electrochemical Society 104, 1957 (334–338). 14. P. Moulin, A. Huntz and P. Lacombe, Acta Metallurgica 28, 1980 (745–756).
15. G. Calvarin, R. Molins and A. M. Huntz, Oxidation of Metals 53, 2000 (25–48).
16. C. M. Cotell, G. J. Yurek, R. J. Hussey, D. F. Mitchell and M. J. Graham, Oxidation of Metals 34, 1990 (173–200).
17. W. Hagel and A. Seybolt, Journal of the Electrochemical Society 108, 1961 (1146–1152).
18. Y. Parsa, L. Latu-Romain, Y. Wouters, S. Mathieu, T. Perez and M. Vilasi, Corrosion Science 141, 2018 (46–52).
19. L. Latu-Romain, Y. Parsa, S. Mathieu, M. Vilasi, M. Ollivier, A. Galerie and Y. Wouters, Oxidation
of Metals 86, 2016 (497–509).
20. L. Latu-Romain, Y. Parsa, S. Mathieu, M. Vilasi, A. Galerie and Y. Wouters, Corrosion Science
126, 2017 (238–246).
21. L. Latu-Romain, S. Mathieu, M. Vilasi, G. Renou, S. Coindeau, A. Galerie and Y. Wouters,
Oxida-tion of Metals 88, (3), 2017 (481–493).
22. L. Latu-Romain, Y. Parsa, S. Mathieu, M. Vilasi and Y. Wouters, Oxidation of Metals 90, (3–4), 2018 (255–277). Δm/S (mg c m -²) temperature Raw weight gain data
Weight gain data after buoyancy correction 2.10-2 0 1.10-2 3.10-2 4.10-2 5.10-2 0 10 20 30 40 50 600 100 200 300 400 500 600 700 800 t (h)
Weight gain gap due to buoyancy
Te
mperature
(°C)
23. S. Hallström, M. Halvarsson, L. Höglund, T. Jonsson and J. Ågren, Solid State Ionics 240, 2013 (41–50).
24. J. Zurek, D. J. Young, E. Essuman, et al., Materials Science and Engineering: A 477, 2008 (259–270).
25. J. P. Petit, R. Boichot, A. Loucif, A. Srisrual and Y. Wouters, Oxidation of Metals 79, 2013 (249–359).
26. D. Monceau and B. Pieraggi, Oxidation of Metals 50, 1998 (477–493).
27. L. Latu-Romain, S. Mathieu, M. Vilasi, et al., Oxidation of Metals 88, 2017 (481–493).
28. S. Henry, J. Mougin, Y. Wouters, J.-P. Petit and A. Galerie, Materials at High Temperatures 17, (2), 2000 (231–234).
29. R. Peraldi, D. Monceau and B. Pieraggi, Oxidation of Metals 58, 2002 (249–273).
30. H. Nagai, S. Ishikawa, N. Amano and K. Shoji, Transactions of the Japan Institute of Metals 26, 1985 (753–762).
31. A. Holt and P. Kofstad, Solid State Ionics 69, 1994 (137–143).
32. S. Guillou, C. Desgranges and S. Chevalier, Oxidation of Metals 79, 2013 (507–516). 33. D. Monceau and D. Poquillon, Oxidation of Metals 61, 2004 (143–163).
34. A. Raffaitin, D. Monceau, E. Andrieu and F. Crabos, Acta Materialia 54, 2006 (4473–4487).
Affiliations
Léa Bataillou1 · Laure Martinelli1 · Clara Desgranges1,2 · Sophie Bosonnet1 ·
Kevin Ginestar1 · Frédéric Miserque1 · Yves Wouters4 · Laurence Latu‑Romain4 ·
Alessandro Pugliara5 · Arnaud Proietti5 · Daniel Monceau3
1 Den-Service de la Corrosion et du Comportement des matériaux dans leur Environnement
(SCCME), CEA, Université Paris-Saclay, 91191 Gif-Sur-Yvette, France
2 Safran-Tech, rue des jeunes bois, Châteaufort, CS80112, 78772 Magny Les Hameaux, France 3 CIRIMAT, Université de Toulouse, CNRS, INPT, UPS, Ensiacet, 4 allée Emile Monso,
BP44362, 33103 Toulouse Cedex 4, France
4 Université Grenoble Alpes, CNRS, SIMAP, 38000 Grenoble, France
5 Centre de Microcaractérisation Raimond Castaing, Université de Toulouse, 3 rue Caroline