Publisher’s version / Version de l'éditeur:
Vous avez des questions? Nous pouvons vous aider. Pour communiquer directement avec un auteur, consultez la
première page de la revue dans laquelle son article a été publié afin de trouver ses coordonnées. Si vous n’arrivez pas à les repérer, communiquez avec nous à PublicationsArchive-ArchivesPublications@nrc-cnrc.gc.ca.
Questions? Contact the NRC Publications Archive team at
PublicationsArchive-ArchivesPublications@nrc-cnrc.gc.ca. If you wish to email the authors directly, please see the first page of the publication for their contact information.
https://publications-cnrc.canada.ca/fra/droits
L’accès à ce site Web et l’utilisation de son contenu sont assujettis aux conditions présentées dans le site
LISEZ CES CONDITIONS ATTENTIVEMENT AVANT D’UTILISER CE SITE WEB.
Internal Report (National Research Council of Canada. Division of Building
Research), 1966-11-01
READ THESE TERMS AND CONDITIONS CAREFULLY BEFORE USING THIS WEBSITE.
https://nrc-publications.canada.ca/eng/copyright
NRC Publications Archive Record / Notice des Archives des publications du CNRC :
https://nrc-publications.canada.ca/eng/view/object/?id=665e4f23-c4df-47bd-87c4-379bc31b234b https://publications-cnrc.canada.ca/fra/voir/objet/?id=665e4f23-c4df-47bd-87c4-379bc31b234b
Archives des publications du CNRC
For the publisher’s version, please access the DOI link below./ Pour consulter la version de l’éditeur, utilisez le lien DOI ci-dessous.
https://doi.org/10.4224/20338302
Access and use of this website and the material on it are subject to the Terms and Conditions set forth at
Snow loads on sloped roofs: report on a pilot survey carried out in the
Ottawa area during the winter of 1965-66
NATIONAL RESEARCH COUNCIL CANADA
DIVISION OF BUILDING RESEARCH
SNOW LOADS ON SLOPED ROOFS Report on a Pilot Survey Carried Out in the Ottawa Ar ea During the Winter of 1965 -66
by
Halvor hセゥ「セ
ANALYZED
Internal Report No. 335 of the
Division of Building Research
OTTAWA November 1966
The Division of Building Research has carried out a survey of actual snow loads on roofs across Canada for a number of years with the broad objective to provide the basis for continued improvement of the design snow loads in the National Building Code.
Although a considerable refinement in design loads has already been achieved in the 1960 and 1965 Codes, one
of the areas that needs further study is that of snow loads on sloped roofs and particularly the relationship between roof slope and snow load.
This report describes a pilot survey carried out in and around Ottawa during the winter of 1965-66, dealing with sloped roofs only. The report contains a brief de-scription of slope reduction factor s used in other codes in addition to the results of the survey and a brief
dis-cussion on the release mechanism for snow sliding off roofs. The report was prepared by Halvor HpibSZ( Civil Engineer, Institute of Farm Buildings, Norwegian Agri-cultural College, Vollebekk., Norway, who was a guest worker in the Building Structures Section from 1 January 1966 to 31 May 1966.
Ottawa
November 1966
R. F. Legget Director
TABLE OF CONTENTS
GENERAL PURPOSE OF THE SURVEY PLAN OF THE SURVEY
REGULATIONS IN OTHER CODES SNOW SLIDE RELEASE MECHANISM RESULTS AND DISCUSSION OF RESULTS
Method of Measuring Snow Depth and Density
Calculation Methods Weather
Loads Plotted as Function of Slope Roofing Material
Exposure to Wind
Heat Loss and Solar Radiation Relationship Between Drift Loads
and Area Covered by the Drifts CONCLUSION AND SUGGESTIONS
FOR FURTHER STUDIES ACKNOWLEDGEMENTS REFERENCES Page 2 2 3 4 7 7 7 8
9
9
10 10 11 11 13 14by
Snow loads on roofs are an important factor that must be taken into account in building design in many countries,
especially in northern countries with frequent snow storms and heavy snow accumulation during the winter. The building codes of most of these countries contain standards for snow loads. Many of these standards are, however. rather in-accurate and not in keeping with the accuracy of other factors in structural design.
Because of the variability in the meteorological factors and the many pos sibilities in building shape, in landscape and sheltering effects, there is a great need for snow-load
measurements to be taken on roofs under different conditions before code standards can be reasonably improved.
In Canada, a wide-ranging research project on snow loads on roofs has been carried out for several years, and the design rules for snow loads on roofs in the National
Building Code (l) are relatively advanced. It is still desirable, however, to continue the snow load research in order to get a better approach to proper design values for snow loads on differ ent roofs. One of the areas that needs further study is that of snow loads on sloped roofs and particularly the relationship between roof slope and snow load.
This report describes a pilot survey carried out
in and around Ottawa during the winter of 1965-66 dealing with sloped roofs only. This survey must be considered strictly as a pilot survey because it covers one year only. since the author, a guest worker in the Division of Building Research, had only one winter available for his study. The report contains a brief description of slope reduction factors used in other codes (Section IV) in addition to the results of the survey and a brief discussion on the release mechanism for snow sliding off roofs (Section V).
- 2
I I GENERAL PURPOSE OF THE SURVEY
A main aim of this survey was to improve, if possible, the pr esent National Building Code treatment of snow-Load reductions on sloped roofs by measuring actual snow loads on a range of roofs covering different slopes, roofing materials and exposur es to wind.
A further intention was to determine the best possible way of carrying out the snow-load measurements on roofs and to find an economical and safe way for providing additional data on snow loads on sloped roofs for building code purposes.
II I PLAN OF THE SURVEY
The survey was based on earlier experiences with snow-load measurements made by the Division of Building Research. The survey was to be carried out mainly in the Ottawa area, with supplementary studies to be made in areas of different climates, particularly the Saskatoon area and the Maritimes. Because of the snow conditions this winter, however, snow-load measurements were carried out only in the Ottawa area.
Approximately 50 buildings were chosen in the Ottawa area for the survey. The snow depths and density were to be measured both on the roofs and on the ground after every heavy snowfall, the measurements to be carried out within a period of a maximum of 3 days. The buildings chosen were mainly un-insulated farm buildings. Seven of the farm buildings had
mansard (gambrel) roofs. The rest had gable roofs or flat roofs. Sorn e of the farm buildings wer e, to a certain extent, heated by animals. Eight of the buildings chosen were insulated, heated dwelling houses, and these were included in the survey late in January, after the first snowfall where measurements were taken.
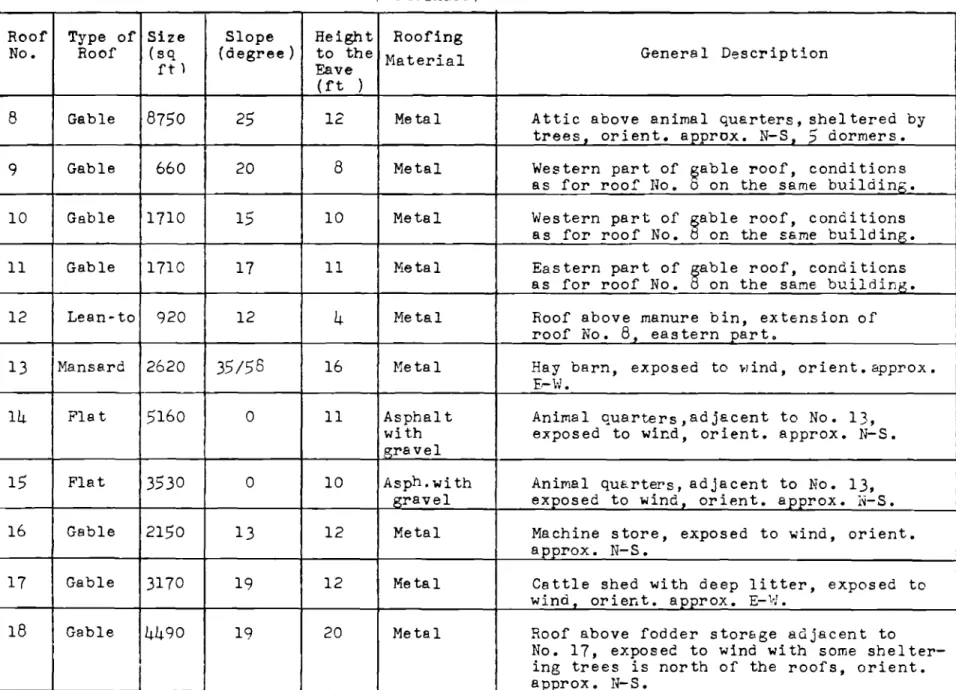
The roofs had different slopes and roofing material and were differently exposed to the wind and sun. In Table I the buildings are listed with a short description of the roofs with regard to their type, size, slope, roofing material, orientation and sheltering conditions.
Each full gable roof and each full mansard roof was normally given a number. Exceptions are made for roofs where there are different materials on the two roof sides (Nos. 4 a- b, sa-b, 22 a- b and 41 a- b); for roofs where there are different slopes on the two roof sides (Nos. 8, 9, 10, 11, 21 a- b, 26 a- b, 28 a- c, 62 a- b, 64a- b and 66 a-b); and for lean-to roofs (Nos. 12, 40 c, 44b and 4S b).
A frequency diagram for the roofs is shown in Figure 1 with the slope as variable, the slopes being taken in S-deg steps and the number of roofs being grouped individually for metal, asphalt and wood shingle roofings.
The average size of the roofs was 1760 sq ft. Average
height to the eave of the buildings included was approximately 12i ft.
IV REGULATIONS IN OTHER CODES
The regulations for snow loads on sloped roofs contained in a number of codes of countries where snow load is an important factor in building design ar e reviewed in the following notes.
In the codes reviewed, the procedure in defining the design load on sloped roofs is not uniform. It is for this reason that a "slope reduction factor" (K), which in some codes is given directly and in the rest of the codes has to be derived, was used. The design snow load on sloped roofs (Sa) could then be found as
Sa
=
K. S where S is the design load for a flat roof, and K is a function of the slope. Sa is given per unit of area of the horizontalroof projection.
Many of the regulations have a slope r eduction factor of one up to a certain slope, usually 20 to 30 deg. The factor then decreases linearly to zero at a fairly steep slope, usually SO to 70 deg. This is shown in Figur e 2 wher e the slope -r eduction factor is given from the codes of Austria, Canada, France, Germany, Great Britain, Norway, Rumania, Sweden, United States of America and the U. S. S. R.
Figure 3 shows stepwise reduction factors {from the codes in Israel and Japan}, and Figure 4the slope-reduction factor from the codes in Czechoslovakia and Italy. Figure S indicates the slope reduction factor from the codes in Portugal and
Switzerland, where the reduction for slope starts already at 0° slope angle.
4
No extensive research work on snow-load reduction on sloped roofs s e erns to have been done up to this time. The slope-reduction factors in different codes must therefore be r egar ded principally as estimates, based on experience.
Although the conditions for snow accumulation and snow sliding off roofs may vary from one country to another, the degr ee of variation in the slope-reduction factors seems to be questionable.
V SNOW SLIDE RELEASE MECHANISM
The basic reason for the obvious fact that, in many climates, sloped roofs accumulate smaller snow loads than flat (i. e. horizontal) roofs is that on sloped roofs the snow cover is often released in the form of a slide or avalanche.
Snow slides usually from a roof when the bond between the snow cover and the roof surface is broken. This problem can be tr eated as a special case of the general avalanche release problem. The discussion in this section is mainly based on a study of the literature on snow avalanches, which relates the release mechanism to basic concepts of mechanics and certain transformations of the snow (2, 3, 4).
Deposited snow is a viscous, plastic material, consisting of ice grains and pores filled with air. The mechanics for
materials with both cohesion and internal friction are therefore applicable to deposited snow, although possibly other mechanical models might be suitably applied in certain calculations. Although both the cohesion and the internal friction, from which the str ength properties of the snow cover could be defined are not fully known,
s orn e basic figures can still be outlined.
The release of an avalanche depends on many factors. Figure 6 shows the forces acting upon an arbitrarily chosen part of a snow cover resting on a sloped surface. These forces are in balance before the release. The main problem concerns the determination of the shear str ength of the weakest layer (stratum) in the snow cover. The tensile force at the upper end surface, a compression force at the lower end surface and shear forces at the lateral surfaces of the snow mass considered are, however, also important to the stability.
Shear Strength
The shear strength, shown in Figure 6, consists of a cohesion part and a friction part. The equation for the shear strength could be written as follows (measured on unit areas):
where
=
C+
a
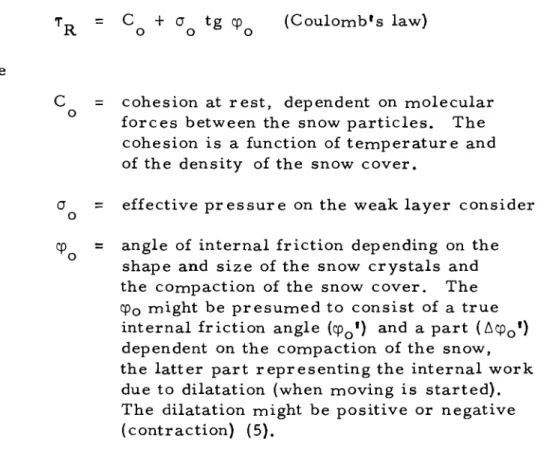
tg cP o 0 0 (Coulomb's law) C oa
o= cohesion at r est, dependent on molecular forces between the snow particles. The
cohesion is a function of temperatur e and of the density of the snow cover.
=
effective pressure on the weak layer considered.= angle of internal friction depending on the shape and size of the snow crystals and the compaction of the snow cover. The CPo might be presumed to consist of a true
internal friction angle (cpo I) and a part (6cpo I) dependent on the compaction of the snow, the latter part representing the internal work due to dilatation (when moving is started). The dilatation might be positive or negative (contraction) (5).
The general equation TR
=
C+
a
tg cp could probably be applied to most types of snow. There are, however,differences between avalanche release behaviour in coherent and in cohesionles s snow.
(a) Coherent Snow
Figures 7 and 8 give examples of release mechanism In two typical snow covers. In the two cases, only the shear strength of a presumed weak layer is taken into consideration, with no regard to possible tension, compression or lateral forces.
Figure 7 shows snow with low coherence. The sloped snow cover is stable until the shear resistance TR
=
C+
a
tg cpis exceeded by the releasing force T
=
O/A of Hie snow mass cone er n e d, This would occur either by an additional load which increases the force 0, or by a decrease of cohesion C, due to metamorphosis or melting. Figure 8 shows snow with high coherence.- 6
(b) Cohesionles s Snow
New snow has a high natural slope angle due to interlacing of the branches of the snow crystals. As metamorphosis takes place, the fine branches of the crystals disappear, the crystals become rounded and the natural slope angle decreases. The natural slope angle may also decrease when the snow grains become rounded due to melting.
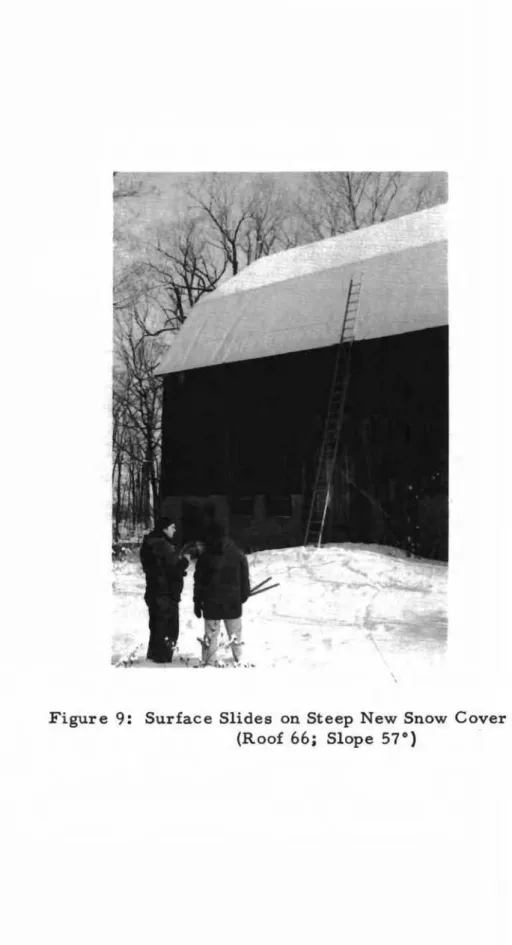
The surface of a snow cover consists often of a layer of cohesionless snow. Although new snow may have a natural slope angle of 60° or even higher, surface slides will occur when the natural slope angle through metamorphosis becomes lower than the slope of the snow cover (see Figure 9). It can also be seen that new snow can cling to very steep roofs (roof No. 6 b, a
=
57°).The thickness of the snow cover in relation to the area considered is relatively high on roofs compared to ground slopes, especially when the snow loads ar e heavy. The tension, COm-pr es sion or lateral forces, ther efor e, will be more significant for snow slides from roofs than they are in regular avalanches.
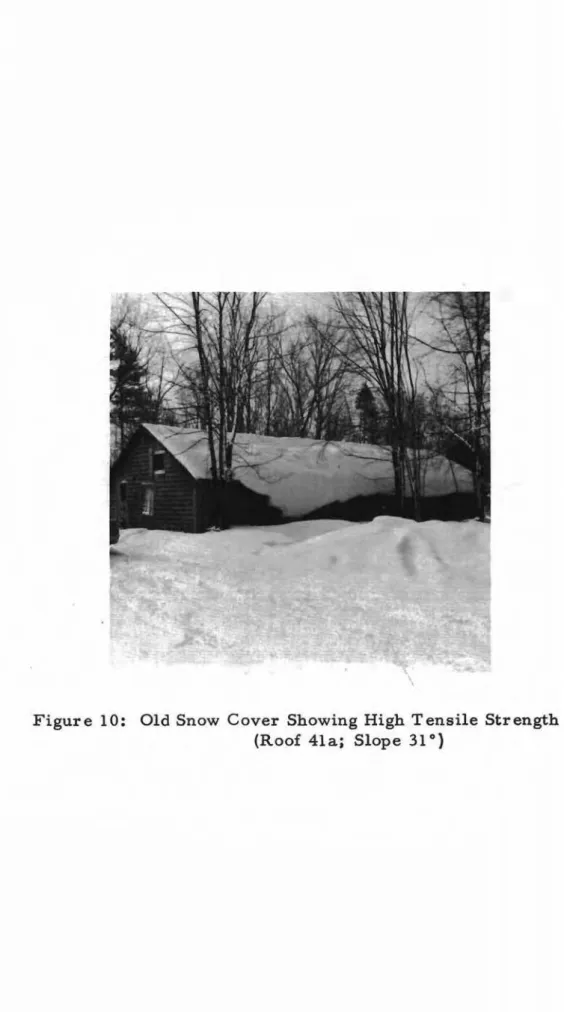
The pressure along the lower edge of the roof snow can often be neglected. Only when the sliding is pr evented by ice built up in the gutter, etc., need this force be taken into account. The lateral forces can also be neglected if the sliding is not prevented by obstacles such as chimneys, ventilator s , etc. The tensile for ce at the ridge, however, often plays an important part in pr eventing snow from sliding off the roofs. This is well known from experience in areas wher e removing of the roof snow load is fr equently done in winters with exceptionally high snow loads. The photograph in Figur e 10 demonstrates that snow covers can develop a fairly high tensile strength.
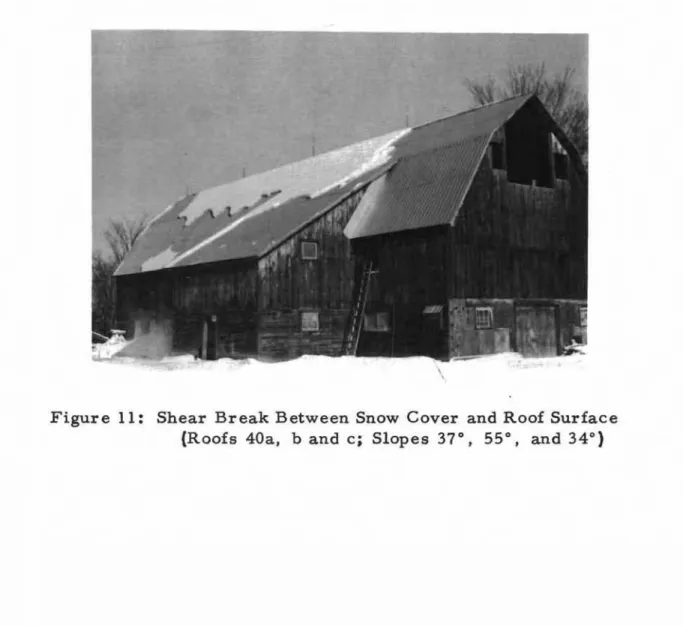
Insofar as snow slides from roofs ar e concerned, the most COmmon break occurs as a shear break between the snow cover and the roof surface. The photograph in Figure 11 shows a typical break in bond between the snow cover and the roof surface. The roofing material was aluminum sheeting (roof No. 40, photograph taken on the same day as that in Figure 9). On a rougher roof surface, however, it is possible that a shear br eak would have taken place inside the snow cover, either over part of or the entire roof area.
VI RESU LTS - DISCUSSION OF THE RESULTS (a) Method of Measuring Snow Depth and Density
The snow depth was measured with a yardstick both on the roofs and on the ground after the four heavy snowfalls of the season. A sufficient number of depth measurements on the roofs were taken so that it was possible to draw lines of equal snow depths as shown, for example, for roof No. 15 in Figure 12. The snow depths were measured vertically downwards. On same of the steepest roofs it was more convenient to measure the depths at right angles to the roof surface, but these measurements were afterwards transformed into vertical depths. Where the snow layer on the roofs was even or very thin the snow depths were only estimated; on the ground they were measured at several locations around the building, usually ten places at every farm. On farms where the drifting had been heavy the ground snow depths were not measured.
Where the snow loads were significant the snow density was m ea sur ed both on the roofs and on the ground. The density measurements were taken with the Norwegian type of sampler described in Figure 13. After the heaviest snowfall (30 January) the measurements took four days instead of three days as planned. (b) Calculation Methods
For each roof the observations were plotted on a sketch of the horizontal roof projection, made up to a scale of 1 : 120 for the small and medium sized roofs and to a scale of 1 : 240 for the lar gest roofs. Lines of equal depths were drawn on the sketches.
The average depth of the snow cover on the roofs was calculated from the total snow volume d i vi d e d by the projection of the roof area. In calculating average depths bare rims at the roof edges were omitted. For each roof, only the results of the day with the maximum load condition were used. Figure 14 shows a sketch of snow load distribution for one individual roof, with a table giving the load data for the roof.
- 8
The average ground depth was obtained for each farm. In SOme cases where ground-depth measurements were not taken becaus e of too much drifting, the average ground depth available from the other farm s for that particular snowfall was us e d, The ground loads were based on the average depths and the density measurements taken at that farm; where density measurements were not available, the average density taken on that indiv idual day was used. Relatively lar ge variations in the rn e a su.r ed ground loads were found - this is in line with previous experience and should be kept in mind when considering certain anomalies in the roof-to-ground-load ratios.
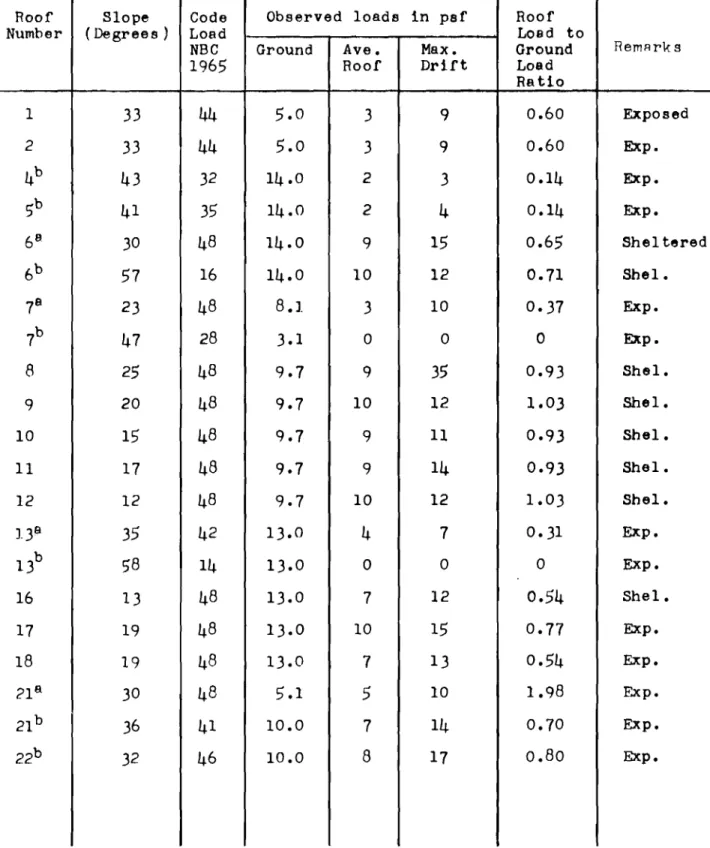
The observed roof and ground loads are given in Table I I (metal roofing), Table II I (bituminous roofing) and Table IV (wood shingles). Only the maximum average recorded for the winter is shown, together with the maximum drift load and the average ground load on the same day. In the tables, every mansard roof is included as two roofs, one for each slope. The design snow loads according to the National Building Code of Canada, 1965 are calculated for each slope, based on a basic snow load coefficient
=
0.8. The coefficient O. 6 for exposed roofs was not used, in order to provide a uniform basis for comparison (a 60 psf ground load was used throughout and only the slope r eduction factor varied). In Tables I I, I I I and IV the relation between average roof load and ground load is calculated for every roof. In section (h) the relationship between drift loads and areas covered by various drift-load levels is discussed. The calculations were made only for exposed roofs. They were carried out on the basis of drift depths in relation to average depths on the roofs.(c) Weather
The winter of 1965 -66 was rather unusual. Although the total fr esh snowfall was almost normal (slightly above normal at Uplands Airport) several midwinter thaws resulted in rather low ground loads and also in rather low roof loads. The maximum snow load on the roofs occurred for most roofs after the snow storm of 30 January. This was a very heavy snowfall resulting in 19.1 in. of fresh snow in a fairly short period. This snowfall was reported to be one of the heaviest 24-hr snowfall on record. The recorded accumulated snowfall after this storm was 71. 8 in. for Uplands Airport and 54. 1 in. at the Experimental Farm. For the whole winter the accumulated fresh snowfall was 93.9 in. at the Airport and 71. 5 in. at the
Experimental Farm. The normal for the Airport is 86 in. and for the Experimental Farm, 77 in. Insofar as wind is concerned indications were that the winter winds during and after snow storms were on the light side and that drifting was below normal. (d) Loads Plotted as Function of Slope
In Figures 15 to 19 the roof-to-ground-load ratio (in per cent of the ground load) has been plotted against the slope angle for exposed and sheltered metal, asphalt and wood roofs. It will be seen that the effect of increasing slope is, as would be expected, to reduce the load, but that the results fall into a very wide band in spite of the fact that the roofs have been categorized as mentioned above. Also shown for comparison are two lines giving the application of the K factor to 100 per cent ground load as well as the NBC design roof load. In the next sections various influences will be discussed.
(e) Roofing Material
As mentioned before, the slope reduction factors, K, for various countries including Canada have been shown in Figure 2. The slope reduction formula used in the National
Building Code of Canada can be written more simply as C :: 0.8 K where K
=
70 - a (valid only for 30· :5: a :5: 70°). In Figures 15 to 19 two lines4Rave been included, showing the K factor applied to the measured ground load (l00 per cent) and the NBC design roof load for comparison.Differences in snow deposition and accumulation were found with the different roofing materials present. It is perhaps surprising that sheltered metal roofs appear to have higher loads than sheltered asphalt roofs (but it should be remembered that there are differences in the ground load used in calculating the roof-to-ground-load ratio). Since, however, the weather and snow conditions were such that deposition of snow on the roofs was mainly from a single snowfall, without accumulation over a longer period, the differ ences between the differ ent materials may not be as significant as would be the case in a winter
without thaws. It should also be remembered that in each group ther ewer e Iar ge variations from one roof surface to another; SOme roofs in the metal group, for instance, were rusted while others were not; some roofs were very slippery, particularly the aluminum roofs, others were not.
10
It will be seen from Figures 15 to 19 that, because of the limited snowfall during the winter and the other special conditions, it is difficult to point out clear differ ences between different roofing materials although s orn e differences have been observed in the sliding off of the snow.
Because of the time involved in observing all roofs in the survey it often happened that at the time the next survey was taken all the snow from the first (earlier) snow storm had slid off or melted away. Any clear conclusions from this w int e r ts survey are, therefore, difficult to draw with
r egar d to the effect of the roofing material.
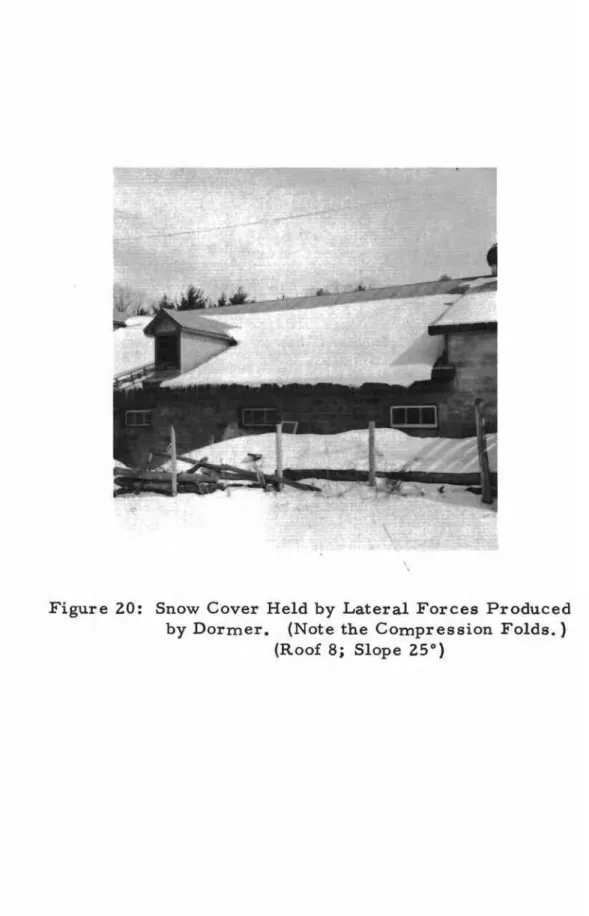
It can be seen in one photograph that the layer of snow on a metal roof had slipped down 6 to 8 ft and that the snow was held by the effect of lateral forces, produced by a dormer (Figure 20). Observations on the following day showed that all the snow had slid off.
(f) Exposur e to Wind
Some difficulties were found in defining roofs as
IIs h e lt e r e dll or lIexposedll. Some roofs that were called IIs h e l t e r e dJ ' in Table I were not sheltered on all sides and happened to be exposed during the main snow storm of the
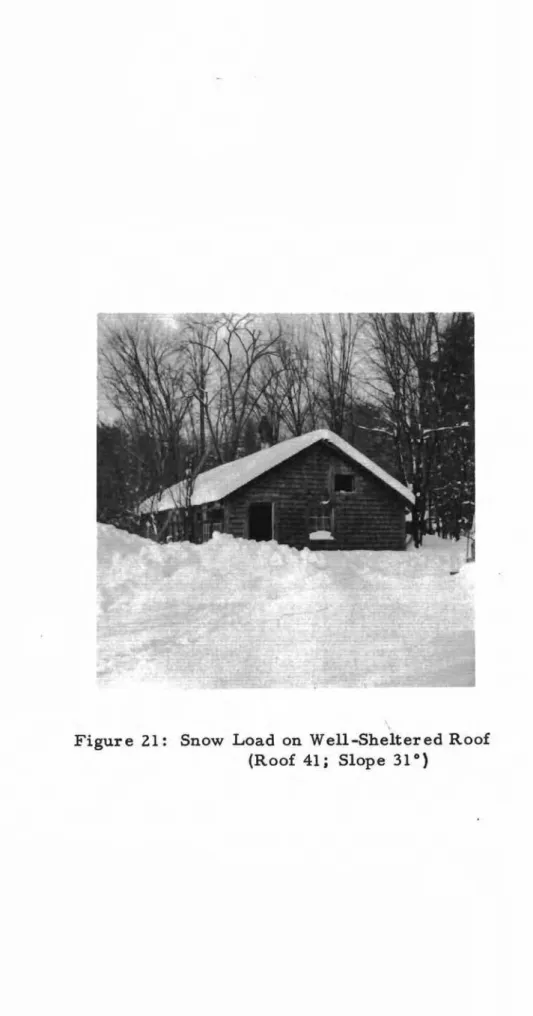
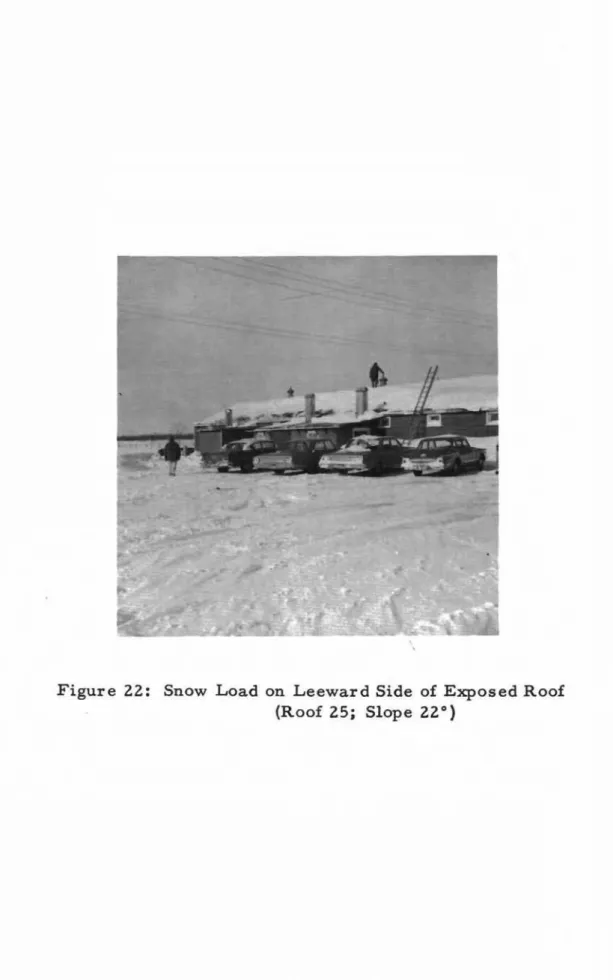
1965 -66 winter season, becaus e of an unusual wind direction. Not many heavy drifts wer e found. Some of the drifts obs erved wer e str ongly influenced by the irr egular shape of the roofs. It should also be noted that no distinction was made between large and small roofs. The photographs in Figures 21 and 22 show the load on a well-sheltered roof and on an exposed roof, from which the difference will be noticeable.
(g) Heat Loss and Solar Radiation
It is appar ent from the results that heat los s and solar radiation caused melting on many of the roofs. This was more noticeable for the dwelling houses, but after only one winter's observations it is difficult to make any definite statements about the effect of heat loss. This factor should be reviewed after several winters' observations are available. At that time it will be necessary to review how the temperature influences the cohesion and the friction coefficient between the roof surfac es and the snow cover.
Because the 1965 -66 snow accumulations were so low the effects of heat loss could not be fully observed. A discussion of this aspect of the problem is contained in the conclusion.
(h) Relationship Between Drift Loads and Area Covered by the Drifts In earlier snow load reports the average and the maximum load have been discussed. In the structural analysis of a building it is important to know where the maximum loads occur and how large an area the heavy loads are covering. For each load level, between the maximum drift and the average load, there will be a corresponding area that will be covered by this particular load. This is important to know from an engineering point of view.
In order to approach this problem properly, the attempt was made to calculate the average load over the worst 80, 60, 40, 20 and 5 per cent of the area in relation to the average roof load. This is shown in Figure 23 where, for any percentage of roof area considered, one may read the maximum local load to average load ratio.
The relationship was determined from snow depths and not from loads. In the pr esent case only the lar ger roofs wer e studied, that is, roofs exceeding approximately 1500 sq ft. The author believes that the relationship of snow load as a function of area shown in Figure 23, need only be examined for windy areas and for exposed roofs as sheltered roofs would usually experience approximately uniform loads.
VI I CONCLUSION AND SUGGESTIONS FOR FURTHER STUDIES It has already been mentioned that the information collected and presented in this report is based on one winter only. Further-more, the winter was somewhat unusual, and the conclusions drawn from this report must therefore be rather limited. As stated at the beginning of the report this survey must be considered
essentially as a pilot survey.
The main conclusion of the present survey is a confirmation of the earlier indications that the snow loads on sloped roofs are generally quite low (6). This is mainly the result of the fact that, even on fairly moderate slopes, snow slides are released quite easily. The mechanism of snow slides is such that the heavier the load, the greater the chance of the 32° isotherm moving up from the roof insulation into the surface of contact between roof and snow and thus releasing the snow in the form of a slide.
12
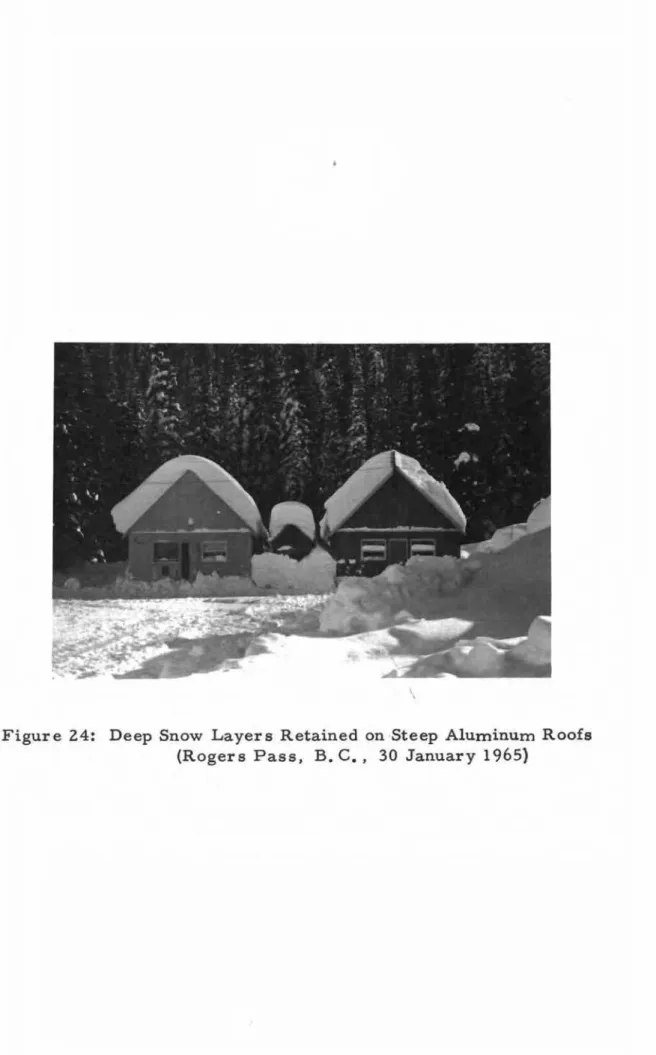
It should be remember ed that on completely unheated buildings, deep snow layers can be retained even on very steep slopes and on very slippery roofing (as shown, for example, in the photograph of Figure 24). Consequently, the familiar question arises whether heat loss should be considered as a valid reason for r educing the snow loads. In the past, this question has been answered in the negative. It is evident, however, that on sloped roofs the effect of heat loss is far more significant than on flat roofs. Furthermore, it s e ern s that in many cases the probability of a building remaining unheated for a whole winter is so low that in areas where the maximum load is produced by an accumulation of snow load over a long period, the heat los s might well be taken into account. In fact, the present slope reduction already r epr es ents in part a tacit and rather vague recognition of the beneficial effect of heat los s ,
With regard to the application of the results of this pilot survey for building code purposes, it is too early to state at the rn orn erit if and in what form an improvement of the 11K"
factor used as a slope reduction can be made. There is, however, one addition to the National Building Code that could be made now. In view of the fact that on SOme roofs, special devices are sometimes used to prevent the snow from sliding, a statement should be included in the Code to the effect that if snow sliding is prevented by special devices on a sloped roof this should be accounted for in its design. Further observations on sloped roofs are desirable to establish the loads during winter s with heavy snow loads and in differ ent climate areas of Canada.
The regular snow load survey of the Division of Building Research has shown that there are considerable differences between the average loads and the maximum loads on roofs, depending on the shelter of the buildings and a number of other factors. It is, however, difficult to find sufficient buildings within a reasonable distance from the National Research Council in Ottawa to carry out the snow studies on sloped roofs only in the Ottawa area. Furthermore, the climate is not reliable enough during the winter as far as snow accumulation is concerned. The snow load measure-ments on sloped roofs, therefore, should be extended to other areas where one could rely more upon snow accumulations on the roofs over a longer winter period.
The proposed further studies should be carried out
with the same measurements to be taken as during this winter's survey. The snow-load measurements on the roofs should, however, be taken only when the loads ar e expected to be at their highest during the winter. The observations should be
carried out with depth measurements to such detail that lines of equal snow depths as shown in Figures 12 and 14 can be drawn. The observations should be plotted on the site, using a prepared sketch of the roofs in a scale approximately 1:100, possibly 1 :200 for the largest roofs. In order to make it faster to plot the
obs ervations and interpolate for equal depth lines to be drawn on the site, the sketches should be made up with grid lines. The calculations of average and maximum loads should be carried out soon after the observations are taken.
It is suggested that the additional observations on sloped roofs should be made a part of the Building Structures Section's regular survey of snow loads on roofs.
ACKNOWLEDGEMENTS
The author wishes to expr ess his gratitude, especially to Dr. R. F. Legget, Director of the Division of Building Research for the permission to spend a period of study as a guest worker at the National Research Council. The
author's appreciation must also be recorded for the facilities provided by the Division for his work on snow load on roofs.
Mr. W. R. Schriever, Head, Building Structur es Section gave invaluable assistance in the preparation of this report. Discussions with Mr. D. A. Lutes were especially useful, To these and other members of the Section and the Division too numerous to name, warm thanks are due for help,
- 14
-REFERENCES
1. National Building Code of C:mada, 1965. Issued by the Associate Committee on the National Building Code, National Research Council, Ottawa, Canada.
(NRC 8305)
2. Roch, Andre. Mechanism of Avalanche Release.
Snow, Ice and Permafrost Research Establishment, Translation URセ Wilmette, Il.Iinoi s , April 1956.
3. Ram s Ii , Gunnar. Sn)6 og Sn¢'skred (Snow and Snow Avalanches). Landbruksdepartemente1 s s m a s kr ift e r No. 96,
osi», 1951.
4. Seligman, G. Snow Structure and Ski Fields, Belgium, 1962.
(This book includes many other references.)
5. Bygg. Vol.
1.
AB Bygmas'.arens Forlag, Stockholm, 1959.6. Snow Loads on Roofs. (Reports of DBR snow load survey is sued annually as Internal Reports of the Division. )
Report 106 - Sept. 1956; 134 - 1956-57; 163 - 1957-58;
184 - 1958-59; 204 - 1959-60; 228 - 1960-61;
260 - 1961 -62; 279 - 1962 -63; 324 - 1963 -64.
Roof
Type of Size
Slope
Heigh t
Roofing
No.
Roof
( sq(degree) to the
Material
General Description
ft
)Eave
(ft
)1
Gable
1310
33
10
Metal
Machine store, exposed to wind, orient.
a ppr-ox , N-S,
step
Rセft
beloH adjacent
roof No.2 •
.
2
G8ble
830
33
ャRセMetal
Machine store with exposure and orient.
equal to roof No. 1.
3
Gable
1490
40
16
Wood
Hay barn, exposed to wind,
orient.
Sh Lng Le
approx. E-\'J, adjacent to rna n s ar-d roof
at righ tangle.
4
a
Gable
960
43
14
Wood
Attic space above animal quarters, only
Shin9:1e
western part of a gable roof, exposed to
wind, orient. approx. N-S.
4
b
Gable
960
43
14-
Metal
Attic space above animal quarters,
eastern part of roof No.4, step 1 ft
below adjacent roof No.5.
Sa
Gable
1010
41
I
10
Wood
Conditions as for adjacent roof No. 4 a•
':), i :-:".le
-b
Gable
840
41
12
Metal
Conditions as for adjacent roof No. 4 b•
セ
6
Hansard
2310
30/S7
23
Metal
Hay barn,
sheltered by trees,
orient.
approx. N-S.
7
Mansard14060
23/47
10
Metal
Machine store and uninsulated working
room for gardening, exposed to wind,
orient. appro.x.
E-\\; •TABLE I
(Continued) Roof Type of Size Slope Height RoofingNo. Roof ( sq (degree) to the Material General Description
ft) Eave
(ft )
8 Gable 8750 25
12
Metal Attic above animal quarters, sheltered bytrees. orient. approx. N-S.
5
dormers.9 Gable 660 20 8 Metal Western part of セ。「ャ・ roof, conditions
as for roof No. on the same 「オゥャ、ゥョセN
10 Gable 1710 15 10 Metal Western part of セ。「ャ・ roof, conditions
as for roof No. on the same building.
11 Gable 1710 17 11 Metal Eastern part of gable roof, conditions
as for roof No. on the same building.
12 Lean-to 920 12 4 Metal Roof above manure bin, extension of
roof No. 8. eastern part.
13 Mansard 2620 35/58 16 Metal Hay barn, exposed to vrind , orient.approx.
E-|セjN
14 Fla t 5160 0 11 Asphalt Animal quarters,adjacent to No. 13,
wi th exposed to wind, orient. approx. N-S. gravel
15 Flat 3530 0 10 Asph.wi th Animal quarters, adjacent to No. 13,
.'!:ravel exposed to wind. orient. approx. セMs •
16 Gable 2150 13 12 Metal Machine store, exposed to wind, orient.
approx. N-S.
17 Gable 3170 19 12 Metal Cattle shed with deep litter, exposed to
Wind. orient. aoprox. E-|セA •
18 Gable 4490 19 20 Metal Roof above fodder storage adjacent to
No. 17, exposed to wind with some shelter-ing trees is north of the roofs, orient.
•
approx • N-S.Roof
Type of
Size
Slope
Heigh t
Roofing
No.
Roof
(sq
(degree)
to the
Material
General Description
ft
)Eave
(ft
)19
Gable
1720
34
QRセAsphalt
Store,
exposed area,
some shel tering
Shingle
effects from other buildings, orient.
a
ppr-ox , E-W.
20
Gable
2800
42
15
Asphalt
Store, near No.
19,
exposed to wind,
Shingle
orient. approx. N-S.
21
8Gable
920
30
XセBetal
Northern slope of a
two-sloped
storage
building, exposed to wind, orient.
approx.
E-W.21
b
Gable
460
36
12
Metal
Southern slope of the saMe building
No.
21
8 •same conditions.
22
a
Gable
1600
23
10
Asphalt
Northern slope of a
two-sloped
storage
Shingle
building,
exposed to wind,
orient.
approx.
E-W.22
b
Gable
580
32
13
Metal
Southern slope of the same building,
No.
22
a • same conditions.
23
Gable
2100
28
11
Asphal t
Attic above heated
storage area exposed to
Shingle
wind. orient. approx. B-W.
24-
Gable
1570
30
10
Asphalt
Attic above heated
stor2ge area eXfosed to
Shingle
wind.
orient. approx. E-W.
25
Gable
4130
22
9
Asphalt
Attic above animal qua r- ters, exposed to
Shinf;le
wiDd.
orient. approx.
E-\"r.26
a
Gable
2160
22
11
Asphalt
Roof above anima
1
quar-ter-s, ad jacen
tto
Shingle
NO!O.25
and
27,
exposed to wind,
orient.
....
セartセ I (Continued)
I
Roof
I
Type ofI
Size Slope IHeight Roofing No. Roof (sq (degree) Ito th e Materialft ) !Eave (ft )
RVセ
Lean-to II
I
I
2030I
9I
Xセ I Asphal t!
I
I II
ShingleI
II
Asph a I t 27I
Gable1
24 0 0 I 40I
I 15 I Shingle.j
I 2S aI
I GableI
990I
35 , 14 Met9.1 General DescriptionRoof adjacenteto nセN 25 and 27, conditions.
as for No. 26 • ,
Hay store, adjacent to nッセ 26 a and
26
bexposed to wind. orient. approx.
E-W •
2S b
i
GableI
I
1660 30I
12I
I
MetalI
(old) I 29I
Gable 1549 0
i
IS
T
;
GableI
440I
30
, I 30 2Scl
<1 : GalI - :
27 , j 1eI
1980I
-+
ii
2100I
30/60 !!
I
I 10 j Xセ,
I
lS,
r
I Me tal (new) スセ・ ta1!
Metal,
TI
Metal II
Netsl - - " MetalI
Conditions as for roof No. 2Sb•
Attic over animal quarters, partly sheltered, orient.approx.
E-W.
Roof over store room, partly sheltered, orient. approx.
N-S.
Roof over manure store room, exposed to wind, orient. approx.
E-W.
\
I
I
I
!
Hay barn under the same conditicns as
_ _ _ _ .J__MNeNYセN
-
1 30/60I
16I
Metal 24I
i iGt.l
j 34 II
2180 I I rJIens[:rd I セMi 35I
GcbleI
4040
IRoof
Type
Size
Slope
Height
Roofing
No.
of
(sq
(degree)
to the
General Description
Roof
ft
)EBve
Material
(ft
)36
Gable
4040
24
QPセMetal
Attic above animal quarters, exposed
to wind. orient. appr-ox , N-S.
37
Gable
3100
33
12
Metal
Attic above animal quarters, heavy heat
loss through the roof, exposed to wind,
orient. approx. N-S.
38
Gable
1650
35
11
Asphalt
Attic above machine shop, partly
Shingle
sheltered, orient. approx. E-W.
39
Mansard
1890
29/52
18
Mets.l
Hey barn, sheltered by trees,
orientation approx. N-S.
40
Mansard
3500
37/55
QWセNetal
Hay barn above animal quartern, partly
sheltered by trees, orient. approx. N-S.
40
c
Lean- to
670
34
14
Metal
Cold attic adjacent to No.
40,
partly
sheltered to wind, orient. approx. N-S.
41
a
Gable
700
31
VセMetal
Northern part of roof
No.
41,
shel tered
by h
izh trees. orient. appr-ox , E-W.
41
bGable
700
31
7
Wood
Southern
ー。セエof roof
41,
conditions
Shingle
as for roof
41
a •
42
Gable
1460
45
18
Wood
Hey barn, adjacent to roof
43,
partly
Shingle
sheltered. orient. approx. E-W.
43
Geble
209045
16
Wood
Hay barn, adjacent to roof
42,
orient.
Shingle
approx. N-S.
44
a
Gable
2030
40
RPセMetal
Hay barn, partly sheltered by trees,
orient. approx. N-S.
44
b
Lean- to
550
26
9
fvle ta
1
Attic above animal room placed at the
TABLE I (Continued) I
Roo Type of Size Slope Height Roofing
No.
Roof (sq (degree) to the Material General Descriptionft ) Ed.ve
(ft )
45 a Gable 1140 38 Xセ Metal Machine store, she1 tered, orient.
approx. eMセBャN
45b Lean-to 320 15 6 Metal Lean-to at the east gable of the
machine store.
b.6 Gable 3630 18 11 Metal Cold stor2ge aree for boat セッ、・ャウ at セ_gL
partly sheltered by trees, orient.
s ppr-ox , N-S.
47 Gable 1360 18 11 Metal Adjacent building between
No.
46 andNo. エセ
7.
Same conditions as for No. 46.48 Gable 3630 18 ャoセ 11eta 1 Adjacent building to No. 47, same
conditions.
49 Gable 3630 18 QPセ Metal Cold storage are8 at
:'nc.
prrtly shelteredby trees-. orient. approx. N-S.
50 Gable 1360 18 QPセ Metal Adjacent building to No. 49 and No. 51.
Same conditions as for No. 49.
51 Gable 3630 18 QPセ Metal Adjacent building to No. 50, same
conditions.
52 Hip Roof 1880 23 10 Asphal t Attic above dwelling house, sheltered
Shingle by trees.
53 Flat 620 0 10 Asphalt Roof above garage, adjacent to No. 52,
Sheeting sheltered by trees.
54 F'l a t 700 0 20 Asphalt Attic above dwelling house, sh e I tered,
Sheeting by trees.
55 Gable 1210 26 9 Asphalt Attic above dwelling house adjacent to
re ,
Roof (sq (degree) to the Material General Descriptionft ) EAve
(ft )
S6 Flat 4°0 0 9 Asphalt Roof above ァXイ。ァセ adjacent to No. 55.
Sheeting Sheltered by trees.
57 Get::Ie 1800 14 16 Asphalt Attic above dwelling house, sheltered Sheeting from North. East and West.
58
,
Flet 620 0 11 Asphalt Garage roof adjacent to No. 57 and with Sheeting the same conditions.59 Gable 2790 22 9k. Asphalt Attic above dwelling house, shel tered Sheetinp: by hiM trees.
60 Gable 390
I
22 91:; Asphalt Lower part of garage roof, adjacent Sheetinl': to No. 59 sheltered by trees.61 Flat 620 0 10 As pha I t Garage roof 。、セ。」・ョエ to No. 62, sheltered Sheetinp: by trees.
62a Gable 1200 36 ャャセ Asphal t Roof above dwelling house, sheltered by Shee tinp; trees.
62 b I Gable 200 '-4 19 As ph a1t Raised part of the roof above the dwelling
Shee tinr; house No , 62 sheltered by trees.
63 Fls t 4hO 0 Xセ As ph a It. Carport roof adjacent エセ building セッN 64,
.,i
th gravel sheltered by trees.64a Gable 6,0 11 17 Graveled 'The one side of R gable, roof above Asphalt dwelling house sheltered by trees.
64b Gahle J
ooo
13 8 Graveled The other side of gable roof No. 64,aウーィセャエ conditions as for No. VTセN
65a Gable 530 11 27 Graveled The one side of gable, roof above dwelling As oh a I t house No. 65. sheltered by trees.
65b Gable 10SO 9 bセ Graveled The ッエセ・イ side of gable, roof sbove
I
Asphal t dwelling house No. 65, sheltered bytrees.
66A Gable 740 Ie 17 Graveled The one side Pセ gahle, イッッセ above Asphal t dwelling house No. 66, sheltered by
trees.
66b Gs b Le 1050 7 11k GrAveled The other side of gable. Roof abcve;
Asphalt dwelling House No. 66, sheltered bJ
TABLE
II
Maximum Average and Maximum Drift Loads
(Metal Roofing)
Roof
Slope
Code
Observed loads in psf
Roof
Number
(Degrees)
Load
Load to
NBC
Ground
Ave.
Max.Ground
Remar-k s1965
Roof
Drift
Load
Ratio
1
33
44
5.0
3
9
0.60
Exposed
2
33
44
5.0
3
9
0.60
Exp.4
b
43
32
14.0
2
3
0.14
Exp.
5
b
41
35
14.0
2
4
0.14
Exp.
6
830
48
14.0
9
15
0.65
Shel tered
6b
57
16
14.0
10
12
0.71
Shel.
7
823
48
8.1
3
10
0,)7
Exp.7
b
47
28
3.1
0
0
0
Exp.
8
25
48
9.7
9
35
0.93
sne
i ,9
20
48
9.7
10
12
1.03
SheL
10
15
48
9.7
9
110.93
Shel.
11
17
48
9.7
9
14
0.93
Shel.
12
12
48
9.7
10
12
L03
Shel.
13
935
42
13.0
4
7
0.)1
Exp.13
b
58
14
13.0
0
0
0
Exp ,16
13
48
13.0
7
12
0.54
Shel.
17
19
48
13.0
10
15
0.77
Exp.
18
19
48
13.0
7
13
0.54
Exp , .?I830
48
5.1
5
10
1.98
Exp ,2l b
36
41
10.0
7
14
0.70
Exp ,22b
32
46
10.0
8
17
0.80
Exp ,1965 Roof Drift Load RatLo 28s 35 42 5.0 1 3 0.20 Shel. 28b 30 48 5.0 6 8 1.20 SheL 28e 30 48 5.0 0 0 0 SheL 29 18 48 10.0 6 25 0.60 Shel. 30 19 48 5.0 4 12 0.80 She1. 31 27 48 10.0 3 17 0.30 Exp. 32 30 48 10.0 1 10 0.10 Exp, a 48 5.0 1 3 0.20 Exp. 33 30 33b 60 12 5.0 2 5 0.40 Exp. 348 30 40 5.0 1 3 0.20 Exp. 34b 60 12 5.0 2 5 0.40 Exp. 35 24 48 10.0 6 32 0.60 Exp. 36 24 48 10.0 5 26 0.50 Exp. 37 33 44 5.0 1 3 0.20 Exp , 398 29 48 7.9 3 5 0.)8 She1. 39b 52 22 7.9 4 7 0.52 SheL 40 s 37 40 10.0 4 8 0.40 SheL 40b 55 18 10.0 0 5 0 She1. 40c 34 43 10.0 2 5 0.20 ShEIl. 418 31 47 26.0'.1- 13 14 0.50 Shel. 448 40 36 10.0 1 5 0.10 Exp. 45s 38 38 16.0 4 11 0.25 SheL 45b 15 u8 16.0 5 5 0.31 She1. 46 18 48 5.5 4 18 0.73 Exp , 47 18 48 5.5 4 9 0.73 Exp , 48 18 48 10.0 5 18 0.50 Exp. 49 18 48 5.5 4 14 0.73 Exp. 50 18 48 5.5 4 12 0.73 Exp. 51 10 48 5.5 4 16 0.73 Exp. Loca tion Sheltered Exoosed
AverAge Ground Load 11.6 paf 8.3 psr
セセtィゥX high ground load was found only in this high and extremely
well-sheltered location near Navan snd is probsbly the result of reduced melting.
TAB L E III
MpxIr>'uII' Aver'age and Maximum Drift Lond s (Vl1riOIlS Bituminous Roofinga)
Roof Slope Code Observed loads in psf Root
Number (Degrees) Load Load to
NBC Groul"ld Ave. MBX. Ground ゥQセBャァイォウ
1965 Roof Drift Load
Rst I o 14 0 48 13.0 5 7 0.38 Shel tared 15 0 48 13.0 6 11 0.46 Shel. 19 34 43 5.1 3 3 0.59 Exposed 20 42 34 5.1 3 7 0.59 F.xp. 22B 23 48 5.1 3 4 0.59 F..xp. 23 28 413 4.1 1 4 0.24 F..xp. 24 30 48 4.1 1 3 0.::'4 Exp , Rセ 22 48 4.1 3 23 0.73 Exp. 268 22 48 4.1 5 9 1.22 F..xp. 26b 9 48 4.1 4 9 0.98 Exp. 27 40 36 10.0 1 17 0.10 F.xp. J8 35 42 10.0 2 4 0.20 She 1. 52 23 48 14.0 7 20 0.50 snei , 5'3 0 4Fl 14.0 5 8 0.J6 Shel. 54 0 48 17 .0 7 8 0.41 She 1. 55 26 48 17 .0 6 8 0.J5 Shel. 56 0 48 17 .0 9 17 0.53 Shel. 57 14 4 11 12.0 6 8 0.50 Shel. 58 0 48 12.() 6 6 0.50 Shel. 59 22 48 lS.0 7 13 0.44 Shel. 60 22 48 16.0 10 24 0.63 Shel. 61 0 48 16.0 12 14 0.75 Shel. 628 36 41 16.0 6 13 0.38 Shel. 62b 14 48 16.0 5 9 0·31 snei , 63 0 48 18.0 13 14 0.7<' Shel. 648 11 4El 18.0 10 11 0.56 Shel. 64b 13 48 18.0 12 14 0.h7 Shel. 658 11 4El 14.0 6 9 0.43 Shel. 65b 9 40 14.0 3 12 0.57 She!. 668 10 48 14.l 9 11 0.64 snei . 66b 70
4B
14.0 15 18 1.07 Shel. Locs tionAverage Ground Load
Sheltered 14.25 psI'
Exposed 6.40 pst
Maximum Average and Maximum Drift Loads
(Wood Shingles)
Roof
Slope
Code
Observed loads in psf
Roof
Number (Degrees)
Loed
Load to
RemArks
NBC
Ground
Ave.
Max.
Ground
1965
Roof
Drift
Load
Ratio
3
40
36
14·0
2
12
0.14
Expos'ed
4
843
32
4.7
5
5
1.06
Exp.
5
a
41
35
4.7
5
7
1.06
Exp.
41
b
31
47
26.0
*
14
15
0.54
Sheltered
42
45
30
8.7
3
22
0.34
Exp.
43
45
30
8.7
6
22
0.69
Exp ,Loce tion
Average Ground load
Sheltered
26.1
paf
Exposed
1)035
psf
*
This high ground load was found only in this high and
extremely well-sheltered location near Navan and is
probably the result
of reduced me
Lting ,
セ
セ
セ
0-w.- IS
Vl:r:
HJ
u
«
we::::
o
u.. Vl u..S
o
o
e::::
u..o
o
0
z
o
10
20
30
40
Slope, degrees
SO
60
LEGEN D
D
Metal roofing (SI roofs)
セ
Asphalt roofing (31 roofs)
セ
Wood roofing (6 roofs)
FIGURE
1
DISTRIBUTION OF THE ROOFS ACCORDING TO THEIR SLOPES
Austria, Canada"'u
Great Britain OO u
Germany, Rumania,
U.S.A.'" and U.S.S.R,u
Norway, Sweden
Connecticut (USA)
10
20
30
40
50
60
70
80
Slope, degrees
0-
u0.8
ro u. c0.6
0-
u0.4
:::J "C Q) a:::0.2
Q) Cl. 0 Vl0
0:<
The American Standards Association's "Minimum
Design Loads" A-58, uses a minimum snow load of
20 psf horizontal roof projection (other
local
codes in force in the U. S. A. might have special
regulations. )
**
U. S. S. R. has special shape factors in addition
to the regulations for slope.
"'**
Canada has detailed, special shape factors In
addition to the slope reduction factor.
0 0 0 ) 0
Great Britain use an over-all minimum ground
load of 30 ps
t.
FI GURE
2
SLOPE REDUCTION FACTORS (K) IN CODES WHERE THEY
HAVE TO BE USED TOGETHER WITH A CLOSER DEFINED
(I
Local authorities are responsible for
stipulating the ground load in the area
co n cern ed.
Possibilities of heavy unbalanced
accumulations should be especially
cared for in the design.
(1(1
Snow loads on roofs are taken into
account only in the northern part
of the country, the loads depending
on elevation above sea level.
I n locations where heavy loads
usually occur this should be
accounted for in design.
/1//3780-1
FIGURE
3
STEPWISE SLOPE REDUCTION FACTORS
FROM THE CODES IN JAPAN AND ISRAEL
セMMMMMMMi
ta
Iyo;. '"
1 0 4 t - I 1 - - -
Czec ho slova ki a'"
10
20
30
40
50
60
70
80
Slope, degrees
0-::;0.8
ro u..c
O.
6
0-::;0.4
:::J "'Cセ
O.
2
Q,) a. 0 V')0
*
Ground load is dependent on the location and the
elevation above sea level.
For slopes exceeding 40° the load may be taken as
50 kg/sq m (10 ps
t)
for any height above sea level.
.)*
Ground loads are dependent on elevation above sea
level.
For slopes less than 10° the design snow
load has to be increased 25% if the possibilities of
draining water off the roof are bad.
FIGURE 4
SLOPE REDUCTION FACTORS (K) IN THE CZECHOSLOVAKIAN
...---Switzerland ....
1 - 4 - - - , - - - -Po r tug aI
* ....
セゥMMMMCos a.
10
20
30
40
50
60
70
80
Slope, degrees
セ1.0
-...
e
...
0.8
u ro l.1-C0.6
e
...
u0.4
::J "0 CL>0.2
a:::::
CL> c..e
(/)0
* The ground load is dependent on the
elevation above sea level.
The slope
reduction should only be taken into
account when the snow sliding off
the roof is not restricted.
** The ground load is dependent on
I
0
cat ion and eI evat ion abo v e sea I e
ve
I.
The slope reduction should only be
taken into account when the snow
sliding off the roof is not restricted.
The design snow load should not be
taken less than 30 kg/sq m (6psf).
/'IR 1780-5
FIGURE
5
SLOPE REDUCTION FACTORS (K) IN THE CODES
of the snow cover considered
セMw・。ォ
layer in the snow cover
Releasing force
Shear force,
Q =
G sin
v
Stabilizing forces
1.
Cohesion, Co
}
Shear strength
2
.
Fr . ctt
I
Ion,
F = N
.f'
= G
cos}" . g
"Itt
A.=
C0
h esion + f ric t ion
If'
3.
Tensile force at the upper end surface, Pt
4.
Compression force at the lower end surface, Pc
5.
Shear (or diagonal) forces at the lateral surfaces.
FIGURE
6
FORCES ACTING ON AN ELEMENT OF A SLOPED SNOW COVER
T-
Shear stress -
Q/A
0--compression
stress
a.
S now mass
considered
ッセᄁ
(Contact
are a - A)
C
GMM⦅NNMl⦅セKMMMGMMGMG _ _+--Z.""b.
Cohesion, C
Static friction
When the shear stress
(T)exceeds the shear resistance
(Til·C
+
(J'tg
¢)
a rupture could take place.
FIGURE
7
a.
SLOPED SNOW COVER WITH ACTING FORCES
a.
C
b.
Kinetic friction
For stresses, as shown in the diagram, the equilibrium is
stable unless external forces, heavy enough to cause break,
are added.
II"
1740 - 8FI GURE
8
a.
SLOPED SNOW COVER WITH ACTING FORCES
\,
Figure 9: Surface Slides on Steep New Snow Cover (Roof 66; Slope 57°)
Figure 10: Old Snow Cover Showing High Tensile Strength (Roof 41aj Slope 31°)
\
Figure 11: Shear Break Between Snow Cover and Roof Surface
mansard
roof
.6 6.5
5Slope 0°
FIGURE
12
EXAMPLE OF LINES OF EQUAL SNOW DEPTH BASED
ON DEPTH MEASUREMENTS (Roof 15; Slope 0°)
Pipe made of thin metal
sheet welded or soldered
to a solid pipe with
cutting edge.
I nside area approximately
100 sq cm.
Total length
approximately 30 in.
FIGURE
13
NORWEGIAN TYPE SNOW LOAD SAMPLER
i
Area •
50'
x
80' • 4000
s
q
It.
"
'"
'"
" '" ;>"
'"
'"
./ ./Av.
7"
Max 14"
6"FIGURE
14
Av.
Ii"
Max
3
11Location:
Near Orleans,
Ontario
Roof no .:
30
Slope:
19°
Observ. date:
25.1.66
Wind direction: East
Ground depth:
7
11Ground load:
5
pst
Roof
Av. depth:
41
11Av. load:
4
psf
Max depth:
14"
Max load:
12 p
st
Roof snow density
Depth
12
11and
91
11:r ..
0.160 gmICC}0.871
0.175
gm/cc
ps
fl'
In.
Ground snow density
'7"
O.
14
2 9
m/ cc }
O. 7
f
4/,.
ps
In.
EXAMPLE OF ACTUAL RECORD SHEET WITH CALCULATED AVERAGE AND
80
-I30
40
50
Slope, degrees
I I I I I I I I I I I-
セLine representing
K
\
Line approx-
-"
factor applied to
imating desig'l
-, ground load
'\IOad for
","observed at each
various
-'" f7rm
. , slopes.
"
\wttawa
-セセ
'7
=
\セL
\
-,
\
I Iセ
I60
70
I I I•
I20
I I90
I-80
I-70
I-60
セ50
セ40
I-30
セ20
セ10
セo
I I10
I I100
セ,_.
><.
o o--
e:: I1l u セ"'
o セNNNNj"'
oセ ....Je:: _ ::J o 0 o L.. セ C)FIGURE
15
ROOF TO GROUND LOAD RATIO VS SLOPE FOR SHELTERED METAL ROOFS
-80
-I70
60
50
40
I II
30
I
20
I
I10
I
I
10
I--o
セMZMMMMNMMG
Line approXimatin g - ;
90
I--Line representing
セd
'
I
d f
K
f
ac
t
or
....
" .
es
iqn
oa
I
or
\
I' d t
"
various
Sopes.
80
I--app led
,0
d · " (Ottawa area)
\
groun
oa
"
70
I--observed at
•
"
,
Zセ
:
each farm.
" ,
\
"
".
\
\
:\.
,
r. \
ILセ
100
><...
<Ll CL-
e: <Ll u セ o o -"1;J n:J "0 セ40
I--n:J 0 " 030
I--...Ie: _:::l o 020
I--o ... a::: <.:)Slope, degrees
FIGURE
16
ROOF TO GROUND LOAD RATIO VS SLOPE FOR EXPOSED METAL ROOFS
110
I • I I I I I I I I I I I T IT
100
セMMMMMMセLine approximating
\
-... c90
Line representing
,
design load for
Q)
-
K factor applied to
,various slopes.
\
-U
L-
80
I -ground load
(Ottawa area)---\
-Q)
observed at each
"-0-70
I-fa r m.
セ
\-.
\
0-,
060
-
--
><-,
\50
-
-,
\
-"0-,
m40
0-
-,
-"0 -J m \ 0 "030
-
-,
,
\
--J C--
::J20
0 0 I - -0L-'\
e::: <-=>iGセ
10
I--0
I
I I I I I I I I I I I10
20
30
40
50
60
70
80
Slope, degrees
FI GURE
17
ROOF TO GROUND LOAD RATIO VS SLOPE FOR SHELTERED BITUMINOUS
-
.... - - - - . - -
セLine approx-
\
Line represen-
セ
Imating design
ting K factor
, l o a d for various,
applied to
slopes. (Ottawa
\
' a r e a )
...
ground load
observed at
"
,
each farm
" \
,
,
-,
,
\
'
,
\
"
100
....
セ
90
u セ80
QJ0-70
.
o o-
60
50
"0:;
40
"0-..1 ro 0 " 030
-..Ie _::J o 020
o セ e::: セ10
OL...---l.._...L...._.l...----l._...L.._..L.----l._---L..._...I....---L_---L.._....L..-___JL...--1._...l----I10
20
30
40
50
60
70
80
Slope, degrees
FI GURE
18
ROOF TO GROUND LOAD RATIO VS SLOPE FOR EXPOSED BITUMINOUS
•
•
-
-
-
-
Mセlゥョ・approximating
\
Line representing K
セdesign load for
factor applied to ground
" ,"various slopes.
\
loa d
0bser v ed ate ac h far m. '"
セo
tt
a
w
a are a) - - - \
セ
\"
"
\
\"
"
\
\"
"\
\
<,
110
100
....
c90
QJ U...
80
QJ C.70
-0 060
...
) (50
"0 ro40
0 "0 ...J ro30
0 "0 ...J C-
::320
0 0 0...
e::: c..:>10
0
10
20
30
40
50
60
70
80
Slope, degrees
FIGURE 19
ROOF TO GROUND LOAD RATIO VS SLOPE FOR EXPOSED WOOD ROOFS
Figure 20: Snow Cover Held by Lateral Forces Produced
by Dormer. (Note the Compression Folds. )
\
Figure 21: Snow Load on Well-Sheltered Roof
(Roof 41; Slope 310
Figure 22: Snow Load on Leeward Side of Exposed Roof (Roof 25; Slope 22°)
<">
I
1
I
I
I
I
I
I
1
-
-•
-III-IIIIII11111111
t
•
IIセ
セ III II/TIl TIllTTl1"T' }
-
Average roof load
-I
I
I
I
1I
I
I
I
"0 0 . > " 0 4 Vl ro V l O 0.> ....J I.0 . .-><
0 o l。NNiセS ro 0.> 0.> iNMセ « r ol.-e
0.> 0.>>
>«2
t.::>0.>.c
ro ... 1 . -0.> 0セセQ
0.. "C . -ro::::: o ::J NNNNjセセ
ro0
uo
Vl0
....J ro20
40
60
80
100
Percentage of Roof Area
FIGURE
23
LOCAL LOAD OVER A GIVEN AREA EXPRESSED
AS A MULTIPLE OF THE AVERAGE ROOF LOAD
VS PERCENTAGE OF ROOF AREA.
(Shaded
area
covers 19 of the 21 loads u sed.J
Figure 24: Deep Snow Layers Retained on Steep Aluminum Roofs (Rogers Pass, B. C., 30 January 1965)