HAL Id: hal-03129922
https://hal.archives-ouvertes.fr/hal-03129922
Submitted on 3 Feb 2021
HAL is a multi-disciplinary open access
archive for the deposit and dissemination of
sci-entific research documents, whether they are
pub-lished or not. The documents may come from
teaching and research institutions in France or
abroad, or from public or private research centers.
L’archive ouverte pluridisciplinaire HAL, est
destinée au dépôt et à la diffusion de documents
scientifiques de niveau recherche, publiés ou non,
émanant des établissements d’enseignement et de
recherche français ou étrangers, des laboratoires
publics ou privés.
Aluminium-enriched metal-poor stars buried in the
inner Galaxy
José Fernández-Trincado, Timothy Beers, Dante Minniti, Baitian Tang,
Sandro Villanova, Doug Geisler, Angeles Pérez-Villegas, Katherine Vieira
To cite this version:
José Fernández-Trincado, Timothy Beers, Dante Minniti, Baitian Tang, Sandro Villanova, et al..
Aluminiumenriched metalpoor stars buried in the inner Galaxy. Astronomy and Astrophysics
-A&A, EDP Sciences, 2020, 643, pp.L4. �10.1051/0004-6361/202039207�. �hal-03129922�
https://doi.org/10.1051/0004-6361/202039207 c ESO 2020
Astronomy
&
Astrophysics
LETTER TO THE
EDITOR
Aluminium-enriched metal-poor stars buried in the inner Galaxy
José G. Fernández-Trincado
1,2, Timothy C. Beers
3, Dante Minniti
4,5, Baitian Tang
6, Sandro Villanova
7,
Doug Geisler
7,8,9, Angeles Pérez-Villegas
10, and Katherine Vieira
11 Instituto de Astronomía y Ciencias Planetarias, Universidad de Atacama, Copayapu 485, Copiapó, Chile e-mail: jose.fernandez@uda.cl
2 Institut Utinam, CNRS-UMR 6213, Université Bourgogne-Franche-Comté, OSU THETA Franche-Comté, Observatoire de Besançon, BP 1615, 251010 Besançon Cedex, France
3 Department of Physics and JINA Center for the Evolution of the Elements, University of Notre Dame, Notre Dame, IN 46556, USA
4 Depto. de Cs. Físicas, Facultad de Ciencias Exactas, Universidad Andrés Bello, Av. Fernández Concha 700, Las Condes, Santiago, Chile
5 Vatican Observatory, 00120 Vatican City State, Italy
6 School of Physics and Astronomy, Sun Yat-sen University, Zhuhai 519082, PR China 7 Departamento de Astronomía, Universidad de Concepción, Casilla 160-C, Concepción, Chile
8 Departamento de Astronomía, Universidad de La Serena, Avenida Juan Cisternas 1200, La Serena, Chile
9 Instituto de Investigación Multidisciplinario en Ciencia y Tecnología, Universidad de La Serena, Benavente 980, La Serena, Chile 10 Universidade de São Paulo, IAG, Rua do Matão 1226, Cidade Universitária, São Paulo 05508-900, Brazil
Received 18 August 2020/ Accepted 2 October 2020
ABSTRACT
Stars with higher levels of aluminium and nitrogen enrichment are often key pieces in the chemical makeup of multiple populations in almost all globular clusters (GCs). There is also compelling observational evidence that some Galactic components could be partially built from dissipated GCs. The identification of such stars among metal-poor field stars may therefore provide insight into the composite nature of the Milky Way (MW) bulge and inner stellar halo, and could also reveal other chemical peculiarities. Here, based on APOGEE spectra, we report the discovery of 29 mildly metal-poor ([Fe/H] . −0.7) stars with stellar atmospheres strongly enriched in aluminium (Al-rich stars: [Al/Fe] & +0.5), well above the typical Galactic levels, located within the solar radius toward the bulge region, which lies in highly eccentric orbits (e& 0.6). We find many similarities for almost all of the chemical species measured in this work with the chemical patterns of GCs, and therefore we propose that they have likely been dynamically ejected into the bulge and inner halo from GCs formed in situ and/or GCs formed in different progenitors of known merger events experienced by the MW, such as the Gaia-Sausage-Enceladus and/or Sequoia.
Key words. stars: abundances – stars: chemically peculiar – Galaxy: bulge – globular clusters: general – Galaxy: stellar content –
Galaxy: kinematics and dynamics
1. Introduction
The current standard picture of the inner region of our Galaxy suggests that it is made up of a complex variety of stellar popu-lations, each with a characteristic structure, chemistry, and kine-matics (see, e.g.Recio-Blanco et al. 2017;Queiroz et al. 2020a; Rojas-Arriagada et al. 2020, and references therein).
Every stellar population retains traces of the early phases of the formation and subsequent evolution of the inner disc, the massive bar structure (∼1010M ) (Bland-Hawthorn &
Gerhard 2016), the pseudo-bulge, and a possible classical bulge (e.g. Combes et al. 1990; Minniti 1996; Athanassoula 2005; Zoccali et al. 2008; Barbuy et al. 2018), which is likely to be the product of mergers with and accretion of primordial globu-lar clusters (GCs) or dwarf galaxies (e.g.Belokurov et al. 2018; Koppelman et al. 2019;Massari et al. 2019;Souza et al. 2020; Naidu et al. 2020). While our knowledge of the nature of the bulge has improved substantially in recent years, some key ques-tions remain. In particular, some of the stars seen in the bulge today in the lower-metallicity range (−2.0 < [Fe/H] < −0.7)
exhibit chemical compositions and kinematics that are different from those of the more metal-rich stars, and could contain infor-mation regarding the earliest phases of forinfor-mation and evolution of the inner Galaxy (see, e.g.Fernández-Trincado et al. 2019a,b, 2020a).
A major advancement in revealing the nature of the low-metallicity stars ([Fe/H] . −0.7) in the bulge region was achieved by the discovery of a large population of giant stars with nitrogen over-abundances (N-rich; Schiavon et al. 2017; Fernández-Trincado et al. 2019b) and low-α stars (see, e.g. Recio-Blanco et al. 2017), which mimic the typical chemical patterns only seen in the so-called second-generation1GC stars. The origin of the N-rich stars (NRSs) remains controversial and is still a matter of debate (see Bekki 2019, for an alternative view). Recent studies propose the existence of stars that have lower aluminium enrichment ([Al/Fe] < +0.2) within ∼3.5 kpc of
1 Second-generation (2G) is used here to refer to stars in GCs that display altered light-element abundances (e.g. He, C, N, O, Na, Al, and Mg), which are different from those of typical MW field stars.
the Galactic centre (Barbuy et al. 2018), with chemical patterns that resemble those of low-mass satellite galaxies of the Milky Way (MW;Das et al. 2020).
Taking advantage of high-resolution near-infrared (NIR) spectroscopy from the Apache Point Observatory Galactic Evo-lution Experiment (APOGEE-2;Majewski et al. 2017), we select some key elements (N, Al, Mg, Si, among others) for investiga-tion of any possible chemical peculiarities that could be used to constrain scenarios of their origin and relation to the mass-assembly history of the Galaxy (see, e.g. Fernández-Trincado et al. 2016,2017,2019a,b,c,d,2020b).
In this Letter, we report the discovery of a unique collection of aluminium-enhanced (Al-rich) stars among a population of metal-poor ones. These stars exhibit Al abundances well above typical Galactic levels ([Al/Fe] & +0.5) over a range of metal-licities, and resemble those known for a long time to exist in Galactic GCs (see, e.g. Mészáros et al. 2020). However, they are unlikely to be linked to the accretion of dwarf galaxies, for which larger Al abundance ratios have not been observed to date (Hasselquist et al. 2019, and references therein). Observations and sample selection is described in Sect. 2. Results are dis-cussed in Sect. 3. Finally, our conclusions are summarised in Sect.4.
2. Observations
This work makes use of data primarily from the second genera-tion of the Apache Point Observatory Galactic Evolugenera-tion Exper-iment (APOGEE-2), which has now collected high-resolution (R ∼ 22 500) H-band spectra (NIR, ∼15 145 Å to 16 960 Å, vac-uum wavelengths) for almost 470 000 sources in their sixteenth data release (APOGEE DR16:Ahumada et al. 2020), as part of the Sloan Digital Sky Survey IV (Blanton et al. 2017). For details of the sample selection, see AppendixA.
As we focus on selecting dissolved and/or evaporated GC stars in [Al/Fe] space, we selected stars among metal-poor ones with aluminium enrichments greater than those expected for dwarf galaxies (see, e.g.Hasselquist et al. 2019) and MW stars, namely, [Al/Fe] & +0.5. Our final sample comprises 29 Al-rich stars. With the uncalibrated ASPCAP stellar parameters fixed (Teff, log g, and [M/H]), we derive, where possible, the
abun-dances of C, N, O, Mg, Al, Si, and Ce, as well as the metallic-ity for each Al-rich star. The derived abundances and kinematic parameters for this sample are presented in TablesB.1andC.1.
3. Elemental abundance analysis
Large amounts of aluminium were found in the atmospheres of 29 previously unidentified metal-poor field giant stars. Our sam-ple includes seven stars with orbital apocentres (rapo)/ 3.5 kpc
(see Sect.3.6), placing them well within the bulge region (see, e.g. Barbuy et al. 2018), and two halo interlopers located in the inner region of the Galaxy, which we refer to here as the bulge sample. The remaining stars in our sample are located within ∼13 kpc from the Galactic centre. The light elements (C, N), the α elements (O, Mg, Si), the odd-Z element (Al), the iron-peak element (Fe), and the s-process element (Ce) of these stars are compared to those for GC stars from Mészáros et al. (2020), and the local MW disc, halo, and bulge population from APOGEE DR16 (Ahumada et al. 2020). Abundances were deter-mined from a χ2minimisation of synthesised spectra using the BACCHUS code.
It is also important to note that there are no known GCs within an angular separation of 0.5◦for most of our stars, except for one (2M18035017−2552334), which is located ∼1.2 rtfrom
the GC Terzan 10. However, its [Fe/H] and RV deviate signifi-cantly from the nominal parameters of the cluster, and therefore it cannot be considered a potential extra-tidal star candidate, as was recently found for other bulge GCs (NGC 6723, Fernández-Trincado et al. 2020c).
Overall, we find that the elemental abundances of our sample are separated relatively cleanly from other stellar pop-ulations in different chemical dimensions, such as [Mg,N/Fe]– [Al/Fe] planes. Results shown in Fig.1reveal that our observed stars differ substantially from those of the so–called N-rich (or NRS) bulge population (see, e.g. Schiavon et al. 2017) and from the rest of the entire MW/bulge sample, but exhibit a unique chemical signature similar to that of some GC 2G stars with higher [Al/Fe]. Also, their higher aluminium enrichment ([Al/Fe] & +0.5) over a wide range of metallicities makes them unlikely to be associated to the typical Al enrichment seen in dwarf galaxies (Hasselquist et al. 2019), unless they are part of partially dissipated GCs in dwarf galaxies (see Fernández-Trincado et al. 2020d).
3.1. The iron-peak element: Fe
Regarding the iron-peak element (Fe), we find that our sample spans a wide range of iron abundances, −1.68. [Fe/H] . −0.76 (see Fig.1), suggesting that these stars were formed from dif-ferent progenitors or in an unusual system like ω Cen (unless they are part of a binary system). It is interesting to note that our Al-rich stars toward the bulge region peak around [Fe/H] ∼ −1, in the same way as NRS stars located in bulge (Schiavon et al. 2017), suggesting an association to them. It is therefore possi-ble that we have identified a subfamily of that population which is more strongly enriched in aluminium, whilst the stars in our sample located outside the bulge region do not peak at any par-ticular metallicity and are moderately more metal-poor.
3.2. Theα-elements: O, Mg, and Si
Figure1c shows that the [O/Fe] abundance ratio of our sample is similar to that of the NRS, and MW/bulge stars at [Fe/H] & −1.5, but is moderately enhanced toward the bulge region at metallici-ties as low as [Fe/H] . −1.5, and slightly enhanced for our sam-ple outside the bulge region. In the same figures it is clear that the [O/Fe] abundances of the Al-rich stars are on average consis-tent with the GC population at similar metallicity, and that these stars show a large dispersion in [O/Fe] similar to that observed in GCs.
Regarding magnesium (see Fig. 1d), most of our targets exhibit low levels ([Mg/Fe] . +0.2) and behave like accreted halo stars in the low-Mg sequence. At higher metallicity ([Fe/H] & −1.25), a few stars show enhancement in [Mg/Fe] rela-tive to the disc, providing evidence that these stars do not belong to the canonical disc or halo of the MW, or to the bulge pop-ulation, and have lower [Mg/Fe] than the NRS on average. On the other hand the [Mg/Fe] levels and the star-to-star dispersion observed in our sample is consistent with that observed in GC stars and ω Cen stars.
The α−element Si is found to be higher in our sample com-pared to the NRS and MW/bulge stars, but similar to those known to exist in ω Cen stars, and a few other Galactic GCs at similar metallicity. The slightly higher [Si/Fe] (∼+0.25) of our stars indicate that the initial composition of the gas that formed them was slightly different from the NRS and MW stars, but similar to that of GC stars, providing further evidence that the Al-rich stars could be likely accreted stars from a progenitor whose chemical history is similar to that of known Galactic GCs.
Fig. 1.Kernel density estimation of [X/Fe] (with X = C, N, O, Mg, Al, Si, or Ce) with metallicity (a–g), and [Al/Fe] as a function of [Mg,N/Fe]
ratios (i,h) for the APOGEE DR16 stars (grey contours) surviving the quality cuts discussed in Sect.2and corresponding to the chemical domain of the halo, and low-metallicity end of the bulge and disc, corrected by the offsets between pipelines (see Fig.D.2). ω Centauri stars (cyan contours) fromMészáros et al.(2020) are also plotted for comparison. The black and lime star symbols refer to Al-rich stars in the bulge sample and outside the bulge region, respectively. Our sample is compared to GCs (crimson violin representation, indicating with horizontal lines the median and limits of the distribution; left to right: M 53, NGC 6397, NGC 5466, M 55, M 22, M 79, NGC 6752, M 13, M 2, NGC 6544, M 3, M 54, M 10, NGC 6522, NGC 3201, NGC 6229, Pal 5, NGC 288, M 5, M 12, NGC 1851, NGC 362, M 4, NGC 2808, Pal 6, and M 107) fromMészáros et al.
(2020), and a sample of selected NRS (pink hexagons) fromSchiavon et al.(2017) with available APOGEE DR16 abundance ratios. The plotted error bars (green symbols) show the typical uncertainties associated with our sample.
3.3. The light elements: C and N
The outlying stars with high levels of Al enhancement are also enhanced in N, well above the Galactic levels ([N/Fe] & +0.8) as can be seen in Figs.1b and i, except for three stars at metallic-ities above [Fe/H] & −1.2 that exhibit nitrogen abundance lower than [N/Fe] ∼ +0.5, but clearly distinguishable from the canon-ical Galactic components in the [N/Fe]–[Al/Fe] plane. Further-more, the Al-rich stars are slightly more enriched in nitrogen than the NRS, indicating that they do not necessarily share the same star-formation history, instead showing similarities to GC environments. Interestingly, we can see a clear N–Al correlation in Fig.1between our Al-rich stars toward the bulge region and the NRS, which is strikingly similar to that seen in Galactic GCs like ω Cen.
Regarding carbon, we find similar patterns to NRS and GC populations at the same metallicities. The Al-rich stars from our sample have slightly lower levels than the bulge, canon-ical disc, and halo populations, extending down well below [C/Fe] . −0.7 dex.
3.4. The odd-Z elements: Al
Figure 1h shows a well-distinguished clump of Al-rich stars, differing from the NRS, MW, and bulge stars, indicating that these stars are likely members of a distinct population con-fined to the inner part of the Galaxy (based on their orbital parameters; see Sect.3.6), possibly part of the innermost dis-tribution of the stellar halo. There are also a few cases in the [Mg/Fe]–[Al/Fe] plane with large Al enhancement paired with
low Mg, [Mg/Fe] < 0, which is a signature of GC 2G stars (see, e.g.Fernández-Trincado et al. 2017;Lucey et al. 2019).
Overall, Fig.1h displays the chemical-abundance pattern of GC stars from ω Cen (Mészáros et al. 2020); this GC spans as wide a metallicity range as our observed Al-rich stars. The star-to-star scatter of the Al-rich stars for almost all the chemi-cal species is similar to that typichemi-cally found in ω Cen stars. The similarity between Al-rich stars and GC 2G stars can be further tested through examination of the [Mg, Al/Fe]–[Al/Fe] planes. Interestingly, we find that Al-rich stars exhibit similar character-istics to the NRSs, that is, they also show high [N/Fe] correlated with [Al/Fe] and anti-correlated with [C/Fe]. To first order, these branches strongly resemble those known for a long time to exist in GCs, and are not present in the Galactic field. As far as we know, this is the first time the existence of clear Mg-Al anti-correlation and N-Al anti-correlation among metal-poor stars with chemical anomalies toward the Galactic bulge is reported, and beyond the GC environments where these have typically been identified so far. This finding reinforces the unique nature of our sample, and confirms the complex and composite structure of the MW bulge.
3.5. The s-process element: Ce
The APOGEE DR16 [Ce/Fe] abundance ratio patterns (Cunha et al. 2017) are shown for MW stars in Fig. 1g and stars in the bulge region in Fig.1g. Figure1g indicates that [Ce/Fe] is slightly more enhanced than in NRSs, GCs, or MW stars, but agrees with GC stars (Mészáros et al. 2020) at similar metallic-ities. However, there is currently no explanation for this unex-pected tendency.
3.6. Orbital analysis
The model and distribution of orbital parameters are presented in AppendixC. Overall, we find that all the stars in our sample have highly eccentric orbits (e& 0.6). FigureC.1shows the Galactic spatial distribution and the orbital elements for the Al-rich stars. As is clear from the figure, the majority of the stars are found to have radial (rper. 3.5 kpc) orbits in different configurations (e.g.
retrograde, prograde, and P–R2orbits). The orbital elements also reveal that most of the Al-rich stars are currently located near their apocentric distances (rapo), placing many of them within
the solar radius (rgal . 8 kpc) and inside of the bulge region
(rgal . 3 kpc), with rather small excursions above the Galactic
plane (|Z|max. 3 kpc). Several (11 out of 29 stars) of them have
larger (3 kpc. |Z|max. 25 kpc) vertical excursions, making them
halo interlopers within the solar radius. We conclude that these stars live in the bulge region and the inner stellar halo of the Galaxy, respectively.
An interesting aspect of the Al-rich stars can be seen in Fig.C.1h. Strikingly, this figure reveals that a disc control sam-ple taken from APOGEE DR16 populates the top part of the vφ
versus vRdistribution, whilst the Al-rich stars fall in the bottom
part, where the Gaia-Sausage-Enceladus (GSE), Helmi Streams (Helmi St.), and the Arjuna+Sequoia+I’itoi (ASI) halo struc-tures reside (see, e.g. Myeong et al. 2018;Naidu et al. 2020), which are dominated by metal-poor (−3 . [Fe/H] . −0.5) stars. For comparison, we calculated the orbital solutions for Galactic GCs from Baumgardt et al. (2019) and adopted the progenitor classification of Massari et al. (2019). Figure C.2
2 We refer to prograde–retrograde (P–R) orbits as the ones that flip their sense from prograde to retrograde, or vice versa, along their orbit.
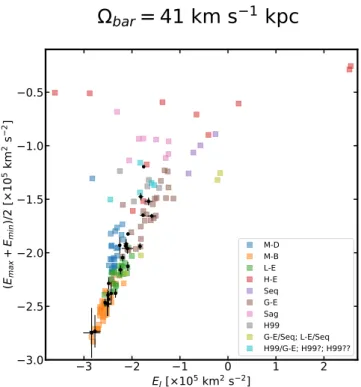
shows the characteristic orbital energy ((Emax+ Emin)/2) versus
the orbital Jacobi constant (EJ) distribution of Galactic GCs and
our Al-rich stars. This diagram reveals that the Al-rich stars pop-ulate a wide range of energies, similar to that of Galactic GCs with different origins, suggesting that these Al-rich stars may have emerged from different GCs.
Are the Al-rich stars largely the signatures of tidal disruption of accreted dwarf galaxies? This perhaps seems unlikely, given that the observed Al-rich stars exhibit higher [Al/Fe] & +0.5, not observed in present-day dwarf galaxy stars (seeHasselquist et al. 2019, and references therein). Even though most of the Al-rich stars share similar orbital eccentricity, spatial distribution, and location in the vφversus vR plane as those seen in high-α disc
stars, in-situ halo stars, metal-poor thick-disc stars, Sagittarius-, Thamnos-, GSE-, Helmi St.-, and ASI-structures (Naidu et al. 2020), their association seems unlikely, given the higher Al and N abundances observed. Our sample is also not part of the unclassified debris stars reported inNaidu et al.(2020), as the Al-rich stars possess larger orbital eccentricities than these latter. However, as there are some GCs that appear to be possibly asso-ciated with some of the known mergers, in particular to GSE, the Helmi St., and Sequoia (see, e.g.Massari et al. 2019), it is pos-sible that some of our observed stars could be associated with those merger events through their partially dissipated GCs as highlighted in Fig.C.2.
All the chemical and dynamical properties described above suggest that the Al-rich stars could be the signatures of the tidal disruption of GCs likely accreted and/or formed in situ. This population could have been dynamically ejected in different orbital configurations into the bulge region and the inner stellar halo from GC systems at similar metallicity, or possibly a mas-sive system like ω Cen (Meza et al. 2005;Majewski et al. 2012).
4. Conclusions
We report the detection of aluminium-enriched ([Al/Fe] & +0.5) giant stars toward the bulge and inner stellar halo of the Galaxy. The majority of the 29 stars of our sample have unique abun-dance patterns seen in accreted GCs, and dynamical properties consistent with the bulge and halo population.
The identification of such unusual stars toward the bulge region confirms the proposed composite nature of the MW bulge (e.g. Recio-Blanco et al. 2017; Rojas-Arriagada et al. 2020; Queiroz et al. 2020a). Our finding also reveals, for the first time, that there are many chemically anomalous metal-poor stars in the vφversus vRplane residing in the same position where
mas-sive merger events (e.g. Gaia-Sausage-Enceladus and Sequoia) have been identified. However, our study also reveals that some α elements (Si) and odd-Z elements (Al) appear to rule out any direct link with those known merger events, but some indirect association through GCs may still apply.
We propose that many of our Al-rich stars were possible for-mer members of several stellar clusters with similar chemical enrichment to that of GCs likely accreted and/or formed in situ. The peculiar chemical signature of these objects makes them excellent candidates to trace the fossil relic population of the early MW, which became part of the general stellar population. Acknowledgements. The author is grateful for the enlightening feedback from the anonymous referee. J.G.F.-T. is supported by FONDECYT No. 3180210. T.C.B. acknowledges partial support for this work from grant PHY 14-30152: Physics Frontier Center/JINA Center for the Evolution of the Elements (JINA-CEE), awarded by the US National Science Foundation. D.M. is supported by the BASAL Center for Astrophysics and Associated Technologies (CATA) through
grant AFB 170002, and by project FONDECYT Regular No. 1170121. B.T. gratefully acknowledges support from the National Natural Science Foundation of China under grant No. U1931102 and support from the hundred-talent project of Sun Yat-sen University. S.V. gratefully acknowledeges the support provided by Fondecyt regular n. 1170518. D.G. gratefully acknowledges support from the Chilean Centro de Excelencia en Astrofísica y Tecnologías Afines (CATA) BASAL grant AFB-170002. D.G. also acknowledges financial support from the Dirección de Investigación y Desarrollo de la Universidad de La Serena through the Programa de Incentivo a la Investigación de Académicos (PIA-DIDULS). A.P.-V. acknowledges FAPESP for the postdoctoral fellowship No. 2017/15893-1 and the DGAPA-PAPIIT grant IG2017/15893-10032017/15893-19. The SDSS-IV/APOGEE-2 survey made this study possible.
References
Ahumada, R., Prieto, C. A., Almeida, A., et al. 2020,ApJS, 249, 3
Athanassoula, E. 2005,MNRAS, 358, 1477
Barbuy, B., Chiappini, C., & Gerhard, O. 2018,ARA&A, 56, 223
Baumgardt, H., Hilker, M., Sollima, A., & Bellini, A. 2019,MNRAS, 482, 5138
Bekki, K. 2019,MNRAS, 490, 4007
Belokurov, V., Erkal, D., Evans, N. W., Koposov, S. E., & Deason, A. J. 2018,
MNRAS, 478, 611
Bland-Hawthorn, J., & Gerhard, O. 2016,ARA&A, 54, 529
Blanton, M. R., Bershady, M. A., Abolfathi, B., et al. 2017,AJ, 154, 28
Bovy, J., Leung, H. W., Hunt, J. A. S., et al. 2019,MNRAS, 490, 4740
Bowen, I. S., & Vaughan, A. H., 1973,Appl. Opt., 12, 1430
Carollo, D., Beers, T. C., Chiba, M., et al. 2010,ApJ, 712, 692
Combes, F., Debbasch, F., Friedli, D., & Pfenniger, D. 1990,A&A, 233, 82
Cunha, K., Smith, V. V., Hasselquist, S., et al. 2017,ApJ, 844, 145
Das, P., Hawkins, K., & Jofré, P. 2020,MNRAS, 493, 5195
Fernández-Trincado, J. G., Robin, A. C., Moreno, E., et al. 2016,ApJ, 833, 132
Fernández-Trincado, J. G., Zamora, O., García-Hernández, D. A., et al. 2017,
ApJ, 846, L2
Fernández-Trincado, J. G., Beers, T. C., Placco, V. M., et al. 2019a,ApJ, 886, L8
Fernández-Trincado, J. G., Beers, T. C., Tang, B., et al. 2019b,MNRAS, 488, 2864
Fernández-Trincado, J. G., Mennickent, R., Cabezas, M., et al. 2019c,A&A, 631, A97
Fernández-Trincado, J. G., Zamora, O., Souto, D., et al. 2019d,A&A, 627, A178
Fernández-Trincado, J. G., Chaves-Velasquez, L., Pérez-Villegas, A., et al. 2020a,MNRAS, 495, 4113
Fernández-Trincado, J. G., Minniti, D., Beers, T. C., et al. 2020b, A&A, in press,
https://doi.org/10.1051/0004-6361/202039328
Fernández-Trincado, J. G., Carigi, L., Beers, T. C., et al. 2020c, ApJ, submitted Fernández-Trincado, J. G., Beers, T. C., Minniti, D., et al. 2020d, ApJ, submitted
[arXiv:2010.00024]
Gaia Collaboration (Brown, A. G. A., et al.) 2018,A&A, 616, A1
García Pérez, A. E., Allende Prieto, C., Holtzman, J. A., et al. 2016,AJ, 151, 144
Gunn, J. E., Siegmund, W. A., Mannery, E. J., et al. 2006,AJ, 131, 2332
Gustafsson, B., Edvardsson, B., Eriksson, K., et al. 2008,A&A, 486, 951
Hasselquist, S., Carlin, J. L., Holtzman, J. A., et al. 2019,ApJ, 872, 58
Holtzman, J. A., Hasselquist, S., Shetrone, M., et al. 2018,AJ, 156, 125
Jönsson, H., Allende Prieto, C., Holtzman, J. A., et al. 2018,AJ, 156, 126
Koppelman, H. H., Helmi, A., Massari, D., Roelenga, S., & Bastian, U. 2019,
A&A, 625, A5
Lindegren, L., Hernández, J., Bombrun, A., et al. 2018,A&A, 616, A2
Lucey, M., Hawkins, K., Ness, M., et al. 2019,MNRAS, 488, 2283
Majewski, S. R., Nidever, D. L., Smith, V. V., et al. 2012,ApJ, 747, L37
Majewski, S. R., Schiavon, R. P., Frinchaboy, P. M., et al. 2017, AJ, 154, 94
Martell, S. L., Shetrone, M. D., Lucatello, S., et al. 2016,ApJ, 825, 146
Massari, D., Koppelman, H. H., & Helmi, A. 2019,A&A, 630, L4
Masseron, T., Merle, T., & Hawkins, K. 2016, Astrophysics Source Code Library [record ascl:1605.004]
Masseron, T., García-Hernández, D. A., Mészáros, S., et al. 2019,A&A, 622, A191
Mészáros, S., Masseron, T., García-Hernández, D. A., et al. 2020,MNRAS, 492, 1641
Meza, A., Navarro, J. F., Abadi, M. G., & Steinmetz, M. 2005,MNRAS, 359, 93
Minniti, D. 1996,ApJ, 459, 175
Myeong, G. C., Evans, N. W., Belokurov, V., Sanders, J. L., & Koposov, S. E. 2018,ApJ, 863, L28
Naidu, R. P., Conroy, C., Bonaca, A., et al. 2020,ApJ, 901, 48
Nataf, D. M., Wyse, R. F. G., Schiavon, R. P., et al. 2019,AJ, 158, 14
Nidever, D. L., Holtzman, J. A., Allende Prieto, C., et al. 2015,AJ, 150, 173
Queiroz, A. B. A., Anders, F., Chiappini, C., et al. 2020a,A&A, 638, A76
Queiroz, A. B. A., Chiappini, C., Perez-Villegas, A., et al. 2020b, A&A, submitted [arXiv:2007.12915]
Recio-Blanco, A., Rojas-Arriagada, A., de Laverny, P., et al. 2017,A&A, 602, L14
Rojas-Arriagada, A., Zasowski, G., Schultheis, M., et al. 2020,MNRAS, 499, 1037
Schiavon, R. P., Zamora, O., Carrera, R., et al. 2017,MNRAS, 465, 501
Souza, S. O., Kerber, L. O., Barbuy, B., et al. 2020,ApJ, 890, 38
Wilson, J. C., Hearty, F. R., Skrutskie, M. F., et al. 2019,PASP, 131, 055001
Appendix A: Sample selection
APOGEE DR16 includes data taken from both the northern and southern hemisphere using the APOGEE spectrographs (Wilson et al. 2019) mounted on the 2.5 m Sloan Foundation tele-scope (Gunn et al. 2006) at Apache Point Observatory in New Mexico (APOGEE-2N: North, APO), and on the 2.5 m Irénée du Pont telescope (Bowen & Vaughan 1973) at Las Campanas Observatory (APOGEE-2S: South, LCO) in Chile. For details regarding the APOGEE atmospheric parameter analysis we refer readers to the APOGEE Stellar Parameter and Chemical Abun-dances pipeline (ASPCAP: García Pérez et al. 2016), while for details of the grid of synthetic spectra and errors seeHoltzman et al. (2018). We refer the reader to Nidever et al. (2015) for further details of the data-reduction pipeline for APOGEE. The model grids for APOGEE DR16 are based on a complete set of MARCS (Gustafsson et al. 2008) stellar atmospheres, which are now extended to effective temperatures (Teff) as low as 3200 K.
The parent sample upon which this work is based is defined as follows. Metal-poor stars were selected from the DR16 cata-logue3that match the following criteria: (i) −2. [Fe/H] . −0.7; imposing a lower limit on metallicity, i.e. [Fe/H] > −2, allows for the inclusion of metal-poor stars with high-quality spec-tra with reliable parameters and chemical abundances, while requiring stars with metallicity below [Fe/H] = −0.7 minimises the presence of disc stars; (ii) stars with S /N > 60 were selected to ensure that we are selecting spectra that have well-known uncertainties in their stellar parameters and chemi-cal abundances, and to remove stars with lower quality spec-tra; (iii) 3200 K < Teff < 5500 K, this temperature range
ensures that stellar parameters are reliably and consistently determined, and maximises the overall quality of the abun-dances considered; (iv) the estimated surface gravity (log g) must be less than 3.6, to ensure inclusion of giant and sub-giant stars, which have more accurate ASPCAP parameters than the dwarf stars with log g > 3.6 (due to the lack of asteroseis-mic surface gravities for dwarfs, only stars with log g < 3.6 have calibrated surface gravities); (v) ASPCAPFLAG== 0; this cut ensures that there are no major flagged issues, i.e. low
3 https://www.sdss.org/dr16/irspec/spectro_data/
signal-to-noise ratio, poor synthetic spectral fit, stellar parame-ters near grid boundaries, among others; and (vi) stars belong-ing to Galactic GCs from Mészáros et al. (2020), anomalous stars from Martell et al. (2016), Schiavon et al. (2017), and Fernández-Trincado et al.(2016,2017,2019a,b,c,d), and stars with carbon abundances [C/Fe] & +0.15 (to ensure the low car-bon abundances typical of GC stars) were excluded from the sample.
The final selected sample amounts to a total of 13 338 stars with high-quality parameters. We search for aluminium-enriched stars by carrying out a semi-independent stellar-abundance anal-ysis of Al I lines using the BACCHUS4 code (Masseron et al. 2016), following the method described byFernández-Trincado et al.(2019b).
Appendix B: Basic parameters
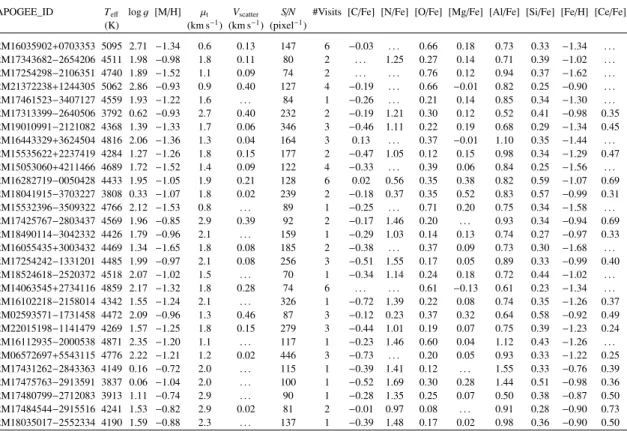
In TableB.1we provide the abundances of C, N, O, Mg, Al, Si, Fe, and Ce for the 29 stars analysed in this work. The abundances were determined by making a careful line selection, and a line-by-line analysis in local thermodynamic equilibrium (LTE) with the BACCHUS code (Masseron et al. 2016). The Teff, log g, and
overall metallicity ([M/H]) have been fixed, and were selected from uncalibrated ASPCAP Teff, log g, and [M/H] from DR16.
In addition, lines were rejected if they were found to not be well-reproduced by the synthesis, or if they were flagged as problematic by the BACCHUS pipeline. None of the 29 Al-rich star candidates exhibit particularly strong variability in its radial velocity (Vscatter . 0.5 km s−1) over the period (.6 months) of
the APOGEE observations, therefore with the existing data the observed abundance anomalies could not be explained by chan-nels invoking binary mass transfer or stellar variability. The uncertainties in the elemental abundances were computed by adding the typical sensitivities of the abundance and the inter-nal error in quadrature, in the same manner as described in Fernández-Trincado et al.(2019a,b,c,d). The typical uncertain-ties are shown with two crossed green error bars (one per axis plotted) in Fig.1.
4 BACCHUS: Brussels Automatic Code for Characterizing High accUracy Spectra.
Table B.1. Basic parameters of the Al-rich stars.
APOGEE_ID Teff log g [M/H] µt Vscatter S/N #Visits [C/Fe] [N/Fe] [O/Fe] [Mg/Fe] [Al/Fe] [Si/Fe] [Fe/H] [Ce/Fe]
(K) (km s−1) (km s−1) (pixel−1) 2M16035902+0703353 5095 2.71 −1.34 0.6 0.13 147 6 −0.03 . . . 0.66 0.18 0.73 0.33 −1.34 . . . 2M17343682−2654206 4511 1.98 −0.98 1.8 0.11 80 2 . . . 1.25 0.27 0.14 0.71 0.39 −1.02 . . . 2M17254298−2106351 4740 1.89 −1.52 1.1 0.09 74 2 . . . 0.76 0.12 0.94 0.37 −1.62 . . . 2M21372238+1244305 5062 2.86 −0.93 0.9 0.40 127 4 −0.19 . . . 0.66 −0.01 0.82 0.25 −0.90 . . . 2M17461523−3407127 4559 1.93 −1.22 1.6 . . . 84 1 −0.26 . . . 0.21 0.14 0.85 0.34 −1.30 . . . 2M17313399−2640506 3792 0.62 −0.93 2.7 0.40 232 2 −0.19 1.21 0.30 0.12 0.52 0.41 −0.98 0.35 2M19010991−2121082 4368 1.39 −1.33 1.7 0.06 346 3 −0.46 1.11 0.22 0.19 0.68 0.29 −1.34 0.45 2M16443329+3624504 4816 2.06 −1.36 1.3 0.04 164 3 0.13 . . . 0.37 −0.01 1.10 0.35 −1.44 . . . 2M15535622+2237419 4284 1.27 −1.26 1.8 0.15 177 2 −0.47 1.05 0.12 0.15 0.98 0.34 −1.29 0.47 2M15053060+4211466 4689 1.72 −1.52 1.4 0.09 122 4 −0.33 . . . 0.39 0.06 0.84 0.25 −1.56 . . . 2M16282719−0050428 4433 1.95 −1.05 1.9 0.21 128 6 0.02 0.56 0.35 0.38 0.82 0.59 −1.07 0.69 2M18041915−3703227 3808 0.33 −1.07 1.8 0.02 239 2 −0.18 0.37 0.35 0.52 0.83 0.57 −0.99 0.31 2M15532396−3509322 4766 2.12 −1.53 0.8 . . . 89 1 −0.25 . . . 0.71 0.20 0.75 0.34 −1.58 . . . 2M17425767−2803437 4569 1.96 −0.85 2.9 0.39 92 2 −0.17 1.46 0.20 . . . 0.93 0.34 −0.94 0.69 2M18490114−3042332 4426 1.79 −0.96 2.1 . . . 159 1 −0.29 1.03 0.14 0.13 0.74 0.27 −0.97 0.33 2M16055435+3003432 4469 1.34 −1.65 1.8 0.08 185 2 −0.38 . . . 0.37 0.09 0.73 0.30 −1.68 . . . 2M17254242−1331201 4485 1.99 −0.97 2.1 0.08 256 3 −0.51 1.55 0.17 0.05 0.89 0.33 −0.99 0.40 2M18524618−2520372 4518 2.07 −1.02 1.5 . . . 70 1 −0.34 1.14 0.24 0.18 0.72 0.44 −1.02 . . . 2M14063545+2734116 4859 2.17 −1.32 1.8 0.28 74 6 . . . 0.61 −0.13 0.61 0.23 −1.34 . . . 2M16102218−2158014 4342 1.55 −1.24 2.1 . . . 326 1 −0.72 1.39 0.22 0.08 0.74 0.35 −1.26 0.37 2M02593571−1731458 4472 2.09 −0.96 1.3 0.46 87 3 −0.12 0.23 0.37 0.32 0.64 0.58 −0.92 0.49 2M22015198−1141479 4269 1.57 −1.25 1.8 0.15 279 3 −0.44 1.01 0.19 0.07 0.75 0.39 −1.23 0.24 2M16112935−2000538 4871 2.35 −1.20 1.1 . . . 117 1 −0.23 1.46 0.60 0.04 1.12 0.43 −1.26 . . . 2M06572697+5543115 4776 2.22 −1.21 1.2 0.02 446 3 −0.73 . . . 0.20 0.05 0.93 0.33 −1.22 0.25 2M17431262−2843363 4149 0.16 −0.72 2.0 . . . 115 1 −0.39 1.41 0.12 . . . 1.55 0.33 −0.76 0.39 2M17475763−2913591 3837 0.06 −1.04 2.0 . . . 100 1 −0.52 1.69 0.30 0.28 1.44 0.51 −0.98 0.36 2M17480799−2712083 3913 1.11 −0.74 2.9 . . . 90 1 −0.28 1.35 0.25 0.07 0.50 0.38 −0.87 0.50 2M17484544−2915516 4241 1.53 −0.82 2.9 0.02 81 2 −0.01 0.97 0.08 . . . 0.91 0.28 −0.90 0.73 2M18035017−2552334 4190 1.59 −0.88 2.3 . . . 137 1 −0.39 1.48 0.17 0.02 0.98 0.36 −0.90 0.50
Appendix C: Galactic orbits
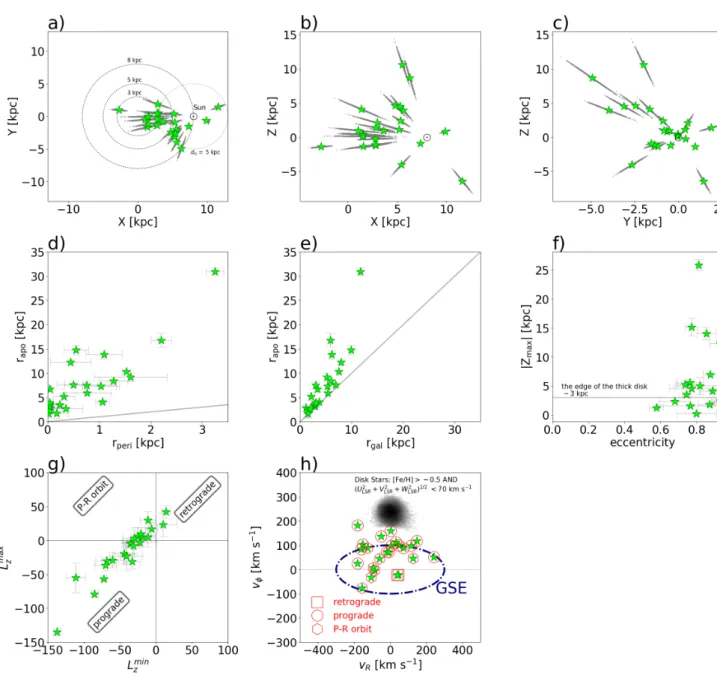
The basic kinematic parameters for the 29 stars and their respec-tive orbital elements are listed in TableC.1. Since the true Galac-tic potential is not accurately known in the inner Galaxy, and the results of our simulations may depend significantly on the assumed parameters, we also run the simulations with a slow-and fast-rotating bar, i.e. 31 km s−1and 51 km s−1, respectively,
and see how it affects the derived orbital parameters of the stars. The value inside parentheses in TableC.1show the effects in the orbital elements by adopting different angular velocity for the Galactic bar. The individual variations are within typical errors of the ensemble of orbits with Ωbar = 41 km s−1, which do not
change the overall results from our sample.
We used the GravPot165 model to study the orbital
his-tory of our sample. The orbital integration scheme follows the methodology introduced in Fernández-Trincado et al.(2020a), except for the angular velocity of the bar, for which we adopted Ωbar = 41 km s−1kpc−1 (see, e.g. Bovy et al. 2019).
The model has been rescaled to the Sun’s Galactocentric
dis-tance, 8 kpc, and the velocity of the Local Standard of Rest, νLSR= 244.5 km s−1.
For each star, we integrated an ensemble of orbits over a 2 Gyr time-span. The uncertainties in the input data were ran-domly propagated as 1σ variations in a Gaussian Monte Carlo re-sampling (e.g.Fernández-Trincado et al. 2020a). The result-ing values were estimated as the median of 1000 realisations, and the error distributions were estimated by finding the 16th and 84th percentiles. In addition, we also obtained the change in the orbital elements when the bar angular velocity is var-ied by ±10 km s−1kpc (values inside parentheses in TableC.1). FigureC.1follows the orbital elements of our sample.
We use the APOGEE DR16 distances deduced from the StarHorse code (Queiroz et al. 2020b,a), radial velocities from the APOGEE survey, and absolute proper motions from the Gaia DR2 catalogue (Gaia Collaboration 2018). Only sources with “good” astrometry were considered in our orbit computations, i.e. stars with renormalised unit weight error, RUWE < 1.4 (see, e.g.Lindegren et al. 2018). A total of 24 out of 29 stars in our sample meet this criterion.
Fig. C.1.Panels a–c: Galactic location of the Al-rich stars (lime star symbols). The aligned grey points show the results of 1000 Monte Carlo resampling incorporating measurement errors. The orbital elements are shown in panels d–g. The straight lines in panels d and e indicate the one-to-one line. For panel d, a star on this line would have a circular orbit, and in panel e, a star on this line is being observed at apocentre. The horizontal line in panel f indicates the approximate edge of the thick disc according toCarollo et al.(2010). The type of orbital configuration of each star is shown in panel g. The median of the orbital parameters for each star is shown with their respective 16th and 84th percentiles (error bars) obtained for the model with the bar havingΩbar = 41 km s−1kpc−1. The distribution of the velocity components vθvs. vRfor the studied Al-rich stars is shown in panel h. The blue dashed line represents the approximate region for stars associated with Gaia-Sausage in vθvs. vR space based onBelokurov et al.(2018). In addition, a 2D heat map (grey) of the densely distributed disc stars from APOGEE DR16 is shown for comparison. The unfilled red symbols in panel h mark the type of orbital configuration.
3
2
1
0
1
2
E
J[×10
5km
2s
2]
3.0
2.5
2.0
1.5
1.0
0.5
(E
max+
E
min)/2
[×
10
5km
2s
2]
bar
= 41 km s
1
kpc
M-D M-B L-E H-E Seq G-E Sag H99 G-E/Seq; L-E/Seq H99/G-E; H99?; H99??Fig. C.2.Characteristic orbital energy ((Emax+ Emin)/2) versus the orbital Jacobi constant (EJ) in the non-inertial reference frame where the bar is at rest. Square symbols refer to Galactic GCs, colour-coded according to their association with different progenitors fromMassari et al.(2019). The black dots with error bars refer to the Al-rich star analysed in this study.
T able C.1. Orbital elements of the Al-rich stars. APOGEE_ID RUWE d ± ∆ R V µα cos( δ) ± ∆ µδ ± ∆ rperi rapo |Z |max Eccentricity L min Z L max Z (kpc) (km s − 1) (mas yr − 1) (mas yr − 1) (kpc) (kpc) (kpc) (× 10 2km s − 1kpc) (× 10 2km s − 1kpc) 2M16035902 + 0703353 1.06 3.7 ± 0.4 33.5 − 10.28 ± 0.04 − 6.17 ± 0.03 0.76 ± 0.47 (0.58) 5.92 ± 0.33 (0.49) 4.55 ± 0.51 (0.53) 0.77 ± 0.12 (0.12) − 44.0 ± 14.0 (14.40) − 19.5 ± 14.5 (16.59) 2M17343682 − 2654206 0.96 6.5 ± 0.9 61.9 − 10.14 ± 0.18 − 1.71 ± 0.15 0.03 ± 0.16 (0.26) 2.24 ± 0.48 (0.65) 2.20 ± 0.23 (0.23) 0.96 ± 0.08 (0.11) − 11.0 ± 10.5 (14.09) 5.0 ± 14.0 (13.01) 2M17254298 − 2106351 0.96 7.0 ± 0.9 146.0 − 7.65 ± 0.08 − 3.63 ± 0.06 0.05 ± 0.21 (0.19) 2.85 ± 0.67 (0.67) 2.14 ± 0.13 (0.22) 0.96 ± 0.10 (0.09) − 25.0 ± 9.5 (10.46) 6.0 ± 13.5 (9.03) 2M21372238 + 1244305 0.90 1.9 ± 0.1 − 85.7 − 7.59 ± 0.03 − 27.14 ± 0.04 1.52 ± 0.08 (0.20) 10.28 ± 0.37 (0.45) 3.48 ± 0.33 (0.63) 0.74 ± 0.02 (0.03) − 72.0 ± 3.5 (4.94) − 57.0 ± 2.0 (7.84) 2M17461523 − 3407127 0.87 5.2 ± 0.7 97.9 − 6.02 ± 0.07 − 7.09 ± 0.05 0.03 ± 0.05 (0.14) 3.19 ± 0.69 (0.77) 1.17 ± 0.38 (0.51) 0.97 ± 0.03 (0.05) − 21.0 ± 7.0 (13.95) 10.0 ± 9.0 (9.67) 2M17313399 − 2640506 0.88 6.5 ± 0.8 74.9 − 4.48 ± 0.22 − 7.18 ± 0.15 0.02 ± 0.01 (0.07) 1.67 ± 0.73 (0.70) 0.62 ± 0.11 (0.17) 0.97 ± 0.01 (0.04) − 18.0 ± 11.0 (11.83) 5.0 ± 3.5 (3.83) 2M19010991 − 2121082 0.99 5.5 ± 0.7 − 9.7 − 3.97 ± 0.08 − 12.41 ± 0.06 0.03 ± 0.04 (0.08) 3.93 ± 0.30 (0.35) 2.47 ± 0.40 (0.52) 0.98 ± 0.02 (0.03) − 6.0 ± 8.5 (9.55) 17.0 ± 9.5 (9.05) 2M16443329 + 3624504 1.12 6.0 ± 0.7 − 250.3 − 3.28 ± 0.02 − 2.50 ± 0.03 0.49 ± 0.17 (0.21) 7.57 ± 0.40 (0.71) 6.94 ± 0.21 (0.95) 0.87 ± 0.03 (0.04) 14.0 ± 6.0 (10.90) 42.0 ± 9.5 (12.24) 2M15535622 + 2237419 1.11 6.1 ± 0.7 − 96.9 − 3.13 ± 0.04 − 2.46 ± 0.04 1.03 ± 0.36 (0.41) 7.33 ± 0.57 (0.40) 5.59 ± 0.57 (0.63) 0.76 ± 0.07 (0.08) − 60.0 ± 15.5 (12.93) − 29.0 ± 11.0 (11.79) 2M15053060 + 4211466 0.98 10.1 ± 1.2 − 228.2 − 2.94 ± 0.02 − 1.50 ± 0.03 0.44 ± 0.39 (0.32) 12.25 ± 0.53 (0.88) 12.32 ± 0.59 (0.68) 0.92 ± 0.05 (0.04) 10.0 ± 19.0 (15.83) 23.0 ± 17.5 (15.33) 2M16282719 − 0050428 1.06 7.9 ± 1.0 12.5 − 2.69 ± 0.07 − 4.51 ± 0.03 0.31 ± 0.21 (0.25) 5.18 ± 0.76 (0.64) 4.10 ± 0.48 (0.53) 0.88 ± 0.07 (0.09) − 35.0 ± 12.0 (9.27) − 4.0 ± 5.5 (6.95) 2M18041915 − 3703227 1.01 10.8 ± 0.4 − 11.0 − 2.61 ± 0.08 − 5.73 ± 0.06 0.23 ± 0.13 (0.25) 3.42 ± 0.35 (0.47) 1.79 ± 0.27 (0.22) 0.87 ± 0.06 (0.10) − 35.0 ± 5.0 (10.85) − 5.0 ± 4.5 (8.41) 2M15532396 − 3509322 1.03 5.6 ± 0.7 208.1 − 1.65 ± 0.05 − 7.39 ± 0.03 0.04 ± 0.03 (0.42) 6.70 ± 0.58 (1.00) 2.58 ± 0.32 (0.44) 0.98 ± 0.00 (0.15) − 11.0 ± 11.0 (18.76) 30.0 ± 12.5 (12.58) 2M17425767 − 2803437 1.16 6.5 ± 1.2 − 57.4 − 1.33 ± 0.47 − 5.05 ± 0.34 0.17 ± 0.22 (0.37) 1.68 ± 1.04 (1.00) 0.24 ± 0.07 (0.10) 0.79 ± 0.11 (0.13) − 22.0 ± 23.0 (21.86) − 3.0 ± 6.5 (11.14) 2M18490114 − 3042332 1.10 5.3 ± 0.6 − 136.9 − 1.15 ± 0.03 − 7.29 ± 0.03 0.04 ± 0.23 (0.22) 3.59 ± 0.61 (0.58) 2.17 ± 0.28 (0.26) 0.97 ± 0.08 (0.08) − 30.0 ± 16.5 (13.22) 3.0 ± 16.0 (12.72) 2M16055435 + 3003432 0.98 6.1 ± 0.7 − 259.0 − 0.44 ± 0.04 3.07 ± 0.05 1.09 ± 0.35 (0.36) 13.81 ± 0.90 (1.13) 14.06 ± 1.09 (1.29) 0.85 ± 0.05 (0.05) − 33.0 ± 12.0 (11.74) − 31.0 ± 10.5 (11.17) 2M17254242 − 1331201 0.90 4.5 ± 0.5 − 7.9 − 0.40 ± 0.05 − 5.35 ± 0.04 1.06 ± 0.13 (0.45) 4.04 ± 0.35 (0.35) 1.22 ± 0.16 (0.20) 0.57 ± 0.03 (0.10) − 68.0 ± 15.5 (11.73) − 30.0 ± 4.5 (11.90) 2M18524618 − 2520372 1.00 6.6 ± 0.8 19.1 0.06 ± 0.07 − 5.25 ± 0.06 0.35 ± 0.32 (0.28) 2.66 ± 0.36 (0.31) 1.55 ± 0.16 (0.18) 0.76 ± 0.18 (0.15) − 31.0 ± 11.5 (10.93) − 8.0 ± 10.5 (10.89) 2M14063545 + 2734116 0.91 11.0 ± 1.1 − 160.0 0.23 ± 0.05 − 3.17 ± 0.05 2.20 ± 0.19 (0.21) 16.79 ± 1.42 (1.33) 15.17 ± 1.55 (1.50) 0.77 ± 0.03 (0.03) − 85.0 ± 5.0 (6.11) − 79.0 ± 5.0 (5.99) 2M16102218 − 2158014 1.13 3.0 ± 0.4 153.2 0.85 ± 0.10 − 4.73 ± 0.07 1.60 ± 0.70 (0.51) 9.19 ± 0.85 (0.69) 2.31 ± 0.13 (0.40) 0.67 ± 0.08 (0.06) − 111.0 ± 13.5 (12.07) − 55.0 ± 22.0 (17.38) 2M02593571 − 1731458 1.00 7.5 ± 0.6 327.7 2.39 ± 0.04 − 1.50 ± 0.05 3.24 ± 0.17 (0.16) 30.91 ± 0.74 (0.71) 25.88 ± 0.91 (0.99) 0.81 ± 0.01 (0.01) − 137.0 ± 5.0 (5.10) − 135.0 ± 5.5 (5.39) 2M22015198 − 1141479 0.98 5.4 ± 0.6 − 76.4 3.27 ± 0.07 − 3.02 ± 0.07 1.27 ± 0.27 (0.41) 8.35 ± 0.25 (0.37) 5.21 ± 0.84 (0.82) 0.73 ± 0.04 (0.07) − 70.0 ± 15.0 (14.83) − 37.0 ± 8.0 (12.60) 2M16112935 − 2000538 1.08 5.4 ± 1.0 44.0 3.99 ± 0.08 − 9.61 ± 0.05 0.75 ± 0.57 (0.63) 7.48 ± 0.61 (0.93) 5.02 ± 1.48 (1.73) 0.81 ± 0.13 (0.13) − 41.0 ± 23.0 (22.97) − 23.0 ± 21.5 (22.53) 2M06572697 + 5543115 0.96 2.1 ± 0.2 − 239.3 10.03 ± 0.06 − 14.92 ± 0.05 0.55 ± 0.23 (0.26) 14.76 ± 0.96 (0.84) 2.42 ± 0.65 (0.86) 0.92 ± 0.03 (0.03) − 41.0 ± 8.0 (15.33) − 23.0 ± 12.5 (18.93) 2M17431262 − 2843363 .. . .. . 1.2 .. . .. . .. . .. . .. . .. . .. . .. . 2M17475763 − 2913591 .. . .. . − 114.1 .. . .. . .. . .. . .. . .. . .. . .. . 2M17480799 − 2712083 .. . .. . 24.1 .. . .. . .. . .. . .. . .. . .. . .. . 2M17484544 − 2915516 .. . .. . − 218.7 .. . .. . .. . .. . .. . .. . .. . .. . 2M18035017 − 2552334 .. . .. . − 153.8 .. . .. . .. . .. . .. . .. . .. . .. .
Appendix D: Comparisons to
ASPCAP
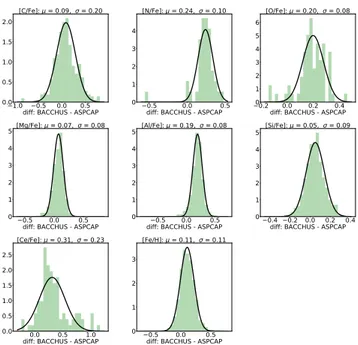
Fig. D.1.Violin diagram showing the differences between the derived
elemental abundances between our analysis with the BACCHUS code against those values of the ASPCAP pipeline for our 29 Al-rich stars. Each violin representation indicates with horizontal lines the median and limits of the distribution. The horizontal shaded regions show the typical errors of+0.05 dex, and +0.1 dex found by the ASPCAP pipeline.
1.0 0.5 0.0 0.5 diff: BACCHUS - ASPCAP 0.0 0.5 1.0 1.5 2.0 [C/Fe]: = 0.09, = 0.20 0.5 0.0 0.5 diff: BACCHUS - ASPCAP 0 1 2 3 4 [N/Fe]: = 0.24, = 0.10 0.2 0.0 0.2 0.4 diff: BACCHUS - ASPCAP 0 1 2 3 4 5 6 [O/Fe]: = 0.20, = 0.08 0.5 0.0 0.5 diff: BACCHUS - ASPCAP 0 1 2 3 4 5 [Mg/Fe]: = 0.07, = 0.08 0.5 0.0 0.5 diff: BACCHUS - ASPCAP 0 1 2 3 4 5 [Al/Fe]: = 0.19, = 0.08 0.4 0.2 0.0 0.2 0.4 diff: BACCHUS - ASPCAP 0 1 2 3 4 5 [Si/Fe]: = 0.05, = 0.09 0.0 0.5 1.0 diff: BACCHUS - ASPCAP 0.0 0.5 1.0 1.5 2.0 2.5 [Ce/Fe]: = 0.31, = 0.23 0.5 0.0 0.5 diff: BACCHUS - ASPCAP 0
1 2 3
[Fe/H]: = 0.11, = 0.11
Fig. D.2. Differences in abundances produced by the BACCHUS and ASPCAP for a control sample of ∼1000 giants belonging to the main body of the MW (halo, disc and bulge), at the same metallicity range as examined in this study. The numbers in each title of each panel indi-cate the peak (µ) and the standard deviation (σ) of the fitted normal distribution, showing that ASPCAP values are significantly offset from the BACCHUS ones.
FigureD.1compares our abundance determinations with those of APOGEE DR16 (Ahumada et al. 2020). The differences are shown as a density estimation in a violin representation, whereby the median, minimum, and maximum differences of each chem-ical species are marked. We find that the [Fe/H] metallicities we derive are in excellent agreement with ASPCAP pipeline, with a median distribution slightly higher than the reported by DR16, but within the typical error (±0.05 dex) determined by the ASPCAP pipeline. Furthermore, this indicates that we reproduce the precision of the ASPCAP pipeline for the iron lines. However, there are significant differences in the range of certain abundance ratios comparing BACCHUS to ASPCAP. For example, [N, O, Al, Si, Ce/Fe] ratios derived with BACCHUS are ∼0.1−0.75 dex higher than the ASPCAP values, while [O, Mg/Fe] are ∼0.05−0.4 dex lower than ASPCAP determinations, possibly due to some issues with the accuracy (zero-point) of ASPCAP abundances, limits of the model grid (Jönsson et al. 2018), and/or the difficulty of fit-ting lines where the intensity is comparable to the variance. For a more detailed discussion, we refer the reader toMasseron et al. (2019). While the ASPCAP pipeline uses a global fit to the con-tinuum in the three detector chips independently, the BACCHUS pipeline places the pseudo-continuum in a region around the lines of interest. We believe that our manual method is more reli-able, since it avoids possible shifts in the continuum location due to imperfections in the spectral subtraction along the full spectral range.
FigureD.2shows the typical offset of each chemical species between the BACCHUS and ASPCAP pipeline for a control sample of ∼1000 metal-poor stars (−2 . [Fe/H] ∼ −0.7) belonging to the main components of the MW (halo, disc and bulge). We find that ASPCAP significantly underestimates most of the chemical species by about ∼0.1 to 0.3 dex for most of the metal-poor stars (although seeNataf et al. 2019, for an alternative view). Such offsets were taken into consideration for the whole MW stars presented in Fig.1.
Appendix E: Al I features
Figure E.1 provides a brief examination of typical H-band spectra for five Al-rich stars and Al-normal stars that exhibit clear Al I spectral absorption features. This figure reassures us of the existence of a real chemical peculiarity in the rich stars. The spectra of these stars are compared in a wavelength range containing several Al I lines, i.e. at 1.67189, 1.67505 and 1.67633 µm, which are indicated by the cyan shadow region. Remarkably, the Al-rich stars have relatively strong Al I lines compared to Al-normal stars with the same atmospheric param-eters. This can only be attributed to a difference in aluminium abundance.
1.6710 1.6715 1.6720 1.6725
Wavelength ( m)
0.5
1.0
Normalized Flux
1.67189 m 2M17254242-1331201 2M11032678-12374681.6745 1.6750 1.6755
Wavelength ( m)
0.5
1.0
Normalized Flux
1.67505 m1.6755 1.6760 1.6765 1.6770
Wavelength ( m)
0.5
1.0
Normalized Flux
1.67633 m1.6710 1.6715 1.6720 1.6725
Wavelength ( m)
0.5
1.0
Normalized Flux
1.67189 m 2M17425767-2803437 2M05523342+24591661.6745 1.6750 1.6755
Wavelength ( m)
0.5
1.0
Normalized Flux
1.67505 m1.6755 1.6760 1.6765 1.6770
Wavelength ( m)
0.5
1.0
Normalized Flux
1.67633 m1.6710 1.6715 1.6720 1.6725
Wavelength ( m)
0.5
1.0
Normalized Flux
1.67189 m 2M18035017-2552334 2M16331701-29575571.6745 1.6750 1.6755
Wavelength ( m)
0.5
1.0
Normalized Flux
1.67505 m1.6755 1.6760 1.6765 1.6770
Wavelength ( m)
0.5
1.0
Normalized Flux
1.67633 m1.6710 1.6715 1.6720 1.6725
Wavelength ( m)
0.5
1.0
Normalized Flux
1.67189 m 2M19010991-2121082 2M12135565+06322011.6745 1.6750 1.6755
Wavelength ( m)
0.5
1.0
Normalized Flux
1.67505 m1.6755 1.6760 1.6765 1.6770
Wavelength ( m)
0.5
1.0
Normalized Flux
1.67633 m1.6710 1.6715 1.6720 1.6725
Wavelength ( m)
0.5
1.0
Normalized Flux
1.67189 m 2M15535622+2237419 2M16493657-20281461.6745 1.6750 1.6755
Wavelength ( m)
0.5
1.0
Normalized Flux
1.67505 m1.6755 1.6760 1.6765 1.6770
Wavelength ( m)
0.5
1.0
Normalized Flux
1.67633 mFig. E.1.Comparison between the spectra of a normal (blue) and an Al-rich (black) star, with similar stellar parameters around Al I absorption lines at 1.67189, 1.67505 and 1.67633 µm. The last row shows the typical spectrum of a bulge NRS (blue) with low aluminium enrichment from
![Fig. 1. Kernel density estimation of [X/Fe] (with X = C, N, O, Mg, Al, Si, or Ce) with metallicity (a–g), and [Al/Fe] as a function of [Mg,N/Fe]](https://thumb-eu.123doks.com/thumbv2/123doknet/14760127.584622/4.892.113.778.127.732/fig-kernel-density-estimation-fe-mg-metallicity-function.webp)