HAL Id: hal-02356097
https://hal.archives-ouvertes.fr/hal-02356097
Submitted on 8 Nov 2019
HAL is a multi-disciplinary open access
archive for the deposit and dissemination of
sci-entific research documents, whether they are
pub-lished or not. The documents may come from
teaching and research institutions in France or
abroad, or from public or private research centers.
L’archive ouverte pluridisciplinaire HAL, est
destinée au dépôt et à la diffusion de documents
scientifiques de niveau recherche, publiés ou non,
émanant des établissements d’enseignement et de
recherche français ou étrangers, des laboratoires
publics ou privés.
Jet-cooled rovibrational spectroscopy of methoxyphenols
using two complementary FTIR and QCL based
spectrometers
P. Asselin, J Bruckhuisen, A Roucou, M. Goubet, M.-A. Martin-Drumel, A
Jabri, Y Belkhodja, P Soulard, Robert Georges, A Cuisset
To cite this version:
P. Asselin, J Bruckhuisen, A Roucou, M. Goubet, M.-A. Martin-Drumel, et al.. Jet-cooled
rovi-brational spectroscopy of methoxyphenols using two complementary FTIR and QCL based
spec-trometers. Journal of Chemical Physics, American Institute of Physics, 2019, 151 (19), pp.194302.
�10.1063/1.5128196�. �hal-02356097�
Jet-cooled rovibrational spectroscopy of
methoxyphenols using two complementary FTIR and
QCL based spectrometers
P. ASSELIN
1, J. BRUCKHUISEN
1, A. ROUCOU
2,*, M. GOUBET
3, M.-A. MARTIN-DRUMEL
4, A.
JABRI
1,2,**, Y. BELKHODJA
1, P. SOULARD
1, R. GEORGES
5,
ANDA. CUISSET
21Laboratoire MONARIS, UMR-CNRS 8233, Sciences Sorbonne université, Paris, Université Pierre et Marie Curie, 75252, Paris, France. 2Laboratoire de Physico-Chimie de l’Atmosphère, EA-4493, Université du Littoral Côte d’Opale, 59140 Dunkerque, France.
*Present address: Faculté des sciences, Institute of Condensed Matter and Nanosciences, Louvain la Neuve, Belgium 3Université de Lille, CNRS, UMR8523 PhLAM Physique des Lasers Atomes et Molécules, F-59000 Lille, France
4Institut des Sciences Moléculaires d’Orsay (ISMO), CNRS, Univ. Paris-Sud, Université Paris-Saclay, F-91405 Orsay, France **Present address: Grupo de Espectroscopia Molecular, Universidad de Valladolid, Spain
5Université de Rennes, CNRS, IPR (Institut de Physique de Rennes) - UMR 6251, F-35000 Rennes, France.
Contact corresponding author(s):[email protected]
Final accepted article compiled on November 8, 2019
Published in: The Journal of Chemical Physics tbd, tbd (2019) https://doi.org/10.1063/1.5128196
Methoxyphenols (MP) are a significant component of biomass burning emissions which mainly exists in our atmosphere in the gas phase where they contribute to the formation of secondary organic aerosols (SOA). Rovi-brational spectroscopy is a promising tool to monitor atmospheric MPs and infer their role in SOAs formation. In this study, we bring a new perspective on the rovibrational analysis of MP isomers by taking advantage of two complementary devices combining jet-cooled environments and absorption spectroscopy: the Jet-AILES and the SPIRALES setups. Based on Q-branches frequency positions measured in the Jet-AILES FTIR spectra and guided by quantum chemistry calculations, we propose an extended vibrational and conformational analysis of the different MP isomers in their fingerprint region. Some modes such as far-IR out-of-plane -OH bending or mid-IR in-plane -CH bending allow to assign individually all the stable conformers. Finally, using the SPIRALES setup with three different EC-QCL sources centered on the 930–990 cm−1and the 1580–1690 cm−1ranges, it was possible to proceed to the rovibrational analysis of the ν18 ring in-plane bending mode of the MP meta isomer
providing a set of reliable excited state parameters which confirms the correct assignment of two conformers. In-terestingly, the observation of broad Q-branches without visible P- and R- branches in the region of the C–C ring stretching bands was interpreted as being probably due to a vibrational perturbation. These results highlight the complementarity of broadband FTIR and narrowband laser spectroscopic techniques to reveal the vibrational conformational signatures of atmospheric compounds over a large infrared spectral range.
1. INTRODUCTION
Methoxyphenols (H3CO–C6H4–OH, MP) are aromatic
oxy-genated compounds present in our atmosphere in their three isomeric forms: 2MP (also called guaiacol), 3MP, and 4MP (also called mequinol), which designate the ortho, meta and para isomers. MPs have a high emission rate from biomass burning and mainly exist in the gas phase. [1,2] MPs contribute to the secondary organic aerosols (SOA) formation in the
at-mosphere via OH-oxydation processes [3,4]. The ability to monitor in the atmosphere MPs as SOA precursors is required to fully understand the SOA atmospheric chemical cycle and thus infer their impact on the climate. Compared to lighter volatile organic compounds, it is not currently possible to detect and quantify MPs in the atmosphere by measuring their high resolution rovibrational signatures using on-board instruments such as IASI/MetOp [5] or ACE-FTS[6] sounders.
A key parameter for atmospheric monitoring of molecules is the rovibrational cross-sections that can be determined from rovibrational measurements in the laboratory. For MPs, only vibrational cross-sections have been determined so far. Their measurements were performed using synchrotron-based room-temperature Fourier-transform infrared (FTIR) absorption spec-troscopy on the AILES beamline at the synchrotron SOLEIL [7]. These cross-sections were determined at low resolution (0.5 cm−1) by integrating the rovibrational patterns but it was never possible to fully resolve the rotational structure even at the maximal resolution of the interferometer (0.001 cm−1) due to the huge density of states populated at ambient temperature. Furthermore, the different conformers of each isomer could not be distinguished. Only millimeter-wave (mmw) spectroscopy allowed to fully resolve Doppler limited rotational structure at 300 K. as demonstrated recently with a full conformational analysis in the ground and in the lowest energy vibrational states of the three MP isomers using mmw absorption and emission spectroscopies [8,9]. These studies emphasized the congestion of lines in MPs spectra due to rather small rotational constants and the presence of several conformers and pure rotational tran-sitions within the low-lying vibrational excited states. To the best of our knowledge, the only high resolution rovibrational data on MPs have been obtained at low temperature by the group of T. Zwier [10] and the group of M. Schmitt [11,12] using respectively free-jet fluorescence dip infrared spectroscopy and molecular beam rotationally resolved electronic spectroscopy. While the first group focused on the anharmonic coupling in the C-H stretch region, the second group provides MP conforma-tional analyses in the electronically excited states.
In the present study, we investigate MPs rovibrational spectra at low temperature by taking advantage of two complementary supersonic jet devices associated to two different infrared spec-troscopic methods: (i) the Jet-AILES apparatus, coupled to the AILES beamline at synchrotron SOLEIL, which was used for low resolution broadband FTIR scans of the three MP isomers in the fingerprint region (900-1700 cm−1); and (ii) the SPIRALES setup, with mid-IR external cavity quantum cascade laser (EC-QCL) sources coupled to a pulsed molecular jet. The latter setup allowed to fully resolve the ν18IR band of 3MP centered
at 950 cm−1, to fit the rotational constants in this in-plane ring bending mode and to assess the conformational landscape pre-viously determined.[8] Moreover, using a second QCL source centered around 1610 cm−1, strong rovibrational broadenings have been observed for the ν36and ν37modes, highlighting a
likely vibrational perturbation. In the following, a brief descrip-tion of experimental and theoretical methods is presented in a first section. Experimental results will be detailed and dis-cussed in a second section: first, the vibrational/conformational assignment of the broadband Jet-AILES FTIR spectra; then, the high-resolution analyses of the ν18, ν36and ν37bands of 3MP
measured by the SPIRALES setup.
2. METHODS
A. Experimental measurements
Commercially available MP isomers with stated purities higher than 98% were purchased from Acros Organics. Further purifi-cation was performed by continuous pumping over the samples for about 24 h in order to eliminate methanol traces. Due to the low volatility of MP compounds, liquid 2MP and 3MP (138 and 27 µbar of room temperature vapor pressure [13]) and solid 4MP (9 µbar [13]) samples were heated in all experiments.
A.1. Jet-AILES setup
Jet-cooled spectra were recorded using the Jet-AILES apparatus, a continuous molecular jet experiment coupled to the high-resolution Bruker IFS 125 FTIR spectrometer installed on the AILES beamline of the SOLEIL synchrotron facility. This setup was previously described in detail[14,15] thus only relevant parameters to the present study are reported here. A slit nozzle of 60 mm length and 130 µm width is used to expand the sample seeded in a buffer gas into an expansion chamber continuously evacuated by a set of roots pumps. The flow of liquid samples (2MP and 3MP) vapor through the nozzle is regulated using a Controlled Evaporation Mixer (CEM) supplied by regulated flows of argon or helium as buffer gas and liquid MP. 2MP and 3MP samples are respectively heated to 373 K and 413 K. The injection line between the CEM and the slit is also heated at these temperatures to prevent condensation. For solid 4MP, an oven heated up to 438 K is used instead of the CEM. Such heating enabled to reach vapor pressure levels as high as about 10 mbar for each MP, a necessary condition to record their vibrational spectra with a sufficient signal-to-noise ratio (SNR). Spectra are recorded with flows of the buffer gas ranging from 5 to 30 standard l.min−1(slm). The reservoir and chamber pressures are typically maintained around 70 mbar and 0.1 mbar, respectively, resulting in a rotational temperature of about 30 K. High-resolution (0.001 cm−1) tests were performed but the limited sensitivity of the continuous jet-FTIR setup (sin-gle pass through the expansion) prevented from a sufficient SNR to be achieved. Consequently, for each sample and each expansion condition, a jet-cooled FT spectrum con-sisting of 200 co-added interferograms was recorded at 0.1 cm−1 resolution. The most suitable combination of in-frared source/beamsplitter/detector combination, namely Glo-bar/Mylar/Si bolometer and Globar/KBr-Ge/HgCdTe was used for the far-IR (150–650 cm−1) and the mid-IR (1000–1700 cm−1) regions, respectively.
A.2. SPIRALES setup
The SPIRALES spectrometer, which couples an EC-QCL and a pulsed supersonic jet, proved to be an extremely sensitive probe of low temperature rovibrational spectra of heavy polyatomic molecules and molecular complexes[16,17]. The main char-acteristics of the instrument are summarized in the following paragraph. The absorption light source is a continuous-wave room-temperature mode-hop-free EC-QCL (Daylight Solutions) of 10 MHz spectral width. In the present study, three EC-QCLs were used which cover the following spectral ranges: 930–990 cm−1(Model 21106 MHF), 1580–1640 cm−1(Model
41062-MHF) and 1620-1690 cm−1(Model 21060-MHF). About 8% of the total light power was sent through two laser channels for rel-ative and absolute frequency calibrations. Absolute frequency calibration was achieved by comparing the frequency deviation of lines of C2H4(in the the 930–990 cm−1 range) and NH3
and H2O (in the 1580–1690 cm−1range) between
experimen-tal and well-known standard (from the HITRAN2012 database [18]).This procedure allows to correct the free spectral range value of the reference fixed at the beginning of each experiment. The remaining light is sent through a multi pass astigmatic cavity accorded to a 182-pass pattern which crosses almost perpendicularly the jet expansion. Jet-cooled MP molecules were probed over axial distances between 5 and 15 mm from the nozzle exit due to the relatively large zone covered by the optical cavity. The molecular jet was produced using a pulsed 1 mm diameter pin hole nozzle from General Valve Series 9 model, controlled by a valve driver (Iota One, Parker Hannifin). MP compounds were seeded in the supersonic jet using a brass block fitted to a Dural reservoir filled with 0.5 g of sample. The reservoir located close upstream to the expansion zone was heated up to 420 K to increase the sample vapor pressure which was then carried away by argon. Typical conditions used in this work were about 1 % of MP in 0.15 MPa of Ar. The seeded mixture was then cooled down by converting the circular flow of the standard valve configuration into a planar expansion using a multichannel interface ended with two modified industrial blades, forming a 30 mm length and 150 µm width slit aperture. Guided by calculated anharmonic frequencies and intensities of MP compounds in the fingerprint region, band intensities of ν18, ν36and ν37transitions of 4MP are expected to be weak.
As a consequence, only 3MP and 2MP were investigated in the available spectral range of our EC-QCLs. Spectra were recorded using a rapid scan scheme similar to previous designs developed for high resolution molecular spectroscopy [19,20]. Spectra are recorded by driving the piezo-electic transducer of the EC-QCL diffraction grating with a 100 Hz sine wave. This allows the QCL frequency to be scanned once per period over 0.8 cm−1 with a frequency sampling of about 3 MHz. A baseline-free transmittance through the multipass cavity is obtained by taking the ratio of signals recorded in the presence and absence of the jet. The accuracy of the frequency calibration is around 0.0015 cm−1slightly degraded by the Doppler broadening from non orthogonal laser and planar jet crossings in the multi pass optical cavity.
B. Quantum chemical calculations
High level of theory quantum chemical calculations on MPs were performed using the Gaussian 16 package [21] and have already been described elsewhere. [8,9] Briefly, optimized equi-librium structures and vibrational frequencies were calculated using the B3LYP functional and Dunning correlation consistent basis set cc-pVTZ [22]. This functional/basis set combination has proven to be extremely reliable in the computational study on the molecular conformations of phenolic compounds [23]. Here, the optimization process used the tight SCF convergence criterion and ultrafine grid to provide energies in the fundamen-tal electronic state, rotational constants and dipole moments of
the stable conformers as well as conformational barriers. An-harmonic frequencies, determined with the VPT2 method[24] as implemented in Gaussian 16, have been computed using the same level of theory.
3. RESULTS AND DISCUSSION
A. Broadband low resolution Jet-AILES spectra
A.1. Determination of optimum flow conditions
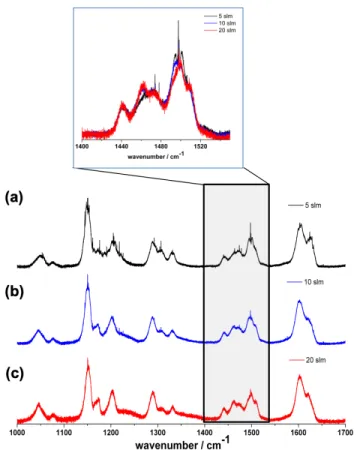
The 3MP isomer spectrum has been investigated under various experimental conditions to optimize the SNR of the recorded MPs vibrational spectra. Fig.1displays an example of 3MP jet-cooled mid-IR spectra measured for three different mass flow rates of Ar buffer gas. Several Q-branches are distinguishable on all spectra, but these Q-branches became readily observed with a rather good SNR on the 5 slm of Ar spectrum (see Fig.1a). When using Ar flow rates of 10 and 20 slm, additional bands, absent from the 5 slm spectrum, can be observed (see e.g. the band around 1460 cm−1on the inset of Fig.1). These bands are most likely resulting from argon coating, i.e. the formation of 3MP–(Ar)ncomplexes, n ≥ 1 [25,26]. Q-branches are clearly
observed with a rather good SNR owing to an absence of MP– (Ar)nhetero complexes at lower dilution of the MP/Ar mixture.
Both to ensure a good rotational cooling and to prevent the formation of Ar complexes, flow of 5 slm of Ar appears to be most suitable to investigate the remaining MP compounds.
Far-IR and mid-IR Jet-AILES spectra of 3MP have also been recorded with He as buffer gas in order to select the most adapted carrier gas. In similar experimental conditions, use of Ar gas resulted in higher SNR , thus this carrier was used in subsequent measurements.
A.2. Rovibrational cooling
In Fig.2, 3MP spectra in jet-cooled conditions are compared with the room-temperature spectra obtained previously [7] to assess the rovibrational cooling in the supersonic expansion. While at first glance the overall contour of the vibrational bands appears mostly similar in both conditions, revealing the probing of thermalized gas within the boundary layer of the expansion, significant rovibrational cooling can be assessed from the pres-ence of narrow Q-branches in the spectra. In the far-IR (see Fig.
2a), these branches are even the only significant contribution that can be distinguished. Moreover, the complex Q-branch structure observed in the room temperature spectrum is strongly reduced in jet-cooled conditions, corresponding to a strong de-crease of hot bands intensities.
A.3. Vibrational and conformational analysis
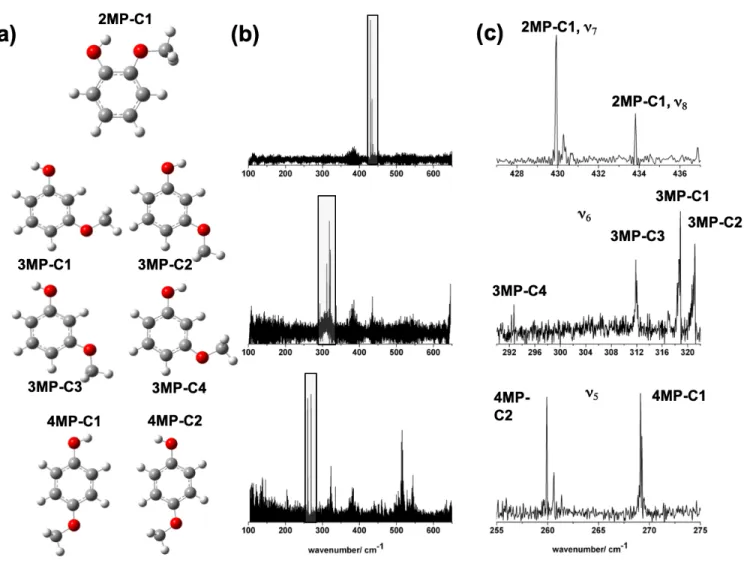
Jet-AILES far-IR and mid-IR spectra of the three MP isomers are displayed in Fig.3and Fig.4, respectively. The vibrational spectra in the mid-IR region are of better quality, in terms of SNR, than in the far-IR, as expected from the presence of more intense modes and a higher FT sensitivity (IR source, detector). An enlarged view of the strongest Q-branches associated with the out-of-plane OH bending modes is also presented in Fig.3c.
As previously demonstrated by the room temperature spectra[7], the far-IR region exhibits very different rovibrational
Fig. 1. Evolution of the 3MP Jet-AILES mid-IR spectra (1000–
1700 cm−1) for three different flow rates of Ar: 5 slm (in black, Fig. 1a), 10 slm (in blue, Fig. 1b), and 20 slm (in red, Fig. 1c); from top to bottom. Inset: Zoom onto the 1400–1550 cm−1 region revealing narrow Q branches at lower dilution and the possible formation of MP-(Ar)ncomplexes (as evidenced by the
apparition of a band around 1460 cm−1) at higher Ar flow rates.
signatures for 2MP, 3MP and 4MP with a strong dependence of the out-of-plane OH bending modes to the isomeric forms. In addition to the previous room-temperature investigation[7], jet-cooled spectra enable both a determination of band centers at the instrumental accuracy (sharp Q-branches thanks to strongly re-duced thermal shift/broadening), 0.1 cm−1in the present study, and the investigation of the conformational landscape of MPs (discrimination of the contribution of each conformer accord-ing to jet conditions). The anharmonic predictions (B3LYP/cc-pVTZ) facilitate the band assignment in the mid-IR region while the low-frequency modes in the far-IR region are essentially assigned on the basis of the harmonic predictions (see details hereafter). We base our conformational analysis on the rela-tive frequency difference (using the calculated values) between each conformer of a given MP for a given vibrational mode. The analysis of the spectra of each MP isomer is detailed here-after. Tables1-3report the conformer dependent band center assignments of the three MP compounds.
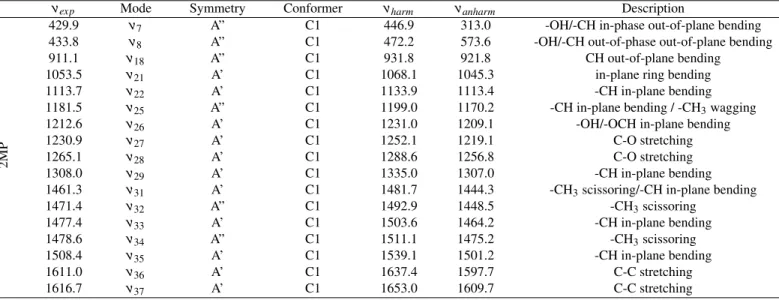
With only one stable conformer denoted 2MP-C1 stabilized by an intramolecular hydrogen bond [17], 2MP exhibits the most simple far-IR spectrum. In the far-IR, two main signals are observed at 429.9 cm−1and 433.8 cm−1corresponding to the Q-branches of the out-of-plane OH bending modes: in-phase
ν7and out-of-phase ν8, respectively (with respect to the
out-of-plane CH ring deformations). In the mid-IR, 15 signals have been assigned at the instrumental accuracy thanks to the narrow Q-branches observed in jet-cooled conditions (see Table1).
The 3MP isomer exhibits the richest conformational land-scape with four stable conformers at room temperature, namely 3MP-C1 to 3MP-C4 (see Fig.3a), as evidenced by previous rota-tionally resolved spectroscopic studies [8,11]. In the far-IR, the ν6out-of-plane OH bending mode has a very strong band
inten-sity (Iharm> 90 km/mol) compared to the other low-frequency
vibrations (Iharm< 10 km/mol) which are most probably below
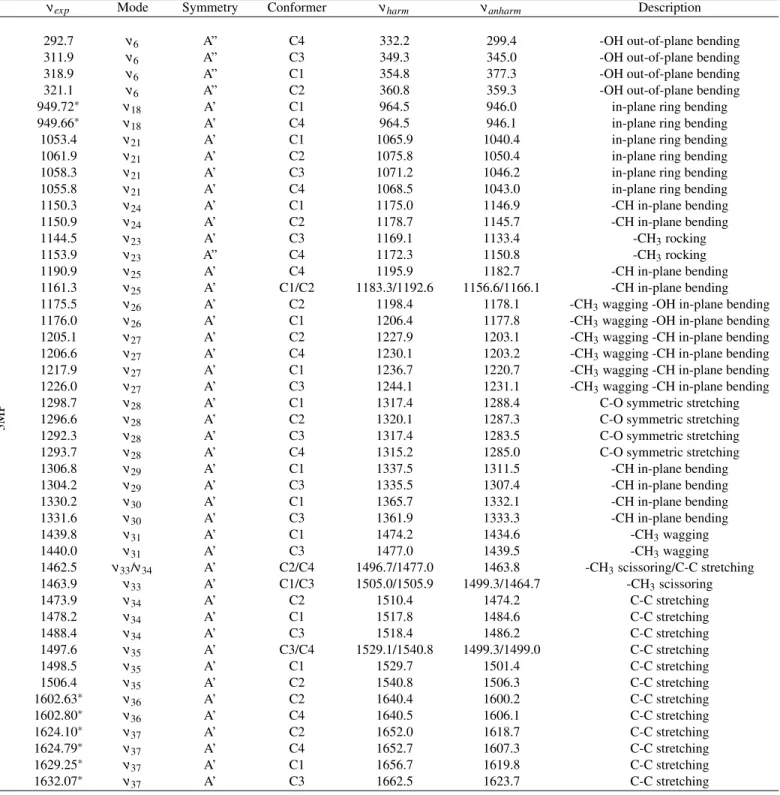
our detection limit. Therefore, the four signals observed at 318.9 cm−1, 321.1 cm−1, 311.9 cm−1and 292.7 cm−1(see Fig.3c) can be assigned to the C1, C2, C3 and C4 conformers of 3MP, respectively, according to the relative populations determined in the ground state (GS) [8] and to the calculated harmonic frequencies and intensities (see supplementary materials Tables S2-S5). Due to the nearly same harmonic intensities of four conformers in the case of the ν6mode, relative observed
inten-sities should mainly reflect the population distribution in the jet. Comparison with the relative population of 3-MP determined at room temperature in the GS [8], those observed for the ν6mode
in jet-cooled conditions (Fig. 3c) are quite similar and follow the same rating, suggesting that the barriers are enough high that no interconversion takes place in the collision zone before the expansion. Moreover, although Ar is a seeding gas often used to favor the most stable species, no enhancement of C1 conformer is evidenced, probably due to the low backing pressures (about 100 mbar) of Jet-AILES. In the mid-IR, a conformational as-signment of the 40 observed Q-branches is tentatively proposed and summarized in Table2. The four conformers signatures are individually assigned for some mid-IR vibrational modes such as the ν21in-plane ring bending, ν27CH3wagging/in-plane CH
bending or ν28C-O symmetric stretching. Nevertheless, due
to a strong congestion of the spectrum because of overlapping bands, the full conformational discrimination is delicate for some modes such as the ν18in-plane ring bending, ν33 CH3
scissoring or ν35−37C-C stretchings.
For the 4MP isomer, two stable conformers 4MP-C1 and 4MP-C2 are expected corresponding respectively to the cis and the trans orientations of the –OCH3and –OH groups (see
Fig.3a). Only the most stable C1 conformer (cis) was observed by mmw spectroscopy. The C2 conformer (trans) has a per-manent dipole moment five times weaker than C1 and this is likely why it was not detected.[9] This problem does not arise with the 4MP rovibrational Jet-AILES spectrum, which reveals two Q-branches with similar intensities linked to the strong transition moment of the ν5 out-of-plane OH bending mode
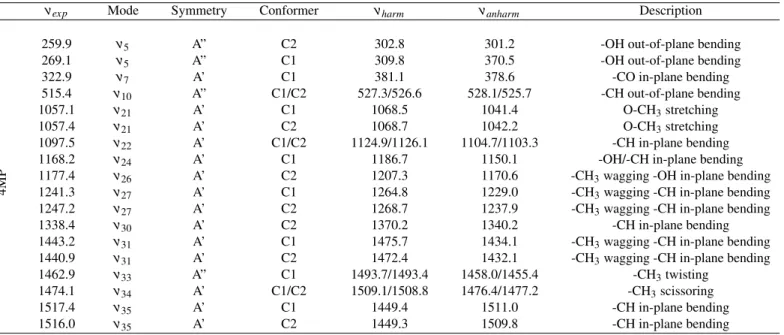
of 4MP-C1 and 4MP-C2 at 269.1 cm−1 and 259.9 cm−1, re-spectively (see Fig.3c). The 9.2 cm−1separation between the Q-branches of the two conformers is in rather good agreement with the B3LYP/cc-pVTZ harmonic calculations which predict 4MP-C2 red-shifted from 4MP-C1 by 7 cm−1(see Table3). In the absence of other intense fundamentals in the out-of-plane OH bending mode region, the weaker satellite bands observed on the blue side of the ν5band are probably due to hot bands
Fig. 2. Comparison of 3MP FT spectra recorded at room temperature[7] (in red) and in supersonic-jet conditions with a 5 slm flow of Ar buffer gas (in black). Fig. 2a: Zoom into a portion of the far-IR region (240–340 cm−1); Fig. 2b: Zoom onto a portion of the mid-IR region (1400–1550 cm−1). For visibility, the four spectra are normalized to the Q-branch of strongest intensity.
the series observed for 4MP-C2 at 259.92, 260.61 and 261.37 cm−1which displays a diagonal anharmonicity χ55of 0.34(1)
cm−1. Weaker Q-branches were also observed at higher fre-quencies and were assigned to the ν7in-plane –CO bending and
ν10out-of-plane –CH bending modes of 4MP. For these modes,
it was not possible to discriminate the two conformers. In the mid-IR, 14 bands were measured in jet-cooled conditions. The vibrational signatures of the 4MP-C1 and 4MP-C2 conformers are however clearly discriminated for some specific modes such as the ν21 O-CH3stretching, ν27 CH3 wagging/in-plane CH
bending or ν35in-plane CH bending.
On the grounds of 80 previous vibrational FTIR assignments reported in Tables1,2and3, the average error between observed and calculated anharmonic frequencies could be estimated to about 15.7 % (11.4 % for harmonic calculations) in the far-IR domain and about 0.5 % (2.0 % for harmonic calculations) in the mid-IR domain. Moreover, in the case of a full conforma-tional landscape assignment (ν6,ν21, ν27, ν28modes for 3MP
and ν5,ν21, ν27, ν31, ν35 modes for 4MP), we considered the
differences between the highest and lowest calculated frequency of the stable conformers for a given vibrational mode, the RFD, which display far-IR average errors of about 470% with anhar-monic calculations (150% for haranhar-monic) with respect to the experimental ones. In the mid-IR, the average errors are about 40% both for harmonic and anharmonic calculations. The relia-bility of this parameter is crucial to validate the vibrational as-signments. We compared systematically the experimental RFD (especially in the case of a full conformational assignment) to the calculated harmonic and anharmonic ones to choose the best type of calculation. The largest average errors evidenced in the far-IR confirm that low order perturbation theory calculations (VPT2) lack of accuracy in the case of low-lying large ampli-tude motions.[24] In these cases, since the harmonic (quadratic) term is the leading term in the series expansion of the potential,
harmonic frequency values may be preferred. On the contrary, in the mid-IR, anharmonic calculations improve the prediction of the MP vibrational band centers and facilitate the conforma-tional assignment.
B. High resolution SPIRALES spectra
Two types of vibrations of the MP compounds are accessible within the spectral range of the available SPIRALES EC-QCLs: the in-plane ring bending mode (ν18) and the C–C ring
stretch-ing modes (ν36, ν37) in the 930–960 cm−1 and 1580–1640
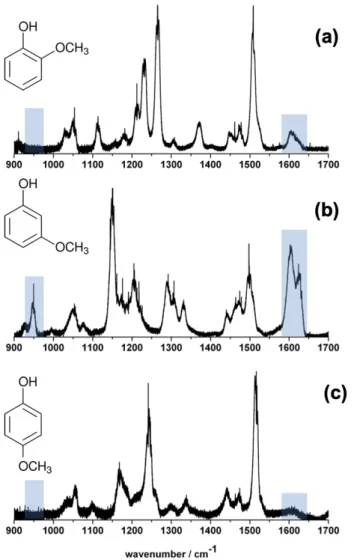
cm−1regions, respectively. The Q-branches identified in the Jet-AILES spectra enable to evaluate more precisely which MPs rovibrational signatures can be reached with the SPIRALES setup. As can be seen in Fig.4b, only the 3MP isomer displays intense bands likely to be rotationally resolved in these regions. We thus present hereafter the results obtained from jet-cooled QCL spectroscopy of 3MP.
B.1. Rovibrational analysis of theν18band of 3MP
In the spectrum recorded by the SPIRALES setup around 950 cm−1, the rotational structure in the ν18band of 3MP is indeed
resolved: two Q-branches spaced by 0.07 cm−1(Fig. 5b) are clearly observed, which suggests the presence of two conform-ers of 3MP. The bands are assigned to the ν18band of 3MP-C1
and 3MP-C4 on grounds of anharmonic calculations which pre-dict these conformers bands very close in frequency, and about 20 cm−1higher in frequency than 3MP-C2 and 3MP-C3. Two weaker bands appear red shifted by 0.45 cm−1 from the two fundamental Q-branches. These weaker features were already observed, although unresolved, on the Jet-AILES spectrum (see Fig. 5a). The intensity ratio between these features and the assigned fundamental Q-branch of 3MP-C1 is 0.34, while it is 0.2 in the SPIRALES spectrum, a ratio 1.7 times lower than that of Jet-AILES spectrum. Such findings are in agreement
Fig. 3. Stable conformers and far-IR Jet-AILES spectra of the three MP isomers (2MP, 3MP, and 4MP, from top to bottom). Fig.
3a:Optimized structures of the identified stable conformers obtained from calculations at the B3LYP/cc-pVTZ level of theory and labeled in accordance with Ref. [8,9]; Fig. 3b: Full Jet-AILES far-IR absorbance spectra measured using 5 slm of Ar buffer gas; Fig. 3c:zoom on the strongest Q-branches associated with the c-type out-of-plane –OH bending modes (identified by a black rectangle on the full-range spectra).
with hot band features which are expected to be weaker under the pulsed expansion conditions of SPIRALES (more efficient vibrational cooling at a higher backing pressure) leading to a lower temperature of the pulsed jet compared to the continuous expansion of Jet-AILES. In the following paragraphs, we will define the R ratio by:
R= (IUB/IFB)Jet−AILES (IUB/IFB)SPIRALES
(1) where UB and FB refer to the undefined band and the fundamen-tal band, respectively. If R < 1, an undefined band observed in the SPIRALES spectrum is more intense than in the Jet-AILES spectrum, relative to the fundamental band, and is thus unlikely to be a hot band.
Using as initial set of parameters the v18=1 scaled rotational
constants from anharmonic B3LYP/cc-pVTZ predictions and GS experimental constants[8], the rovibrational spectrum of the ν18band of both 3MP-C1 and 3MP-C4 conformers has been
assigned using the PGOPHER[27] and LWWa [28] programs. A total of 766 3MP-C1 and 179 3MP-C4 rovibrational transitions corresponding respectively to 152 and 55 different frequencies have been assigned (see supplementary materials Tables S9-S10 for the list of assigned transitions). The difference between the number of assigned transitions and the number of different frequencies is due to unresolved asymmetric splitting, overlap of a- and b-type transitions, and Kaclustering. Spectroscopic
parameters were derived from a fit performed using the Pickett suite of programs [29] using a Watson-type semi-rigid rotor model (A-reduction in the Ir representation) developed up to quartic centrifugal distortion (CD) constants (Table4). All CD terms in v18=1 except for∆Jwere kept fixed at the GS
val-ues. Pure rotational transitions from Ref. [8] and rovibrational transitions in the ν18 band from this work were included in
the fit. Since multiple transitions are assigned to the same fre-quency, each line has been weighted according to its expected intensity at 30 K. A unique uncertainty on frequency of 0.0015
Table 1. Experimental (νexp) and calculated (νharmand νanharm) values at the B3LYP/cc-pVTZ level of the vibrational bands centers
of 2MP with the vibrational assignments. All frequencies were measured from the Q-branches observed on the Jet-AILES spectra. νexp Mode Symmetry Conformer νharm νanharm Description
2MP
429.9 ν7 A” C1 446.9 313.0 -OH/-CH in-phase out-of-plane bending
433.8 ν8 A” C1 472.2 573.6 -OH/-CH out-of-phase out-of-plane bending
911.1 ν18 A” C1 931.8 921.8 CH out-of-plane bending
1053.5 ν21 A’ C1 1068.1 1045.3 in-plane ring bending
1113.7 ν22 A’ C1 1133.9 1113.4 -CH in-plane bending
1181.5 ν25 A” C1 1199.0 1170.2 -CH in-plane bending / -CH3wagging
1212.6 ν26 A’ C1 1231.0 1209.1 -OH/-OCH in-plane bending
1230.9 ν27 A’ C1 1252.1 1219.1 C-O stretching
1265.1 ν28 A’ C1 1288.6 1256.8 C-O stretching
1308.0 ν29 A’ C1 1335.0 1307.0 -CH in-plane bending
1461.3 ν31 A’ C1 1481.7 1444.3 -CH3scissoring/-CH in-plane bending
1471.4 ν32 A” C1 1492.9 1448.5 -CH3scissoring
1477.4 ν33 A’ C1 1503.6 1464.2 -CH in-plane bending
1478.6 ν34 A” C1 1511.1 1475.2 -CH3scissoring
1508.4 ν35 A’ C1 1539.1 1501.2 -CH in-plane bending
1611.0 ν36 A’ C1 1637.4 1597.7 C-C stretching
1616.7 ν37 A’ C1 1653.0 1609.7 C-C stretching
cm−1was used for all infrared lines. For both conformers, the derived GS spectroscopic parameters are identical to those pre-viously reported,[8] a likely reflection of the higher resolution, higher range of covered quantum numbers, and higher number of observed transitions in that study. In v18=1, the derived
rotational constants are in excellent agreement with the pre-dicted, scaled, values (to better than 1%), a confirmation of the correct assignment of the 3MP-C1 and 3MP-C4 conformers. With a reduced standard deviation 0.95 and 1.09 for 3MP-C1 and 3MP-C4, respectively, all the assigned lines are reproduced at the experimental accuracy.
The Jet-AILES and SPIRALES experimental spectra are compared to a Pgopher simulation (see Fig.5c) based on the adjusted molecular parameters using a rotational temperature of 30 K and a full-width at half-maximum (FWHM) of the rotational transitions of 0.004 cm−1, two parameters found to nicely reproduce the line profiles. However the relative intensity ratio of the C1 and C4 conformers differ from what should be expected from natural abundances previously determined [8] and predicted band intensities from the B3LYP/cc-pVTZ harmonic calculation: when taking into account both these parameters (45% and 8% population and I=73 and 35 km/mol for 3MP-C1 and 3MP-C4, respectively), the 3MP-C4 Q-branch intensity is underestimated in the simulation compared to what is observed in the experiment. Instead, a reasonable simulation is obtained by using the same IR activities for the ν18band of
the two conformers (thus only taking into account the relative population).
From this analysis, we can confirm that the DFT calculations provide a reliable base for conformational assignment by fre-quency differences: the predicted harmonic and anharmonic frequencies were in reasonable agreement with the experiment and the frequency difference for a given mode between stable conformers provided accurate grounds for their experimental identification (see Fig. S1). The calculated intensities, both harmonic and anharmonic, however, appear less useful to guide
conformational assignment.
B.2. Vibrational analysis of theν36andν37modes of 3MP
Fig.6displays SPIRALES measurements of 3MP recorded in the 1600–1635 cm−1range near the Q-branches identified on the Jet-AILES spectrum. Due to the higher resolution and sensi-tivity of the SPIRALES setup, narrower Q-branches (∆νFWHM
= 0.15 cm−1) with better SNR are observed allowing to refine conformational assignments, particularly in the case of the ν37
band. While for ν18mode, the harmonic and anharmonic
pre-dictions were consistent in terms of conformer frequency order, and the main change was thus in absolute frequency, for ν36and
ν37the frequency difference between conformers is significantly
different between the calculations (see Fig. S2). Interestingly, the best qualitative agreement is obtained using the harmonic frequencies which will thus serve as a basis for the following assignments.
In the ν36 band region (Fig.6a), the broad Q-branch
ob-served in the Jet-AILES spectrum is partially resolved in the SPIRALES one with two bands at 1602.63 and 1602.80 cm−1 accompanied by weak satellites on the blue side (Fig.6). Be-sides, no other band has been detected in the 1590–1610 cm−1 range. Based on the expected frequency difference between con-formers, we propose to assign these two bands to the 3MP-C2 and 3MP-C4 conformers. The 3MP-C1 and 3MP-C3 conform-ers expected at lower frequencies remain not observed.
The ν37 band region, richer in structures, displays 6
Q-branches (Fig.6b) whereas only four are expected. The bands appear as three sets of doublets, each composed of a strong band and a weaker satellite on the blue side (at 1624.10/1624.79, 1629.25/1630.01, and 1632.07/1632.49 cm−1). Under the hy-pothesis that the weaker bands could arise from hot bands, we calculated the R ratio (see Eq.1) for each doublet which takes values of 0.4, 0.7, and 2.4 for the lines at 1624.79, 1630.01, and 1632.49 cm−1, respectively. On these grounds, we argue that the band at 1624.79 cm−1 can not be a hot band of the
Table 2. Experimental (νexp) and calculated (νharmand νanharm) values at the B3LYP/cc-pVTZ level of the vibrational bands centers
of 3MP with the vibrational and conformational assignments. All frequencies were measured from the Q-branches observed on the Jet-AILES spectra except those, where the νexpvalues are marked with a star, associated with the SPIRALES measurements. In the
case νexp,18, the fitted vibrational band centers are reported (see Table4for more digits).
νexp Mode Symmetry Conformer νharm νanharm Description
3MP
292.7 ν6 A” C4 332.2 299.4 -OH out-of-plane bending
311.9 ν6 A” C3 349.3 345.0 -OH out-of-plane bending
318.9 ν6 A” C1 354.8 377.3 -OH out-of-plane bending
321.1 ν6 A” C2 360.8 359.3 -OH out-of-plane bending
949.72∗ ν18 A’ C1 964.5 946.0 in-plane ring bending
949.66∗ ν18 A’ C4 964.5 946.1 in-plane ring bending
1053.4 ν21 A’ C1 1065.9 1040.4 in-plane ring bending
1061.9 ν21 A’ C2 1075.8 1050.4 in-plane ring bending
1058.3 ν21 A’ C3 1071.2 1046.2 in-plane ring bending
1055.8 ν21 A’ C4 1068.5 1043.0 in-plane ring bending
1150.3 ν24 A’ C1 1175.0 1146.9 -CH in-plane bending
1150.9 ν24 A’ C2 1178.7 1145.7 -CH in-plane bending
1144.5 ν23 A’ C3 1169.1 1133.4 -CH3rocking
1153.9 ν23 A” C4 1172.3 1150.8 -CH3rocking
1190.9 ν25 A’ C4 1195.9 1182.7 -CH in-plane bending
1161.3 ν25 A’ C1/C2 1183.3/1192.6 1156.6/1166.1 -CH in-plane bending
1175.5 ν26 A’ C2 1198.4 1178.1 -CH3wagging -OH in-plane bending
1176.0 ν26 A’ C1 1206.4 1177.8 -CH3wagging -OH in-plane bending
1205.1 ν27 A’ C2 1227.9 1203.1 -CH3wagging -CH in-plane bending
1206.6 ν27 A’ C4 1230.1 1203.2 -CH3wagging -CH in-plane bending
1217.9 ν27 A’ C1 1236.7 1220.7 -CH3wagging -CH in-plane bending
1226.0 ν27 A’ C3 1244.1 1231.1 -CH3wagging -CH in-plane bending
1298.7 ν28 A’ C1 1317.4 1288.4 C-O symmetric stretching
1296.6 ν28 A’ C2 1320.1 1287.3 C-O symmetric stretching
1292.3 ν28 A’ C3 1317.4 1283.5 C-O symmetric stretching
1293.7 ν28 A’ C4 1315.2 1285.0 C-O symmetric stretching
1306.8 ν29 A’ C1 1337.5 1311.5 -CH in-plane bending
1304.2 ν29 A’ C3 1335.5 1307.4 -CH in-plane bending
1330.2 ν30 A’ C1 1365.7 1332.1 -CH in-plane bending
1331.6 ν30 A’ C3 1361.9 1333.3 -CH in-plane bending
1439.8 ν31 A’ C1 1474.2 1434.6 -CH3wagging
1440.0 ν31 A’ C3 1477.0 1439.5 -CH3wagging
1462.5 ν33/ν34 A’ C2/C4 1496.7/1477.0 1463.8 -CH3scissoring/C-C stretching
1463.9 ν33 A’ C1/C3 1505.0/1505.9 1499.3/1464.7 -CH3scissoring 1473.9 ν34 A’ C2 1510.4 1474.2 C-C stretching 1478.2 ν34 A’ C1 1517.8 1484.6 C-C stretching 1488.4 ν34 A’ C3 1518.4 1486.2 C-C stretching 1497.6 ν35 A’ C3/C4 1529.1/1540.8 1499.3/1499.0 C-C stretching 1498.5 ν35 A’ C1 1529.7 1501.4 C-C stretching 1506.4 ν35 A’ C2 1540.8 1506.3 C-C stretching 1602.63∗ ν36 A’ C2 1640.4 1600.2 C-C stretching 1602.80∗ ν36 A’ C4 1640.5 1606.1 C-C stretching 1624.10∗ ν37 A’ C2 1652.0 1618.7 C-C stretching 1624.79∗ ν37 A’ C4 1652.7 1607.3 C-C stretching 1629.25∗ ν37 A’ C1 1656.7 1619.8 C-C stretching 1632.07∗ ν37 A’ C3 1662.5 1623.7 C-C stretching
one at 1624.10 cm−1(R << 1). With an R value significantly above 1, the 1632.49 cm−1 band is tentatively assigned to a hot band of the one at 1632.07 cm−1, although the modes in-volved remain undetermined. The 1630.01 cm−1, however, is more questionable since the R value is relatively close to 1. Be-cause of possible baseline errors in the FTIR spectrum and in the
uncertainty inherent with the R determination, the band could ei-ther arise from a hot or a cold (including overtone/combination) band. The harmonic calculation provide solid ground for the spectral assignment, as in the ν36band region (see Fig. S2). The
close Q-branches at 1624.10 and 1624.79 cm−1are assigned to 3MP-C2 and 3MP-C4 conformers while the highest frequency
Table 3. Experimental (νexp) and calculated (νharmand νanharm) values at the B3LYP/cc-pVTZ level of the vibrational bands centers
of 4MP with the vibrational and conformational assignments. All frequencies were measured from the Q-branches observed on the Jet-AILES spectra.
νexp Mode Symmetry Conformer νharm νanharm Description
4MP
259.9 ν5 A” C2 302.8 301.2 -OH out-of-plane bending
269.1 ν5 A” C1 309.8 370.5 -OH out-of-plane bending
322.9 ν7 A’ C1 381.1 378.6 -CO in-plane bending
515.4 ν10 A” C1/C2 527.3/526.6 528.1/525.7 -CH out-of-plane bending
1057.1 ν21 A’ C1 1068.5 1041.4 O-CH3stretching
1057.4 ν21 A’ C2 1068.7 1042.2 O-CH3stretching
1097.5 ν22 A’ C1/C2 1124.9/1126.1 1104.7/1103.3 -CH in-plane bending
1168.2 ν24 A’ C1 1186.7 1150.1 -OH/-CH in-plane bending
1177.4 ν26 A’ C2 1207.3 1170.6 -CH3wagging -OH in-plane bending
1241.3 ν27 A’ C1 1264.8 1229.0 -CH3wagging -CH in-plane bending
1247.2 ν27 A’ C2 1268.7 1237.9 -CH3wagging -CH in-plane bending
1338.4 ν30 A’ C2 1370.2 1340.2 -CH in-plane bending
1443.2 ν31 A’ C1 1475.7 1434.1 -CH3wagging -CH in-plane bending
1440.9 ν31 A’ C2 1472.4 1432.1 -CH3wagging -CH in-plane bending
1462.9 ν33 A” C1 1493.7/1493.4 1458.0/1455.4 -CH3twisting
1474.1 ν34 A’ C1/C2 1509.1/1508.8 1476.4/1477.2 -CH3scissoring
1517.4 ν35 A’ C1 1449.4 1511.0 -CH in-plane bending
1516.0 ν35 A’ C2 1449.3 1509.8 -CH in-plane bending
Table 4. Summary of the spectroscopic parameters of 3MP-C1 and 3MP-C4 from a fit of the literature pure rotational GS transitions[8] and rovibrational transitions in the ν18band (this work). Pertinent parameters to the fit (number of fitted transitions, range of observed
quantum numbers, rms and standard deviation) are also reported. Owing to the low rotational temperature in the supersonic expansion, most of the quartic centrifugal distortion constants in v18=1 were fixed to the GS values as indicated by the brackets. Values are in
MHz unless otherwise noted.
Constant 3MP-C1 3MP-C4 v=0 v18=1 v=0 v18=1 Ea 949.72714(25) 949.65653(48) A 2840.8815(55) 2840.35(32) 2847.05511(54) 2846.19(39) B 1303.5274(14) 1300.79(53) 1298.12761(13) 1295.29(11) C 898.98216(10) 898.120(25) 897.065125(38) 896.464(45) ∆J× 103 0.05094(36) 0.155(11) 0.0503425(72) 0.201(20) ∆JK× 103 −0.0979(24) [−0.0979] −0.091482(53) [−0.091484] ∆K× 103 0.402(15) [0.4026] 0.38344(36) [0.38337] δJ× 106 18.21(18) [18.210] 17.9048(36) [17.9047] δK× 106 79.7(11) [79.71] 81.033(48) [81.030] Nb 1776c 766d 3913 179 nb 482c 152d 1130 55 Jmax0 131 50 150 45 Kmax0 22 14 32 14 rms 0.072c 0.0009a,d 0.076c 0.0018a,d σe 0.95 1.09
ain cm−1 bNumber of lines (N) and number of different frequencies (n) included in the fit cPure rotation
value[8] dRovibrational value eReduced standard deviation (unitless)
ones at 1629.25 and 1632.07 cm−1are assigned to 3MP-C1 and 3MP-C3 conformers.
B.3. Broad features in theν36andν37regions
Interestingly, while the rotational structure was resolved in the ν18band in the SPIRALES spectrum, no sign of such resolution
Fig. 4. Mid-IR Jet-AILES absorbance spectra of the 2MP
(Fig.4a), 3MP (Fig.4b) and 4MP (Fig.4c) isomers measured in 5 slm of Ar buffer gas. Blue areas indicates spectral regions reachable using the SPIRALES setup.
is visible for the ν36 and ν37modes of 3MP under the same
experimental conditions. Furthermore, the Q-branches of these bands appear broader than those of ν18. Further inspection of the
Jet-AILES spectrum reveal that these two modes, corresponding to C-C ring stretching, exhibit broader Q-branches than in-plane bending ones close in frequency (∆νFWHM= 0.35 cm−1versus
0.11 cm−1).
A simulation of the expected rovibrational SPIRALES spec-tra of ν36and ν37, i.e. using the optimum modelization
param-eters defined for ν18 (a rotational temperature of 30 K and a
FWHM of 0.004 cm−1) reveals that under the SPIRALES ex-perimental conditions, a rotational resolution of these bands was expected. In this simulation, the experimental GS and scaled upper state constants were used, as the scaling has shown ex-tremely reliable for the analysis of ν18. Additionally, the two
bands at 1630.01 and 1632.49 cm−1, although unassigned, were simulated as well using constants from 3MP-C1 in order to reproduce at best the strong rovibrational congestion in this
Fig. 5. Spectrum of the ν18 band of 3MP recorded using the Jet-AILES apparatus (Fig. 5a, in black) and the SPIRALES setup (Fig. 5b, in blue) and comparison with a 30 K simulation performed using PGOPHER at a 0.004 cm−1FWHM (Fig. 5c, in orange) using rotational constants of C1 and 3MP-C4 conformers determined in this work (see Table4). In the simulation, the relative abundances of both conformers are taken into account and the intensity of the ν18 band of 3MP-C4 is
adjusted to 1.4 times that of 3MP-C1 to reflect the experimental spectrum.
Fig. 6. Spectrum of the ν36(Fig. 6a) and ν37(Fig. 6b) bands
of 3MP recorded using the Jet-AILES apparatus (top trace, in black) and the SPIRALES setup (middle trace, in blue) and comparison with a 30 K simulation performed using PGOPHER at a 0.15 cm−1FWHM (bottom trace, in orange). GS rotation constants and upper state scaled constants from the DFT calcu-lations were used in the simulation. The relative intensities of each conformer were obtained by taking into account the rela-tive abundances of each conformer and the same band intensity was used for all bands of a given mode.
region . Despite a high density of vibrational bands, P and R rotational features remain clearly distinguishable in the
simula-tion. Furthermore, the simulated Q-branches are narrower than what observed experimentally (see Fig. S3). It is thus likely that another effect is responsible for the spectral broadening, a plau-sible hypothesis being some vibrational perturbation although the responsible of which are not identified to date. Such pertur-bation could also explain the failure of anharmonic calculations to reproduce correctly the experimental spectrum, as already observed for the out-of-plane -OH bending mode (see section
A) displaying large amplitude motions. It is worth noting that 3MP does not seem to be the only MP molecule affected by such effect, since in the case of the 2MP isomer no Q-branch of ν36,37C-C ring stretching bands was detected using the
Jet-AILES apparatus and these bands remained elusive using the SPIRALES setup. To help understand this effect, further inves-tigation of related species should prove insightful, for instance the dihydroxybenzene (C6H5(OH)2) molecules in which the
methoxy group of MP is replaced by an hydroxy group, a study that has been undertaken by some of us on the ortho isomer also called catechol[30].
4. CONCLUSIONS
The present study reports a low temperature rovibrational analy-sis of the three MP isomers using two complementary jet-cooled spectrometers: the Jet-AILES setup for low resolution FT broad-band analysis in the fingerprint region (100 - 1700 cm−1) and the SPIRALES instrument using different EC-QCL sources allow-ing to measure at high resolution targeted mid-IR bands. With the Jet-AILES apparatus, narrow Q-branches were observed at low dilution using Ar as buffer gas. In the far-IR, Q-branches of the most intense out-of-plane -OH bending modes are unambigu-ously assigned for all the stable conformers. Moreover, guided by the anharmonic B3LYP/cc-pVTZ frequency calculations per-formed for each stable conformer, we propose for the three MP isomers corrected assignments and band centers values from narrow Q-branches measured in the FT-mid-IR Jet-AILES spec-tra. A first EC-QCL source covering the 930-990 cm−1range has allowed to fully resolve the rotational structure of the ν18
in-plane ring bending bands of the 3MP-C1 and 3MP-C4 con-formers. Two other EC-QCL sources covering the 1580-1690 cm−1 range have been used to probe the C–C ring stretching ν36and ν37bands of 3MP and the associated stable conformers
have been assigned. Compared to the ν18analysis, it was not
possible to proceed to the rovibrational analysis of the ν36and
ν37bands which present broader Q-branches without visible
P-and R-branches. The simulation of the expected rovibrational SPIRALES spectra suggests a possible vibrational perturbation responsible for the spectral broadening of the ν36and ν37bands.
Nevertheless, the unambiguous conformer assignments obtained in the case of a rather large polyatomic molecule such as 3MP with four conformations significantly populated is a proof of the efficiency of high resolution QCL jet-cooled spectroscopy to analyze the conformational landscape of flexible molecules and to disentangle rovibrational signatures in a dense spectral region. The non-localized low-energy vibrational modes lying in the far-IR region also present a great potential for an efficient conformational discrimination [31] but, compared to the near-IR and UV domains, the available setups in this domain still lack
of sensitivity. In a near future, new generation of QCL far-IR sources [32,33] will offer real opportunities to probe and re-solve at low temperature the lowest energy vibrational bands of individual conformers even for highly flexible molecules charac-terized by a rich conformational landscape. The conformational analysis is, for these molecules, the first step for a correct deter-mination of the vibrational cross sections. In a second step, the additional difficulty to be overcome will lie in the analysis of the predominant hot bands at higher temperatures.
SUPPLEMENTARY MATERIAL
Three supplementary figures provide comparison of the mea-sured SPIRALES spectra with Pgopher simulations of ν18and
ν36−37based on the harmonic and anharmonic B3LYP/cc-pVTZ
calculations. All computed fundamental harmonic and anhar-monic frequencies, intensities and excited rotational constants are detailed in 7 Tables from S1 to S7, for the stable conformers 2MP-C1, 3MP-C1, 3MP-C2, 3MP-C3, 3MP-C4, 4MP-C1 and 4MP-C2. The scaling of the rotational constants in v18=1 is
presented in Table S8. The line lists of the assigned rovibrational transitions of ν18 for 3MP-C1 and 3MP-C4 with SPIRALES
are presented in Table S9 and S10.
ACKNOWLEDGEMENTS
The present work and the postdoctoral fellowship of A. Jabri take place in the Labex CaPPA (Chemical and Physical Proper-ties of the Atmosphere) funded by the French National Research Agency (ANR) through the PIA (Programme d’Investissements d’Avenir) under contract ANR-11-LABX-005-01. The PhD of A. Roucou was supported by the Région Hauts-de-France and the French Direction Générale de l’Armement (DGA). The PhD of Y. Belkhodja was supported by the MESRI (Ministère de l’Enseignement Supérieur de la Recherche et de l’Innovation) within the doctoral school of Chimie Physique et Chimie Analy-tique de Paris Centre (ED 388). The authors are also grateful for the financial grant received from the Région Hauts-de-France, the Ministère de l’Enseignement Supérieur et de la Recherche (CPER Climibio), and the European Fund for Regional Eco-nomic Development. The authors are grateful to SOLEIL and the AILES staff for providing synchrotron beam under proposal 20170310. Additional acknowledgements go to the Centre de Ressources Informatiques de Lille 1 (CRI) where the GAUS-SIAN16 calculations were performed.
REFERENCES
1. S. B. Hawthorne, D. J. Miller, R. M. Barkley, and M. S. Krieger. Environ. Sci. Technol.,22(10), 1191–1196 (1988).
2. C. D. Simpson, M. Paulsen, R. L. Dills, L.-J. S. Liu, and D. A. Kalman. Environ. Sci. Technol.,39(2), 631–637 (2005).
3. C. Liu, J. Liu, Y. Liu, T. Chen, and H. He. Atmos. Environ.,207, 30–37
(2019).
4. A. Lauraguais, C. Coeur-Tourneur, A. Cassez, K. Deboudt, M. Four-mentin, and M. Choël. Atmos. Environ.,86, 155–163 (2014).
5. C. Clerbaux, A. Boynard, L. Clarisse, M. George, J. Hadji-Lazaro, H. Herbin, D. Hurtmans, M. Pommier, A. Razavi, S. Turquety, C. We-spes, and P. F. Coheur. Atmos. Chem. Phys.,9(16), 6041–6054 (2009).
6. P. F. Coheur, H. Herbin, C. Clerbaux, D. Hurtmans, C. Wespes, M. Car-leer, S. Turquety, C. P. Rinsland, J. Remedios, D. Hauglustaine, C. D. Boone, and P. F. Bernath. Atmos. Chem. Phys.,7(20), 5437–5446
(2007).doi:{10.5194/acp-7-5437-2007}.
7. A. Cuisset, C. Coeur, G. Mouret, W. Ahmad, A. Tomas, and O. Pirali. J. Quant. Spectrosc. Radiat. Transfer,179, 51–58 (2016).
8. A. Roucou, D. Fontanari, G. Dhont, A. Jabri, C. Bray, F. Hindle, G. Mouret, R. Bocquet, and A. Cuisset. ChemPhysChem,19(13),
1572–1578 (2018).
9. A. Jabri, D. Fontanari, A. Roucou, C. Bray, F. Hindle, G. Dhont, G. Mouret, R. Bocquet, and A. Cuisset. J. Chem. Phys.,150(10)
(2019).doi:{10.1063/1.5089426}.
10. E. L. Sibert, III, D. P. Tabor, N. M. Kidwell, J. C. Dean, and T. S. Zwier. J. Phys. Chem. A,118(47), 11272–11281 (2014).
11. J. A. Ruiz-Santoyo, M. Rodríguez-Matus, J. L. Cabellos, J. T. Yi, D. W. Pratt, M. Schmitt, G. Merino, and L. Álvarez-Valtierra. J. Chem. Phys.,
143(9), 094301 (2015).
12. M. Wilke, M. Schneider, J. Wilke, J. A. Ruiz-Santoyo, J. J. Campos-Amador, M. E. González-Medina, L. Álvarez-Valtierra, and M. Schmitt. J. Mol. Struct.,1140, 59–66 (2017).
13. S. Kim, P. A. Thiessen, E. E. Bolton, J. Chen, G. Fu, A. Gindulyte, L. Han, J. He, S. He, B. A. Shoemaker, J. Wang, B. Yu, J. Zhang, and S. H. Bryant. Nucleic Acids Res.,44(D1), D1202–D1213 (2016).
doi:{10.1093/nar/gkv951}.
14. M. Cirtog, P. Asselin, P. Soulard, B. Tremblay, B. Madebene, and M. E. Alikhani. J. Phys. Chem. A,115(12), 2523–2532 (2011).doi:
{10.1021/jp111507z}.
15. P. Asselin, B. Madebene, P. Soulard, R. Georges, M. Goubet, T. R. Huet, O. Pirali, and A. Zehnacker-Rentien. J. Chem. Phys.,145(22)
(2016).doi:{10.1063/1.4972016}.
16. P. Asselin, A. Potapov, A. C. Turner, V. Boudon, L. Bruel, M.-A. Gaveau, and M. Mons. Phys. Chem. Chem. Phys.,19(26), 17224–17232 (2017).
doi:{10.1039/c7cp02529g}.
17. A. Jabri, Y. Belkhodja, Y. Berger, I. Kleiner, and P. Asselin. J. Mol. Spectrosc.,349, 32–36 (2018).doi:{10.1016/j.jms.2018.03. 012}.
18. L. S. Rothman, I. E. Gordon, Y. Babikov, A. Barbe, D. C. Benner, P. F. Bernath, M. Birk, L. Bizzocchi, V. Boudon, L. Brown, A. Cam-pargue, K. Chance, E. Cohen, L. H. Coudert, V. M. Devi, B. Drouin, A. Fayt, J.-M. Flaud, R. Gamache, J. J. Harrison, J.-M. Hartmann, C. Hill, J. T. Hodges, D. Jacquemart, A. Jolly, J. Lamouroux, R. L. Roy, G. Li, D. Long, O. Lyulin, C. J. Mackie, S. T. Massie, S. Mikhailenko, H. Mueller, O. Naumenko, A. V. Nikitin, J. Orphal, V. Perevalov, A. Per-rin, E. R. Polovtseva, C. Richard, M. A. H. Smith, E. Starikova, K. Sung, S. Tashkun, J. Tennyson, G. C. Toon, r. Tyuterev, and G. Wagner. J. Quant. Spectrosc. Radiat. Transfer,130(SI), 4–50 (2013).
19. M. D. Brookes, C. Xia, J. Tang, J. A. Anstey, B. G. Fulsom, K.-X. A. Yong, J. M. King, and A. McKellar. Spectrochimica Acta Part A: Molecular and Biomolecular Spectroscopy,60(14), 3235 – 3242 (2004).doi:
10.1016/j.saa.2003.11.041.
20. X. Liu, Y. Xu, W. Su, Z.and Tam, and L. I. Appl. Phys. B: Lasers Opt,
102, 629–639 (2011).doi:10.1007/s00340-010-4147-y. 21. M. Frisch, G. Trucks, H. Schlegel, G. Scuseria, M. Robb, J. Cheeseman,
G. Scalmani, V. Barone, G. Petersson, H. Nakatsuji, et al. Gaussian 16, revision A.03. Gaussian Inc., Wallingford CT (2016).
22. R. A. Kendall, T. H. Dunning Jr, and R. J. Harrison. J. Chem. Phys.,
96(9), 6796–6806 (1992).
23. L. Cesari, L. Canabady-Rochelle, and F. Mutelet. Struct. Chem.,29(1),
179–194 (2018).
24. V. Barone, M. Biczysko, and J. Bloino. Phys. Chem. Chem. Phys.,16,
1759–1787 (2014).doi:{10.1039/c3cp53413h}.
25. T. Häber, U. Schmitt, and M. A. Suhm. Phys. Chem. Chem. Phys.,1,
5573–5582 (1999).doi:10.1039/A907264K.
26. M. Goubet, P. Soulard, O. Pirali, P. Asselin, F. Réal, S. Gruet, T. R. Huet, P. Roy, and R. Georges. Phys. Chem. Chem. Phys.,17, 7477–7488
(2015).doi:10.1039/C4CP05684A.
27. C. Western. J. Quant. Spectrosc. Radiat. Transfer,186, 221–242
(2016).
28. W. Lodyga, M. Kreglewski, P. Pracna, and S. Urban. J. Mol. Spectrosc.,
243, 182–188 (2007).
29. H. M. Pickett. J. Mol. Spectrosc.,148, 371–377 (1991).
30. M. Gerhards, W. Perl, S. Schumm, U. Henrichs, C. Jacoby, and K. Klein-ermanns. J. Chem. Phys.,104(23), 9362–9375 (1996).
31. A. Cuisset, G. Mouret, O. Pirali, P. Roy, F. Cazier, H. Nouali, and J. Demaison. J. Phys. Chem. B,112(39), 12516–12525 (2008).doi:
{10.1021/jp804665h}.
32. M. Bahriz, G. Lollia, A. N. Baranov, and R. Teissier. Opt. Express,
23(2), 1523–1528 (2015).
33. K. Ohtani, M. Beck, M. J. Suess, J. Faist, A. M. Andrews, T. Zederbauer, H. Detz, W. Schrenk, and G. Strasser. ACS Photonics,3(12), 2280–
![Fig. 2. Comparison of 3MP FT spectra recorded at room temperature[7] (in red) and in supersonic-jet conditions with a 5 slm flow of Ar buffer gas (in black)](https://thumb-eu.123doks.com/thumbv2/123doknet/14420914.513303/6.918.108.821.74.387/comparison-spectra-recorded-temperature-supersonic-conditions-buffer-black.webp)