HAL Id: halshs-01244492
https://halshs.archives-ouvertes.fr/halshs-01244492
Submitted on 20 Dec 2015HAL is a multi-disciplinary open access archive for the deposit and dissemination of sci-entific research documents, whether they are pub-lished or not. The documents may come from teaching and research institutions in France or abroad, or from public or private research centers.
L’archive ouverte pluridisciplinaire HAL, est destinée au dépôt et à la diffusion de documents scientifiques de niveau recherche, publiés ou non, émanant des établissements d’enseignement et de recherche français ou étrangers, des laboratoires publics ou privés.
French professional football: how much different?
Wladimir Andreff
To cite this version:
Wladimir Andreff. French professional football: how much different?. John Goddard, Peter Sloane. Handbook on the Economics of Professional Football, Edward Elgar, pp.298-321, 2014, 978 1 78100 316 9. �10.4337/9781781003176.00026�. �halshs-01244492�
1
John Goddard, Peter Sloane, eds., Handbook on the Economics of Football, Edward Elgar 2015. (forthcoming)
Chapter 18:
French Professional Football: How Much Different?
Wladimir Andreff
France, in common with other leading European football nations, was affected by two significant economic shocks in the 1990s. One is the globalisation of the labour market for football players which occurred after the Bosman case in 1995; the other is a substantial change in the format and financial endowment of the UEFA club competitions, accelerated by the failed attempt by Media-Partners in 1999 to create a European Super-League. How has French professional football adjusted to this double shock since 2000? Did French football adjust better or worse than the other major European leagues to the changing financial realities of professional football at the highest level?
Many French sports analysts are inclined to cite the French Ligue 1 (FL1) as the best managed football league in Europe. It is suggested that the French exception copes better than others with football‟s financial pressures. This exception has been praised as a virtuous example for other European major football leagues such as the English Premier League (EPL), Italian Lega Calcio (ILC), Spanish Liga de Futbol (SLF) and German Bundesliga (GBL). Some French official reports had gone as far as to recommend making a rule out of this exception by extending it to all leagues under UEFA‟s jurisdiction (Collin, 2004; Denis, 2003). Another report more modestly questions the pre-conditions for French football clubs to become both more competitive on the pitch, and economically sound (Besson, 2008). The claimed advantages of the French model may have been influential in informing the thinking underlying the UEFA financial fair play rules
The French model, however, is not universally admired throughout Europe, especially in the countries with the most powerful football leagues. There are at least three criticisms. First, it is argued that relatively weak sporting performance at the European level is the price paid for sound financial management. An extreme variant of this argument, often voiced abroad, is that the French football authorities focus on sound finance to the detriment of sporting performance. Second, smaller deficits and debts may be more an index of the French clubs‟
2
lack of competitiveness than an example of exemplary management. Third, in some countries (for example, the UK, Ireland, and the Czech Republic), the French football league and economy are considered to be too heavily regulated, to the detriment of both competitiveness and the level of sporting performance.
Rather than dismiss out-of-hand such views as belonging to the realm of caricature, this chapter considers whether they contain any grain of truth, and searches for a balanced response. Section 1 begins with an assessment of French football sporting and financial performance. Section 2 examines the inputs mobilised for attaining such performance, in order to evaluate in Section 3 the efficiency of professional football clubs in France. Against the background of a typically optimistic financial self-assessment on the part of French football clubs, Section 4 examines the sources and structure of professional football finance, as well as the role of the league‟s auditing body. Section 5 presents a more personal analysis, stressing the football clubs‟ soft budget constraint and a vicious circle between the increasing commercial value of TV broadcasting rights, and skyrocketing club payrolls. Section 6
concludes by drawing some brief conclusions about the future of French professional football.
1. A trade-off between financial and sporting performance?
Sporting outcomes contrast sharply with financial achievements in French football: in a nutshell, the level of sporting achievement is lower in FL1 than in the other major European football leagues, while financial performance is better on average. A convenient yardstick for evaluating sporting performance is available in the form of achievement records in European and international football. A more subjective assessment can be made by evaluating the sporting quality of domestic games supplied by Ligue 1.
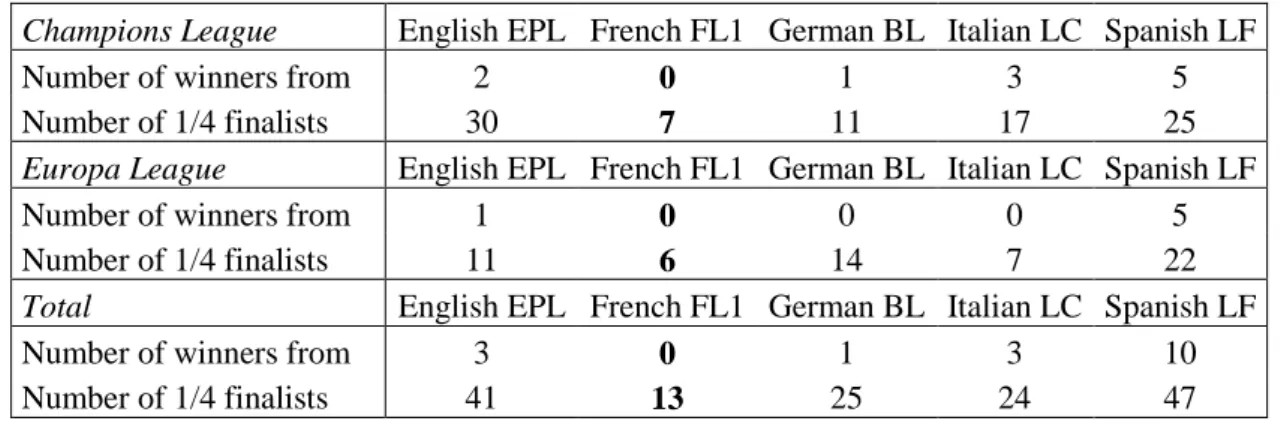
The performance of French clubs in UEFA club competition is not impressive. From the inception of the restructured Champions League in 1995-96 (formerly the European Cup) until 2011-12, the share of French clubs in the total number of match wins is 1.5%, compared to 12.4% for German clubs, 16.1% for Italian clubs, 19.0% for English clubs, and 19.0% for Spanish clubs. At the time of writing in 2013, no French club had won a UEFA competition since Paris St Germain won the Cup Winners‟ Cup in 1996. Between 2000 and 2012 French clubs reached the quarter-finals of UEFA competitions on 13 occasions, as against 24 for ILC clubs, 25 for GBL clubs, 41 for EPL clubs, and 47 for SLF clubs (Table 1). In UEFA rankings based on club performance, France‟s ranking dropped from 4th to 5th in 2009 (below Spain, Italy, England and Germany), and to 6th in 2012 (having been overtaken by Portugal). In 2012
3
the highest-ranked French club was Olympique Lyonnais in 10th place. Olympique de Marseille were the 2nd highest ranked, in 15th place, followed by Girondins de Bordeaux in 34th place, Paris Saint Germain in 48th place, and Lille OSC in 59th place
Insert Table 1 about here
Turning to the French national team, which is not under the professional league‟s (LFP: Ligue de Football Professionnel) supervision, but instead accountable to the French Football Federation (FFF: Fédération Française de Football), performance peaked in 1998 with victory in the FIFA World Cup. At that stage France rose to 2nd place in the FIFA world rankings, behind Brazil. Since then, the French national team was eliminated twice at the round robin (group) stage of the 2002 and 2010 World Cup final tournaments. France reached the 2006 World Cup final, but was defeated by Italy. Subsequently there has been a pronounced downward trend in the national team‟s performance. In July 2012 France was ranked 14th in the FIFA world rankings, lagging behind countries such as Croatia, Greece and Russia. As regards the French national team‟s participation in UEFA‟s European Championships, the peak was a win in 2000, when the team appears to have benefited from the springboard effect of its 1998 World Cup triumph. Subsequently France reached the European Championships quarter-finals in 2004 and 2012, but failed to make any impact in this competition in 2008.
Perhaps one of the most favourable aspects of FL1 relates to the level of competitive balance. At first glance this sounds paradoxical, since Olympique de Marseille won the championship four times in succession between 1989 and 1992, and Olympique Lyonnais on seven times in succession from 2002 to 2008. However, the number of different clubs that achieved top five placings in FL1 between 1994 and 2012 was 17. This compares favourably with 13 clubs in ILF and 14 in EPL, and is matched by 17 in both GBL and SLC, suggesting that competition is no less balanced in top-flight French football than in the other major European football leagues. Considering the most widely used measure of competitive balance over one season, the Noll-Scully index, which refers to the observed win percentage distribution relative to the distribution that would be expected theoretically if all teams were perfectly balanced, FL1 was the most balanced European major league over the period 1996 to 2012 on average (Table 2A), and was the most balanced in each of the four years from 2005 to 2008, when Olympique Lyonnais dominated the championship. Between 2009 and 2012 competitive balance deteriorated slightly in comparison with the previous decade, in line with an overall trend across all of the major European leagues, with the exception of ILC.
4
With regard to long-term competitive balance – measured by the Spearman rank correlation between one year‟s final ranking and the previous year‟s ranking in the championship – FL1 performs even better. FL1 was the most balanced league in seven years out of sixteen between 1997 and 2012. Remarkably, the rank correlation for the 1999-2000 and 2000-01 seasons was zero, suggesting that the rankings for the former season have no predictive content for the latter (Table 2B). According to the standard theory of team sports leagues, FL1 offers the most balanced competition among the major European football leagues, with the lowest rank correlation on average. However, this conclusion is somewhat paradoxical for the French league1 because, if competitive balance were attractive to spectators, FL1 should have attracted more fans into the stadiums than any of the other major European leagues.
Insert Figure 1 about here
Figure 1, however, shows the opposite. Even though the average number of spectators attracted into FL1 stadiums increased from below 15,000 in 1995 to over 20,000 in 2010, FL1 still lags behind the rest with an average 20,089 attendance per game in 2009-10. The corresponding 2010 figure for GBL was 42,500, EPL 34,151, ILF 28,286 and SLC 24,957. It appears that a high level of competitive balance is insufficient to guarantee a high quality sporting spectacle, contrary to the presumed association between competitive balance 2 and spectator interest. Furthermore, average ticket prices were lower in FL1 – €19 in 2009 – than in EPL (€49), ILF (€39), GBL (€ 28) and SLC (€ 21). One explanation, which has been cited increasingly in the empirical literature, is that football fans attend games in the hope of seeing their favourite team win, rather than in the hope of witnessing a closely balanced contest (Buraimo and Simmons, 2008). In France, it has been suggested that football fandom is only loosely linked to regular stadium attendance.
As suggested above, the presumed advantages of a high level of competitive balance in domestic competition are not reflected in performance or achievement in European or international competition. In general clubs from countries with the least balanced domestic competition, or with the most heavily concentrated distribution of revenue (especially TV revenue), exhibit the best Champions League performances and UEFA rankings (Andreff and Bourg, 2006). Sloane (2006, page 214) confirmed that: “the more successful clubs in small countries may need to be „too strong‟ for domestic competitions to have any hope of being successful in European wide competitions”. In respect of FL1, “weak” could be substituted
1
The relationship between high outcome uncertainty and high income seems to work for the German league. 2
More on empirical limitations of the standard relationship between competitive balance and game attendance in an open team sports league can be found in Andreff (2009 & 2012).
5
for “small” in this quotation. If high performance in European competition requires a sufficiently unbalanced domestic league, one derives the proposition that FL1 has been too balanced in the past, in particular until 2008. To some extent, this reasoning may explain the French football paradox.
A reasonable assumption is that the attractiveness of any football game depends on goal scoring. The latter is a rather neglected factor in the academic literature, but it was recently examined for the major European football leagues in 2003-2007 (Andreff and Raballand, 2011). French teams scored on average 2.22 goals per game. The corresponding figures were 2.82 for GBL, 2.59 for ILC, 2.57 for SFL and 2.56 for EPL. A regression of a competitive balance measure on various goal scoring measures showed that the former is significantly associated with goals scored and conceded, and the numbers of 0-0 draws and 1-0 wins. League dummies showed that for a GBL or ILC team to reach the same ranking, it must score significantly more goals than a FL1 team; the difference between EPL and FL was not significant. Regressing average game attendance on goal scoring reveals that the average number of goals scored has a positive impact on attendance, while the percentage of 0-0 draws has a strong negative effect.
The importance of goal scoring in attracting spectators is confirmed (Table 3) by regressions of average fan attendance per game in the five European major leagues on the average number of scored goals per game, using data from 1997 to 2010. The relevant coefficient is positive and significant at the 0.01 level. After introducing country dummies, however, the association between these two variables vanishes, while the dummies become significant at the 0.01 level. This suggests that association between fan attendance and goals scored is country-specific, and therefore captured by the dummies. This explanation seems relevant for France, where the patterns of football fandom are rather specific, and probably linked to the demographics of relatively small urban areas (see below).
Insert Table 3 about here
Overall, an excessively balanced domestic competition, together with weak European performances achieved by domestic clubs, and too few goals scored, are factors that may be relevant in explaining the relatively low levels of spectator interest in FL1.
A final sporting outcome, sometimes overlooked, refers to the popularity of football not only as a spectator sport, but also as a participation sport. The impact of the professional sport and national team performance on participation has not been studied widely in the sports economics literature, an exception being Dawson and Downward (2011). There is a paucity of comparable data, but the evidence presented by FIFA‟s Big Count for 2000 and 2006 (Table
6
4) suggests that Italian and Spanish football may have benefited from the strong performance of ILC and SLF clubs in UEFA competition, and of the national squads in international competition, since these two countries record the fastest increase in the percentage of football players in their populations. In the case of England, the positive impact of EPL clubs‟ performance in the Champions League may have been offset by the moderate performance of the national team. The increase in the percentage of registered football players in France is probably due more to the achievements of the national squad, rather than the European performance of FL1 clubs. The same applies to Germany, although there is little evidence of any benefit from the national team‟s success. An alternative hypothesis is that there is no significant relationship between top-level football performance and participation. Beyond the number of FIFA-registered players, the proportion of non-registered football players may vary widely across the five countries. The data do not allow us to test these conjectures.
Insert Table 4 about here
With regard to financial results FL1 has experienced a rapid increase in turnover, from €607 million in 2000 to €1,072 million in 2010, a 77% increase over ten years. Even after such growth, FL1 remains the smallest in economic terms among the five major European leagues: EPL turnover is more than twice as large, BL and LF about 40% larger, and LC 20% larger. French clubs are still economically small compared to clubs in other major football leagues. Only two of them regularly appear in the list of the top twenty European clubs in terms of revenues estimated by Deloitte every year: Olympique de Marseille (Marseille: 852,396 inhabitants) and Olympique Lyonnais (Lyon: 472,331 inhabitants). The turnover of several leading clubs, such as Real Madrid, Manchester United, FC Barcelona and Chelsea, is between two and three times as large. Paris Saint Germain has not appeared in the list so far, despite there being 10.4 million Paris inhabitants. One economic weakness of French clubs is a small market size translating into lower stadium and TV revenues. Paris, along with London, is one of only two European urban areas with more than 8 million inhabitants. Among the 44 European urban areas with more than 1 million inhabitants, only three others are located in France (Lyon, Marseille, and Lille). Bourg and Gouguet (2010) refer to a “French territorial exception”, and there are 36,000 different administrative municipalities within the country. The local fan base is often geared towards very small geographical locations. In this context it is difficult for clubs to attract a large fan base in cities that are mostly relatively small. In many cases attendance is further constrained by stadium capacity.
7
LFP assesses itself as the best managed European league, but FL1 has exhibited an overall pre-tax deficit every year since 2000, except for four years (Table 5). Although the magnitude of FL1 deficits is small compared to IFL and SLC, the record is not exemplary. League debt has grown from €427 million in 2000 to €690 million in 2008; since then it has remained steady at approximately €600 million (Table 6). With a €610 million debt in 2010, FL1 was less indebted than Chelsea alone (€638 million) and much less than the whole of the EPL (€2,178 million). For FL1 the greatest concern is the debt structure: payment arrears (on transfer fees, tax and social contributions) representing between 85% (in 2000) and 91% (2008) of overall debt. This figure was 90% in 2009, 85% in 2010 and 87% in 2011. Ligue 2 (second division) financial data are a lesser cause for concern in this respect. Payment arrears, however, are not indices of good management practices (Andreff, 2007a).
Insert Table 6 about here
Let us now turn to the input side of the French football league and clubs.
2. Accounting for stadiums, wage inflation, player transfers and training.
In French Ligue 1 and Ligue 2 most clubs are “professional sporting limited companies” (SASP: société anonyme sportive professionnelle). There are three exceptions: Auxerre and Bastia are limited companies with a sporting purpose (SAOS: société anonyme à objet sportif), and Ajaccio is a personal sporting limited liability company. These three clubs can neither pay dividends, nor remunerate their managers. Legislation establishing SASP status was passed by the French Parliament in 1999, in order to phase out these limitations (Drut, 2011). In France, few professional football clubs own their own stadium. Auxerre and Ajaccio are exceptions.3 Most stadia are rented for around 30 days per year, and cannot be used for a commercial purpose alien to football.
French football stadiums are small in comparison to other European major leagues. In 2008, the average capacity in FL1 was 28,673 seats. The corresponding figures were 45,390 in GBL, 43,000 in ILC, 38,900 in SLF and 38,876 in EPL. No new football stadium has been built since 1998, though four were being constructed (Bordeaux, Lille, Lyon, and Nice) at the time of writing in 2012, and five others were undergoing modernisation and refurbishment (Lens, Marseille, Saint-Etienne, Toulouse, and Paris/Parc des Princes) with a view to hosting the 2016 European Championships in France. €150 million was allocated to this task, within the
3
Lens benefits from a very long-term letting lease, while Lyon is in the process of becoming the owner of its future newly-built arena (OL land).
8
framework of France‟s economic recovery programme (€36 billion) launched in 2009 in the wake of the global financial crisis. A frequent argument is that stadium capacity hinders the growth of FL1 income (Bolotny and Debreyer, 2011). This contention cannot be pushed too far, however, since average capacity utilization of FL1 stadiums is 76%. This figure is similar to the SLF utilization of 74%, but far below the corresponding figures for the EPL (95%) and GBL (83%). Italian Calcio, in crisis since 2002, has only a 45% utilization rate. Bolotny and Debreyer suggest that in newly-built and modernised stadiums, the focus should be on providing a larger number of VIP and business seats at higher ticket prices, with more catering facilities (alcohol vendors are prohibited from operating in sport stadiums and arenas by the Evin law). Are these strategies likely to succeed? The first depends on the existence of a large potential constituency of French football fans among white-collar workers, the rich and the gentry, which remains to be demonstrated. The second implies that, as in American baseball arenas, spectators are there to crunch popcorn, swallow hamburgers, drink beer and only incidentally watch a game. Better French culinary habits suggest this model might not transfer easily, however.
Insert Table 7 about here
The largest share of football clubs‟ costs is devoted to paying players‟ salaries and associated social contributions, in France as in other European countries. The FL1 payroll increased from €324 million in 2000 to €777 million in 2011; it has more than doubled within twelve years (+140% increase). Wage inflation is greater than the increase in league turnover. With more than two-thirds of revenues geared towards payroll payments, FL1, along with ILC and SLF, is seriously troubled by wage inflation (Table 7). In 2010 the ratio of payroll costs to total revenues was 73%, and in 2011 this ratio increased to 75%.
In the sports economics literature on football, a significant correlation has been found between English clubs‟ payroll costs and their standing in the championship (Szymanski and Smith, 1997; Szymanski and Kuypers, 1999; Hall, Szymanski and Zimbalist, 2002). Moreover, using Granger causality tests, wages are a significant determinant of a club‟s standing, in line with the theory of efficiency wages. In the same vein, Dobson and Goddard (1998) tested causality from lagged gate receipts to current club‟s performance. In the case of FL1 and Ligue 2, Llorca and Teste (2012) find reverse Granger causality from sporting performance to payroll costs and gate receipts. They conclude that the model of efficiency wage is not relevant to the specific conditions of French football. Their interpretation is that after a period of success a French football club generates increased revenues, which are immediately used to inflate the payroll in order to retain good players and attract new talent.
9
FL1 is typically a net exporter of footballing talent: the sales of highly-talented players educated and trained by French clubs are larger in monetary value than expenditure on foreign players imported into the league (Table 5). French clubs transfer abroad players valued more highly than those they buy from abroad; in other words, FL1 trades its better players for less talented players. To some extent, FL1 plays the role of a nursery league for new talent. However, from 2001 to 2003, described as “years of folly” (Bolotny, 2006), there was a loss of control over the balance of transfers. The league‟s auditing body – DNCG (Direction Nationale de Contrôle de Gestion) – was unable to prevent what has been described as a financially reckless recruitment policy conducted by some FL1 clubs. In 2010, a similar occurrence increased by €91.7 million the league‟s deficit, which would have been only €22 million otherwise. The deficit was due to 40 players transferred from abroad at a cost of €136.3 million, while 24 players were transferred to foreign leagues generating €60.4 million in revenue: an overall deficit of €76.1 million.4 2010 was usual in the sense that FL1 ran a net deficit in transfer spending, in contrast to all previous years since 2004. The remaining transfer balance deficit (€15.6 million) was due to trade between FL1 and Ligue 2, since the second division acts as a nursery for top league clubs.
The pattern of transfer flows and their orientation is explained partially by the French system of educating and training young football players wishing to become professional, which dates back to 1972. Since 1990, a regulation compels all professional football clubs to develop a vocational educating and training centre for players between the ages of 15 and 19. The player is signed on an apprentice, candidate or trainee contract. The compulsory element is a cause for dissatisfaction among some clubs. Transactions involving players below the age of 18 are not allowed, in line with FIFA rules. Each young player commits himself to remain in education until the end of secondary school, and to sign his first five-year contract with his nursery club. However, following the Bosman judgement, this rule has often been circumvented, and the outflow of French young players to other major European football leagues continues. For instance, in 2007 the average budget of the clubs‟ vocational training centres was €3.5 million per year. The corresponding figures were €3 million for EPL clubs, €2.8 million for ILC, and €2.4 million for GBL and SLF. Free mobility of players in a global labour market since the Bosman case has created a disincentive for rich clubs to invest in educating and training their own young players, because they can find players of the same or
4 Of course transfers of teenage players, below the age of 18, are not encompassed in these official data since such transfers are forbidden by the 2001 FIFA rules. There is insufficient space to address the infamous issue of a global black market for young players in this chapter. Those interested readers are referred to Andreff (2010) where a so-called “Coubertobin tax” is suggested to resolve or at least alleviate the issue.
10
higher quality at lower cost in minor nursery leagues, or among clubs specialised in “producing” good players (Ericson, 2000). The experience of 2010 shows that even a league with a solid vocational training system, such as FL1, can be affected by this trend from time to time.
The effect of the Bosman case on the transfer market for French players is exacerbated by the present state of the players’ agent profession. In France, this profession is governed by a code, which forbids agent remuneration higher than 10% of the transaction and prohibits members of certain professions, such as sports club manager, from becoming agents. However, a number of non-registered agents circumvent these rules, and operate in a rigged market where bungs and embezzlements are common practice according to various official reports.5 Conflicts of interest among agents, club managers and players fuel such malpractice (Brocard, 2010). As a result a study was launched in France in 2005 on reform of the player‟s agent profession. A new set of regulations came into force in 2008, opening up the profession to foreign agents and attempting to improve the transparency of transactions. A numerus clausus, or entry barrier into the profession, was introduced. A player could allow the club to remunerate his agent, instead of the agent being paid by the player himself, legalising the former common practice, but also creating the potential for conflicts of interest. The position of agents was somewhat strengthened by the 2008 changes. However, in 2010, the French Parliament prohibited the remuneration of agents by sports clubs, with a view to reducing conflicts of interest, and made the sanctions heavier for breaching the rules (up to two years in prison and a €30,000 fine). It is too early to assess the efficiency of this new legislation, which is difficult to enforce in a still non-transparent business.
A non-negligible input to football clubs‟ activity is provided by managers, trainers and coaches. In European football in particular, when a club‟s sporting performance is disappointing to the fans, the manager or coach is often sacked before the end of season, either to create a psychological shock for the team or change the playing tactics, or in the hope of hiring a higher-quality replacement. It has been demonstrated that firing the coach before the end of season is counter-productive using English (Dobson and Goddard, 2001) and Belgian data (De Dios and Forrest, 2007). Similar results have been reported for French football (Llorca and Teste, 2010). On average, sporting outcomes improve after a change of coach, but econometric testing does not clearly confirm that the improvement can be attributed to the new coach. French clubs that fired their coaches during the course of the
5 Such as the Stevens report in England in 2006.
11
football season obtained poorer results on average than similar (poorly ranked, in bad shape) clubs that retained their coaches.
3. Are French professional football clubs efficient?
The contrast between the outcomes of French professional football and the resources it mobilises immediately raises questions about the efficiency of French football clubs. Two papers tackle the issues of technical efficiency and scale efficiency in French football clubs, using Data Envelopment Analysis (DEA). This methodology does not require any assumptions as regards the objective function of the club‟s manager or owner, and measures efficiency using a framework that takes into account both sporting and financial inputs and outputs. Jardin (2009) finds that, contrary to other estimations for foreign leagues, the strongest FL1 teams and the most profitable clubs are not the most efficient units in his sample (14 clubs over three seasons, 2004-2007). Club inputs are: total payroll, as a proxy for the team‟s stock of talent; and the home city population, as a proxy for market size and potential municipal subsidies that can be captured. Club outputs are: the number of points at the end of season, as a measure of sporting achievement; and club turnover, as a measure of financial performance.
Regarding the results, pure technical efficiency scores provide information about high/low managerial efficiency, while scale efficiency scores show whether the club size is optimal or not.
A high average score implies that FL1 is efficient: more than one-third of clubs are on the best practice frontier with an average score of 0.85 (the maximum is 1) for pure technical and scale efficiency. Scale inefficiency is the main source of inefficiency in FL1. On average the clubs‟ performance is stable over time, but some decline in efficiency is observed, primarily due to the deterioration of the environment that the author interprets as the effect of wage inflation in FL1; the latter has exceeded growth in turnover, as noted above. In most cases, French clubs are oversized in terms of inputs, since they overinvest in player talents at the start of each football season. Therefore, the efficiency of club management may be questioned, and lax management seems to reflect weak club governance.
A more recent paper addresses issues of technical and scale efficiency, again using the DEA methodology, for 49 clubs in Ligue 1 and Ligue 2 from 2003 to 2008 (Miningou and Vierstraete, 2012). Club inputs are first payrolls, and second all other club expenditures (transportation costs, commodity purchases, and so on). Two other inputs are included to control for the quality of the club‟s environment: a divisional dummy (Ligue 1 or Ligue 2) and
12
a dummy for participation in UEFA competitions. Outputs are the number of points at the end of season and game attendance.
The average efficiency score is only 0.625, suggesting that French clubs could have obtained the same output level with 37.5% less input. Among the least efficient, Paris Saint Germain could have saved 80% of its inputs and achieved a similar outcome by operating at maximum efficiency. Average efficiency is higher in Ligue 2 (0.849) and among those clubs that did not participate in UEFA competitions. However, in both leagues, average efficiency decreases over time, due to player salary inflation. Finally, sporting performance (the club‟s ranking) and efficiency are not correlated; neither are game attendance and efficiency. The authors again raise the issue of lax management.
4. The sources of French football finance: from TV-dependence to sugar daddies
Three pillars are alleged to be specific to French professional football: its aforementioned system of player vocational training, a strong ethos of solidarity within the league, and its financial control and auditing (Gouguet and Primault, 2006). Another pillar is common to all European football: a financial model that is increasingly reliant on TV revenue.
Solidarity is no longer based on sharing gate receipts between the hosts and visiting clubs, which was phased out in the early 1980s. Since then a revenue redistribution scheme relies on the collective sale of TV broadcasting rights by the league, which collects the TV revenues through contracts signed with the TV companies at four-year intervals. Originally, the redistribution scheme was egalitarian, with equal shares of TV revenues being allocated to each FL1 club. Since 2000, the criteria for revenue distribution have become increasingly complex and non-egalitarian. One portion is fixed and equal for all clubs. A second portion depends upon the clubs‟ rankings at the end of each season. A third portion is indexed to the club‟s performance over the past five seasons. A final portion is calculated according to the club‟s attractiveness, measured by its TV audience - this criterion was introduced in response to pressure from the clubs with the most TV exposure. Table 8 shows that the league champions in 2010 received three times more TV revenue than one of the lowest-ranked non-relegated clubs (Sochaux) and roughly four times more than the three non-relegated clubs. Ligue 2 clubs also receive a (small) share of the TV revenue windfall, although their games were not broadcast at all until recently. Legislation passed in 2000 requires the redistribution of a 5% tax on professional football TV revenues to non-professional sports, through the National Council for Sport Development (CNDS: Conseil National de Développement du Sport).
13
Insert Table 8 about here
The main debate surrounding the distribution of TV revenues is no longer the question of league competitive balance. The distribution depends on pressure and the relative bargaining power of a small number of rich clubs that are the subject of most of the TV coverage, and the majority of smaller clubs. For the formula for the distribution of the TV revenue reflects a minimal commitment to the principle of solidarity between all professional football clubs on the one hand and, on the other hand, is enforced by law to maintain solidarity between professional football and other less endowed sports that do not benefit from similar TV exposure. Since 2000, however, the solidarity principle has been counteracted by the TV windfall obtained from the UEFA Champions League, which is concentrated on the few clubs qualified to enter this competition. However, this driver towards increasing revenue inequality across the clubs is milder in FL1 than in other major European leagues, because of the French clubs‟ relatively poor performance in the Champions League.
As early as 1974 the supervision of professional football clubs‟ management has been entrusted to a body which became the DNCG in 1990. Since then, DNCG acted as a real auditing body, capable of implementing disciplinary sanctions against poorly managed clubs. Every season, the DNCG inspects the financial accounts of all clubs, and since 2002 some of the data have been published, even though initially some clubs in debt attempted to circumvent the requirement to publish their financial data (Andreff, 2007b). The DNCG‟s main official tasks are to audit clubs‟ financial accounts, supervise their bookkeeping, detect instances of misreporting, and assess the clubs‟ financial situation.
When a club is continually in the red, the DNCG can use carrot-and-stick tactics to encourage changes of management practice, so that the club‟s accounts return to the black. The process begins with warnings, advice and recommendations with regard to urgent policy measures to be taken by the clubs‟ management. If the financial deficit does not disappear, sanctions can be applied: the DNCG is allowed to audit the payroll in detail, to prohibit the recruitment of new players for a certain period, to impose fines and, as a last resort, to relegate the club to a lower division. Several clubs have been relegated since 1990 under this provision, namely Angoulême, Bordeaux, Brest, Grenoble, Marseille, Nice and Toulouse. The objective is to ensure the financial viability of the French championship in the sense that any club which starts the competition must be able to complete its fixture list over the entire season. In other words, the DNCG guarantees that each club will have sufficient financial resources throughout the season. The auditing body has prevented French clubs from sinking as deeply
14
into indebtedness as some big Italian and Spanish clubs, or top English clubs such as Chelsea, Manchester United and Arsenal.
To a foreign observer, it may seem strange that on the one hand French football has a strong auditing body, while on the other hand FL1 repeatedly reports financial deficits. This paradox can be explained by a soft budget constraint (5 infra) linked to weak club governance. Questions have also been raised as to whether DNCG is an independent auditor. All of its members are appointed from football backgrounds such as FFF, LFP and players‟, coaches‟ and managers‟ trade unions. A useful reform would be the appointment of at least 50% of the experts who sit on the DNCG from non-football backgrounds.
The model of French professional football finance has much in common with other major European leagues. Since the mid-1990s the bigger clubs have largely abandoned their former financial structure, primarily based on Spectators (gate receipts), Sponsors and Subsidies from Local sources – the SSSL model as described in Andreff and Staudohar (2000) – and switched to a MCMMG model of finance based on new Global sources of revenue, such as Media (TV revenue), Corporations, Merchandising and Markets. FL1 is so typical of MCMMG (Table 9) that its financial structure has been described as TV-dependent or even “TV-addicted”. The share of TV revenue in total revenue reached 58% in 2011 and 2012, almost as high as in Italian Calcio (over 60% since 2006).
Insert Table 9 about here
With regard to merchandising and stadium naming rights, French clubs derive a smaller share of their revenue from these sources than some European clubs, such as Manchester United (merchandising) or Arsenal (naming rights). Le Mans signed a naming rights contract with an insurance company some years ago, but it was later relegated to the second division.
The markets that are used for club financing are the labour market for talents by football nursery clubs (2 supra), and capital markets in the form of initial public offerings (IPOs) prior to stock market floatation. In 2012 Malcolm Glazer sold 10% of Manchester United stocks on the New York Stock Exchange, raising $233 million. In some sense, he is swimming against the tide, since the number of listed European football clubs which had reached 44 in the early 2000s, was down to 21 in 2012. The stock market valuation of many listed clubs had fallen, for several reasons: illiquidity of the DJ StoXX Football market, share price volatility, the impact of (poor) sporting performance on a club‟s stock price, uncertainty attached to the fundamental value of football clubs heavily dependent on intangible assets (the non-amortised value of players‟ contracts), and finally the low profitability of such investments (Aglietta et al., 2008). French legislation passed in October 2006, allowing sport club shares to be
15
publicly offered and floated, has linked IPOs to the acquisition of tangible assets likely to reinforce the club‟s stability and durability. Olympique Lyonnais backed its IPO in 2007 with a project of OL land – a sporting and commercial centre including a 60,000 seat stadium – while FC Istres (2nd division) linked an IPO to the construction of a hotel and a re-education centre for high level sportsmen and women. Since flotation Olympique Lyonnais shares have lost more than 80% of the IPO value, and FC Istres shares have lost more than 60%. Overall, French football‟s experience of using stock market flotation to raise capital has not been encouraging.
French clubs whose ownership is in the hands of a corporation or a wealthy individual are fewer in number than in EPL and ILC, but have included RC Paris (Matra), RC Strasbourg (McCormack‟s IMG) and more recently Rennes (François Pinault), Grenoble (Index Corporation, Japan) and Nantes (Waldemar Kita). Until recently, no French club had attracted big foreign “sugar daddy” investment, as is common in EPL6. However, there have been signs of an emerging trend. In June 2011, Qatar Sports Investment purchased 70% of Paris Saint Germain stock and spent €85 million on the mercato for acquiring star players. The club finished second in the 2011-12 championship. Further recruitment of star players (Zlatan Ibrahimovic and Thiago Silva) has taken place subsequently. In December 2011, Dmitri Rybolovlev, a Russian oligarch (owner of the potash company Uralkali) bought the newly relegated AS Monaco, and provided investment aimed at securing swift promotion. Unlike EPL, at the time of writing French football had not attracted any large-scale American investment.
Sugar daddies sometimes bail out a club in the red, which otherwise should have entered administration (in EPL) or been relegated because of a financial deficit (LFP). Paris Saint Germain was a case in point, with a poor financial position and rather weak sporting performance. The new UEFA Financial Fair Play regulation limits losses to €45 million over three years, with external investment permitted to cover current deficits in 2013-14 and 2014-15, with the allowance reducing to €30 million by 2017-18. These regulations will impose restrictions on the extent of possible bail-outs, but will still permit a club to be subsidised by a sugar daddy in a limited way. No doubt, some French clubs may continue to seek foreign investment. However, repeated, even limited, deficits, debts and bail-outs mean that French (and European) football clubs operate with a soft budget constraint.
6 Al-Fayed in Fulham, Abramovich in Chelsea, Glazer in Manchester United, Gaydamak in Portsmouth, Lerner in Aston Villa, Gudmundsson in West Ham, Hicks and Gillett then NESW in Liverpool, Sheikh Mansour in Manchester City, Usmanov in Arsenal, Mittal then Ecclestone in QPR.
16
5. Soft budget constraint, TV rights revenues and the financial crisis
Since European football is now essentially deregulated, and in general football clubs do not aim for profit-maximisation, an increasing number of professional clubs run heavy deficits, season after season, and have sunk into deep indebtedness. However, bankruptcy is a rare event, since many clubs have been bailed out, by the banks in Spain (Ascari and Gagnepain, 2006), occasionally by the state (in Italy, the salve calcio state plan in 2002, Baroncelli and Lago, 2006), or increasingly by sugar daddy investors. TV companies have regularly helped cover ex post the leagues‟ deficits by increasing the sums paid for TV rights (Andreff, 2009). In general clubs in the red throughout Europe have not been liquidated, despite heavy arrears on debt repayments, social contributions and tax.Football clubs have spent seemingly without constraint, purchased more inputs than they could afford given their revenues, and have attempted endlessly to recruit expensive superstar players. In this context, economic theory suggests that the firms (clubs) are subject to a soft budget constraint. This situation is typical of a shortage (Kornaï, 1980) or repressed inflation (Benassy, 1982) economy, similar to the former centrally-planned economies, which can also emerge in particular industries in market economies (Kornaï et al., 2003). A case in point is a sports league with clubs that do not maximise profit. Storm and Nielsen (2012) cite evidence supporting the existence of a soft budget constraint in professional football, and stress that European professional football clubs continually operate on the brink of insolvency without going out of business. The survival rate is high,7 even though the football business perpetually generates losses. Tables 5 and 6 have documented that French football is no exception in this respect. Since the very existence of payment arrears is a well-known index of poor corporate governance, one interpretation of such a situation is in terms of weak club and league governance (Andreff, 2007a, b; Andreff, 2012). It suggests that a disequilibrium model may be more useful in describing an open sports league (Andreff, 2014) than the usual equilibrium model elaborated on by Késenne (2007).
In respect of FL1, like most European football leagues, there is a close association between the rise in TV revenue and payroll inflation. An optimistic interpretation suggests a virtuous circle: TV revenues enable teams to pay high salaries in order to field highly performing squads, whose frequent wins accrue increased TV revenues (Baroncelli and Lago, 2006).
17
Italian Calcio, which is the authors‟ reference, is in the deepest financial crisis and seems difficult to reconcile with the notion of a virtuous circle. Under a vicious circle interpretation, the league, as a monopoly supplier in its own market, bargains for the highest possible TV rights in order to raise ex post the finance that will cover rampant payroll inflation and the escalating costs of superstar recruitment. If this strategy is successful, it will sustain league finances and to some extent bail out football clubs that are in the red. However, in many football leagues, like FL1, the recruitment strategy financed by TV revenue does not translate into sufficient team improvement to produce success in European competition, as required to achieve substantial gains in revenue. With the clubs unable to recoup their recruitment expenditures, the league has to revert to the broadcasters in an effort to negotiate an even higher price for the TV rights, and so on. The direction of causality in the relationship between TV revenues and payroll can be tested, in order to validate the vicious circle assumption. Our test is confined to the two French professional football leagues. The sample encompasses 213 observations from seasons 2002-03 to 2007-08. Under the vicious circle interpretation, TV revenues are the endogenous variable, explained by the following exogenous instrumental variables:
POP 2005, 2005 population of the city where the team is located;
NOT represents the media attractiveness of each team, using its ranking by LFP according to audience performance;
DIST is a proxy for the distance that TV channels have to cover in order to reach the stadium of each team. DIST is measured using team transportation costs (available from team budgets), which is a suitable proxy, since it measures the costs incurred for a team to travel to all other stadiums in the league (similar to the costs imposed a TV channel that travels to all stadiums for broadcasting purposes). We test the relationship:
TV = k + a.POP2005 + b.DIST + c.NOT + d.LEAGUE + e.Year2 + f.Year3 + g.Year4 + h.Year5 + i.Year 6 + zi (1)
Equation (1) includes a league dummy variable (LEAGUE = 1 if Ligue 2 and LEAGUE = 0 if Ligue 1), and a dummy variable to test whether the relationship is sensitive to the observation year (2003 being the reference year). We then examine the relationship between payroll (salaries and compulsory social contributions) and the endogenous regressor TV. Staiger and Stock (1997) have demonstrated that, when instrumental variables are weak, conventional asymptotic results do not hold with large samples. If the F-statistic is smaller than 10 with a
18
single endogenous regressor, there is a potential issue of a weak instrumental variable. To be relevant, our test must exhibit F > 10, which is the case.
Insert Tables 10 and 11 about here
The relationship between the TV variable and instrumental variables is significant in all four specifications of model (1). Playing in a higher division is also significant. The observation year is not significant, except in 2007 and 2008 when tough bargaining on the part of the TV companies resulted in an agreement, reached in February 2008, in which the value of the TV rights was almost unchanged. The relationship between payroll and TV revenues is significant in all specifications, and the hypothesis of a vicious circle in which TV revenues determine salaries is supported. Even though UEFA Financial Fair Play sends a signal in the right direction of hardening the clubs‟ budget constraints, it might not be sufficiently onerous to dismantle this vicious circle. A hard budget constraint would preclude the clubs from running any deficits, and strict enforcement would be required. The extent to which UEFA Financial Fair Play is enforced remains to be seen.
Since the 2008-09 season FL1, in common with most other European football leagues, has been affected by the impact of the global financial and economic crisis: attendance has decreased slightly (Figure 1), and the league‟s revenues have stagnated (Table 5). This has translated into harsher times, with 20 clubs exhibiting pre-tax deficits in the two divisions in 20118. Six clubs have moved beyond the €5 million UEFA annual deficit allowance, and will have to adjust in 2013. Against this bleak background, the good news is the recently increased attractiveness of French professional football to international media, which has materialised through the creation of BeIn1 and BeIn2 channels by the Qatari company Al-Jazeera. Be-In has invested €150 million for live broadcasts of 8 out of 10 televised games during the week. This cash injection adds to the €420 million spent by Canal+ to broadcast two games each weekend on prime time TV. Renewed competition between two TV channels put an end to four years of slowdown in the growth of football TV revenues, owing to the monopoly position of Canal+ in the market. This represents good news for the future of French football finance.
6. Conclusion: Which future for French professional football?
8 In million €: Bordeaux 6.5), Caen 1.6), Lens 5.9), Lille 8.7), Lyon 35.1), Marseille 14.7), Monaco (-0.3), Nice (-1.2), Paris Saint Germain (-0.2 after bail out), Valenciennes (-3.7); and in Ligue 2 : Ajaccio (-2.6), Angers (-0.7), Châteauroux (-0.2), Evian TG (-0.6), Istres (-0.4), Le Havre (-1.5), Le Mans (-2.9), Metz (-5.5), Sedan (-0.2), Troyes (-1.6).
19
FL1 is neither much different from other major European football leagues, nor an exception as regards its management and governance. In common with other leagues, a soft budget constraint triggers wage inflation and heavy dependence on TV revenue. No major French club has gone bankrupt, although many have been in the red. This feature, however, is not French-specific but industry-specific, since the picture is similar in other major European football leagues. In some respects French football shows signs of convergence with the latter, especially regarding the opening up of French football to international investors, to a foreign broadcaster, to Russian and Qatari sugar daddies, and to global football on-line betting. Eventually, French football will have to align with the new UEFA Financial Fair Play rules. This will be a step forward, as in many other European countries, on the path to better governance and management. Nevertheless, the imposition of a hard budget constraint of a kind that is characteristic of shareholder-controlled profit-maximising firms in many other sectors, is a distant prospect. The last published 2011 LFP report, following the October 2010 “football States General” triggered by the poor behaviour of the national squad at the 2010 World Cup, calls for governance reform and the creation of a Football High Authority, but does not go as far as recommending the imposition of a hard budget constraint. An urgent priority is the tightening the enforcement of on-line betting regulation, and the supervision of bets by a state regulator (ARJEL: Autorité de Régulation des Jeux en Ligne). This was introduced in June 2011, to address concerns that sporting integrity may have been undermined by rigged bets staked by international networks into fixed matches.
20 References
Aglietta M., Andreff W., Drut B., Bourse et Football, Revue d’Economie Politique, 118, (2), 2008, 255-96. Andreff W., French Football: A Financial Crisis Rooted in Weak Governance, Journal of Sports Economics, 8 (6), 2007a, 652-61.
Andreff W., Governance Issues in French Professional Football, in: P. Rodriguez, S. Késenne, J. Garcia, eds.,
Governance and Competition in Professional Sports Leagues, Ediciones de la Universidad de Oviedo 2007b,
55-86.
Andreff W., Equilibre compétitif et contrainte budgétaire dans une ligue de sport professionnel, Revue
Economique, 60 (2), 2009, 591-634.
Andreff W., Why Tax International Athlete Migration? The „Coubertobin‟ Tax in a Context of Financial Crisis, in: J. Maguire and M. Falcous, eds., Handbook on Sport and Migration, Abingdon: Routledge 2010, 31-45. Andreff W., Mondialisation économique du sport. Manuel de référence en économie du sport, Bruxelles: De Boeck 2012.
Andreff W., Building Blocks for a Disequilibrium Model of a European Team Sports Leagues, International
Journal of Sport Finance, 9 (1), 2014, 20-38.
Andreff W., Bourg J.-F., Broadcasting Rights and Competition in European Football, in: C. Jeanreaud, S. Késenne, eds., The Economics of Sport and the Media, Cheltenham: Edward Elgar 2006, 37-70.
Andreff W., Raballand G., Is European Football Future to Become a Boring Game?, in: W. Andreff, ed.,
Contemporary Issues in Sports Economics: Participation and Professional Team Sports, Cheltenham: Edward
Elgar 2011, 131-67.
Andreff W., Staudohar P., The Evolving European Model of Professional Sports Finance, Journal of Sports
Economics, 1 (3), 2000, 257-76.
Ascari G., Gagnepain P., Spanish Football, Journal of Sports Economics, 7 (1), 2006, 76-89. Baroncelli A., Lago U., Italian Football, Journal of Sports Economics, 7 (1), 2006, 13-28. Benassy J.-P., The Economics of Market Disequilibrium, New York: Academic Press 1982.
Besson E., Accroître la compétitivité des clubs de football professionnel français, Rapport au Premier Ministre du Secrétariat d‟Etat chargé de la Prospective, de l‟Evaluation des Politiques Publiques et du Développement de l‟Economie Numérique, Paris, 2008.
Bolotny F., Football in France, in: W. Andreff and S. Szymanski, eds., Handbook on the Economics of Sport, Cheltenham: Edward Elgar 2006, 497-513.
Bolotny F., Debreyer D., Nouveaux stades: quel impact sur l‟économie des clubs de football français ?, in: P. Chaix, ed., Les grands stades, Paris: L‟Harmattan 2011, 173-213.
Bourg J.-F., Gouguet J.-J., The Political Economy of Professional Sport, Cheltenham: Edward Elgar 2010. Brocard J.-F., Marchés des transferts et agents sportifs: le dessous des cartes, Géoéconomie, 54, 2010, 79-89. Buraimo B., Simmons R., Do Sports Fans Really Value Uncertainty of Outcome? Evidence from the English Premier League, International Journal of Sport Finance, 3 (3), 2008, 146-55.
Collin Y., ed., Quels arbitrages pour le football professionnel?, Les Rapports du Sénat, n° 236, French Senate, Paris, 2004.
Dawson P., Downward P., Participation, Spectatorship and Media Coverage in Sport: Some Initial Insights, in: W. Andreff, ed., Contemporary Issues in Sports Economics: Participation and Professional Team Sports, Cheltenham: Edward Elgar, 2011b, 15-42.
De Dios Tena J., Forrest D., Within-season Dismissal of Football Coaches: Statistical Analysis of Causes and Consequences, European Journal of Operational Research, 181 (1), 2007, 362-73.
Denis J.-P., Certains aspects du sport professionnel en France, Rapport au Ministre de la Jeunesse et des Sports, Paris 2003.
Dobson S.M., Goddard J.A., Performance and Revenue in Professional League Football: Evidence from Granger Causality Tests, Applied Economics, 30, 1998, 1641-51.
Dobson S.M., Goddard J.A., The Economics of Football, Cambridge: Cambridge University Press 2001. Drut B., Economie du football professionnel, Repères 578, Paris : La Découverte 2011.
Ericson T., The Bosman Case: Effects of the Abolition of the Transfer Fee, Journal of Sports Economics, 1 (3), 2000, 203-18.
Gouguet J.-J., Primault D., The French Exception, Journal of Sports Economics, 7 (1), 2006, 47-59.
Hall S., Szymanski S., Zimbalist A., Testing Causality between Team Performance and Payroll. The Cases of Major League Baseball and English Soccer, Journal of Sports Economics, 3 (2), 2002, 149-68.
Jardin M., Efficiency of French Football Clubs and its Dynamics, University of Rennes 1 / CNRS-CREM, mimeo 2009.
Késenne S., The Economic Theory of Professional Team Sports: An Analytical Treatment, Cheltenham: Edward Elgar 2007.
21
Kornaï J., Maskin E., Roland G., Understanding the Soft Budget Constraint, Journal of Economic Literature, 61, 2003, 1095-136.
Kuper S., Szymanski S., Why England Lose & Other Curious Football Phenomena Explained, London: Harper Collins 2009.
Llorca M., Teste T., Impact des changements d‟entraîneur sur les performances sportives des équipes de football: le cas du championnat de France de Ligue 1, Revue Européenne de Management du Sport, 25, 2010.
Llorca M., Teste T., Performance sportive, déséquilibre compétitif et instabilité financière des clubs de football professionnel: une approche par la causalité de données de panel sur le championnat de France, Séminaire DESport, Paris, mimeo, 2012.
Miningou E.W., Vierstraete V., Efficience des clubs français de football des Ligues 1 et 2, Revue d’Economie
Politique, 122 (1), 2012, 37-66.
Sloane P., Rottenberg and the Economics of Sports after 50 Years: An Evaluation, in: P. Rodriguez, S. Késenne & J. Garcia, eds., Sports Economics after Fifty Years: Essays in Honour of Simon Rottenberg, Ediciones de la Universidad de Oviedo 2006, 211-26.
Staiger D., Stock J.H., Instrumental Variables Regression with Weak Instruments, Econometrica, 65, 1997, 557-86.
Storm R.K., Nielsen K., Soft Budget Constraints in Professional Football, European Sport Management
Quarterly, 12 (2), 2012, 183-201.
Szymanski S., Kuypers T., Winners and Losers: The Business Strategy of Football, Harmondsworth: Viking 1999.
Szymanski S., Smith R., The English Football Industry: Profit, Performance and Industrial Structure,
22
Table 1: Performance of European major leagues in UEFA competitions, 2000-2012
Champions League English EPL French FL1 German BL Italian LC Spanish LF
Number of winners from 2 0 1 3 5
Number of 1/4 finalists 30 7 11 17 25
Europa League English EPL French FL1 German BL Italian LC Spanish LF
Number of winners from 1 0 0 0 5
Number of 1/4 finalists 11 6 14 7 22
Total English EPL French FL1 German BL Italian LC Spanish LF
Number of winners from 3 0 1 3 10
Number of 1/4 finalists 41 13 25 24 47
23
Table 2: Competitive balance in five European major football leagues (1997-2012)
A/ Noll-Scully index
Season French L1 English EPL Italian LC Spanish LF German BL
1996/97 1,47 1,23 1,33 1,61 1,43 1997/98 1,31 1,28 1,76 1,39 1,14 1998/99 1,42 1,52 1,35 1,41 1,52 1999/2000 0,88 1,69 1,65 1,03 1,43 2000/01 1,15 1,43 1.60 1,29 1,14 2001/02 1,18 1,72 1,71 1,14 1,54 2002/03 1,28 1,62 1,56 1,32 1,23 2003/04 1,46 1,57 1,86 1,28 1,61 2004/05 1.10 1,73 1,45 1,51 1.50 2005/06 1,44 1,94 1,97 1,49 1,53 2006/07 1,06 1,64 1,78 1,39 1.30 2007/08 1,36 2,09 1.60 1,46 1,47 Mean 96/08 1.26 1.62 1.64 1.36 1.40 2008/09 1.58 1.91 1.59 1.50 1.59 2009/10 1.60 1.87 1.56 1.84 1.53 2010/11 1.25 1.33 1.52 1.71 1.38 2011/12 1.48 1.78 1.56 1.70 1.60 Mean 08/12 1,48 1,72 1,56 1,69 1.53 Mean 96/12 1.32 1.65 1.62 1.44 1.58
24 B/ Spearman rank correlation between season t and season t-1 rankings
Season t French L1 English EPL Italian LC Spanish LF German BL
1996/97 0.50 0,63 n.d. 0,55 0,34 1997/98 0,46 0,43 0,65 0,61 0,39 1998/99 0,49 0,71 0,53 0,71 0,37 1999/2000 0,24 0,83 0,81 0,59 0.70 2000/01 0.00 0,88 0,85 0,65 0,25 2001/02 0,08 0,61 0,75 0,61 0,69 2002/03 0,28 0,63 0,62 0,55 0,53 2003/04 0.60 0,43 0,81 0,45 0,44 2004/05 0,68 0,45 0,64 0,59 0,61 2005/06 0,67 0,66 0,43 0,48 0,75 2006/07 0,48 0,66 0,52 0,58 0,72 2007/08 0.20 0,66 0,65 0,59 0,49 2008/09 0.23 0.70 0.80 0.87 0.65 2009/10 0.71 0.75 0.59 0.63 0.34 2010/11 0.33 0.87 0.46 0.60 0.09 2011/12 0.48 0.86 0.75 0.40 0.09
25
Table 3: Regression of average fan attendance on the average number of goals scored 1997-2010
Model 1 Model 2
Independent variables Coefficient
Standard
error P>|t| Coefficient
Standard
error P>|t| Average number of goals /game 18.918 3.236 0.000*** -1.460 3.260 0.656
GER dummy 16.434 1.998 0.000***
SPA dummy 4.960 1.580 0.003***
ENG dummy 13.343 1.470 0.000***
ITA dummy 6.298 1.509 0.000***
Constant -21.263 8.457 0.014** 23.640 7.611 0.003***
26
Table 4: The percentage of registered* football players in the population
Year England France Germany Italy Spain
2000 5.4 4.7 7.6 7.0 6.1
2006 6.9 5.2 7.7 8.6 7.0
* Registered in their national federation. Source: FIFA Big Count.
Table 5: Turnover, pre-tax cash balance and transfer fee balance in French
professional football (million €)
1999-00 2000-01 2001-02 2002-03 2003-04 2004-05 2005-06 2006-07 2007-08 2008-09 2009-10 2010-11 Turnover Ligue 1 607 608 643 689 655 697 910 972 989 1,048 1,072 1,041 Ligue 2 120 124 134 135 137 165 186 206 222 229 200 202 Total 727 732 777 824 792 862 1,096 1,178 1,211 1,277 1,272 1,243 Cash balance Ligue 1 2.2 -53.6 -46.3 -151.2 -35.9 -32.5 27.7 42,7 25.0 -14,7 -114,1 -46.1 Ligue 2 1.4 -14.2 -20.2 -15.8 -8.0 5.5 5.0 4,1 1,8 -18,9 -15,9 -18.9 Total 3.6 -67.8 -66.5 -167.0 -43.9 -27.0 32.7 46,8 26,8 -33,6 -130.0 -65.0
Transfer fee balance
Ligue 1 8.1 -19.3 -68.1 -100.2 17.9 3.0 14.7 31.7 58.8 41.9 -91.7 73.4
Ligue 2 19.5 26.0 21.0 10.3 15.5 12.2 11.8 20.1 21.1 37.3 16.5 18.5
Total 27.6 6.7 -47.1 -89.9 33.4 15.2 26.5 51.8 79.9 79.2 -75.2 91.9 Source:
27
Table 6 : Ligue 1 balance sheet (million €)
Ligue 1 1999-00 2000-01 2001-02 2002-03 2003-04 2004-05 2005-06 2006-07 2007-08 2008-09 2009-10 2010-11 Intangible fixed assets* 341.2 434.7 346.5 249.8 167.1 194.3 262.9 266.6 346.1 339.2 356.5 273.8 Other fixed assets 41.6 45.3 60.2 75.2 75.8 90.2 102.4 95.2 116.0 103.7 112.2 114.8 Circulating assets 295.9 332.2 329.0 237.8 265.6 274.3 266.1 339.1 369.4 355.3 348.2 363.0 Liquidities 124.5 117.1 111.5 157.7 92.5 108.9 187.9 191.9 168.2 149.5 112.4 173.5 Total Assets 803.2 929.3 847.2 720.5 601.0 668.7 819.3 892.8 999.7 947.7 929.3 925.1 Own capital 89.3 84.0 142.8 93.2 139.4 111.7 159.6 208.6 213.4 265.6 189.0 183.7 Stockholders accounts 163.5 223.1 141.7 119.9 60.1 53.1 75.2 51.2 61.8 56.6 104.9 100.9 Provisions, risks 123.0 101.0 59.6 49.9 37.3 37.5 52.5 54.0 34.6 32.7 25.4 29.0 Financial debts 64.5 96.3 86.1 112.7 66.1 63.0 70.4 71.3 62.4 60.2 94.2 87.2 Other debts ** 362.9 424.9 416.9 344.8 298.1 403.4 461.6 507.7 627.6 532.6 515.7 524.3 Total Liabilities 803.2 929.3 847.2 720.5 601.0 668.7 819.3 892.8 999.7 947.7 929.3 925.1 * Players transfer fees not yet amortised.
** Payment arrears, tax and social contribution arrears. Source: LFP/DNCG
28
Table 7: Ratio between gross payroll* and European football clubs total revenues
(in %) League 1999-00 2000-01 2001-02 2002-03 2003-04 2004-05 2005-06 2006-07 2007-08 2008-09 German BL 56 54 53 50 55 47 51 45 50 51 English EPL 62 60 62 61 61 59 62 63 62 67 Spanish LF 54 73 72 72 64 64 64 62 63 63 Italian LC 62 75 90 76 73 62 58 62 68 73 French FL1 53 64 69 68 69 63 59 64 71 69
* Salaries and associated social contributions. Source: Deloitte
29
Table 8: Redistribution of TV rights revenues across Ligue 1 clubs, 2009-2010 (millions euros)
Season Club Fixed Portion based Portion based on Portion based on Total rank portion on season rank past 5 seasons ranks audience/notoriety
1 Marseille 12.4 17.9 3.1 17.4 50.8 2 Lyon 12.4 15.6 3.6 15.0 46.6 3 Auxerre 12.4 13.5 1.6 2.8 30.4 4 Lille 12.4 11.8 2.3 7.6 34.1 5 Montpellier 12.4 10.2 0.2 1.2 24.1 6 Bordeaux 12.4 8.9 2.7 10.2 34.2 7 Lorient 12.4 7.7 0.4 1.0 21.6 8 Monaco 12.4 6.7 1.6 3.7 24.5 9 Rennes 12.4 5.8 2.0 5.7 26.0 10 Valenciennes 12.4 5.1 0.3 1.3 19.2 11 Lens 12.4 4.4 0.8 6.5 24.1 12 Nancy 12.4 3.8 0.5 2.4 19.2 13 Paris St Germain 12.4 3.3 0.9 12.9 29.5 14 Toulouse 12.4 2.9 1.0 3.2 19.6 15 Nice 12.4 2.5 1.0 1.8 17.8 16 Sochaux 12.4 2.2 0.6 2.1 17.3 17 Saint-Etienne 12.4 1.9 1.3 8.8 24.4 18 Le Mans 12.4 0 0.5 1.5 14.4 19 Boulogne 12.4 0 0.2 0.7 13.3 20 Grenoble 12.4 0 0.3 0.9 13.6 Source: LFP.
30
Table 9: The structure of French Ligue 1 finance, 1996-2012
Season Gate receipts Subsidies Sponsors TV revenues Others* Total
1995-96 24 17 22 31 6 100 1996-97 22 15 26 32 5 100 1997-98 21 12 20 42 5 100 1998-99 22 10 20 42 6 100 1999-00 17 4 16 56 7 100 2000-01 16 4 18 51 11 100 2001-02 15 3 20 52 10 100 2002-03 15 4 20 52 9 100 2003-04 18 4 22 47 9 100 2004-05 19 3 20 49 9 100 2005-06 15 3 18 57 7 100 2006-07 22 2 16 53 7 100 2007-08 14 2 20 56 8 100 2008-09 14 2 18 55 11 100 2009-10 13 2 16 57 12 100 2010-11 13 2 17 58 10 100 2011-12 13 2 18 58 9 100 * Includes Merchandising Source: DNCG.