Control of human hemoglobin switching by
LIN28B-mediated regulation of BCL11A translation
The MIT Faculty has made this article openly available.
Please share
how this access benefits you. Your story matters.
Citation
Basak, Anindita et al. "Control of human hemoglobin switching
by LIN28B-mediated regulation of BCL11A translation." Nature
Genetics 52, 2 (January 2020): 138–145 © 2020 The Author(s)
As Published
http://dx.doi.org/10.1038/s41588-019-0568-7
Publisher
Springer Science and Business Media LLC
Version
Author's final manuscript
Citable link
https://hdl.handle.net/1721.1/130398
Terms of Use
Creative Commons Attribution-Noncommercial-Share Alike
Control of human hemoglobin switching by LIN28B-mediated
regulation of BCL11A translation
Anindita Basak1,2,3,14,*, Mathias Munschauer3,14, Caleb A. Lareau1,2,3,4, Kara E.
Montbleau1,2,3,5, Jacob C. Ulirsch1,2,3,4, Christina R. Hartigan3, Monica Schenone3, John Lian6, Yaomei Wang7, Yumin Huang7,8, Xianfang Wu9, Lee Gehrke6, Charles M. Rice9, Xiuli An7,10, Helen A. Christou11, Narla Mohandas7, Steven A. Carr3, Jane-Jane Chen6, Stuart H. Orkin1,2,3, Eric S. Lander3,12,13, Vijay G. Sankaran1,2,3,*
1Division of Hematology/Oncology, Boston Children's Hospital, Harvard Medical School, Boston, MA, USA.
2Department of Pediatric Oncology, Dana-Farber Cancer Institute, Harvard Medical School, Boston, MA, USA.
3Broad Institute of Massachusetts Institute of Technology and Harvard, Cambridge, MA, USA. 4Program in Biological and Biomedical Sciences, Harvard Medical School, Boston, MA, USA. 5Boston University School of Medicine, Boston, MA, USA.
6Institute for Biomedical Engineering and Science, Massachusetts Institute of Technology, Cambridge, MA, USA; Harvard-MIT Program in Health Sciences and Technology, Cambridge, MA, USA.
7New York Blood Center, New York, NY, USA.
8The First Affiliated Hospital, Zhengzhou University, Zhengzhou, Henan, China
9The Laboratory of Virology and Infectious Disease, The Rockefeller University, New York, NY, USA.
10School of Life Science, Zhengzhou University, Zhengzhou, Henan, China
11Department of Pediatric Newborn Medicine, Brigham and Women’s Hospital and Division of Newborn Medicine, Boston Children's Hospital, Harvard Medical School, Boston, MA, USA. 12Department of Biology, Massachusetts Institute of Technology, Cambridge, MA, USA. 13Department of Systems Biology, Harvard Medical School, Boston, MA, USA.
Users may view, print, copy, and download text and data-mine the content in such documents, for the purposes of academic research, subject always to the full Conditions of use:http://www.nature.com/authors/editorial_policies/license.html#terms
* abasak@broadinstitute.org, sankaran@broadinstitute.org.
Author Contributions
A.B. and V.G.S. conceived and designed the study. A.B., M.M., and K.E.M. performed experiments and analyzed data. C.A.L. and J.C.U performed analyses. C.R.H., M.S., J.L., Y.W., Y.H., X.W., L.G., C.M.R., X.A., H.A.C., N.M., S.A.C., J.-J.C., S.H.O., and E.S.L. provided experimental assistance, reagents, and advice. V.G.S. supervised all experimental and analytic aspects of this work. N.M. and
HHS Public Access
Author manuscript
Nat Genet
. Author manuscript; available in PMC 2020 July 20. Published in final edited form as:Nat Genet. 2020 February ; 52(2): 138–145. doi:10.1038/s41588-019-0568-7.
A
uthor Man
uscr
ipt
A
uthor Man
uscr
ipt
A
uthor Man
uscr
ipt
A
uthor Man
uscr
ipt
14These authors contributed equally to this work
Abstract
Increased production of fetal hemoglobin (HbF) can ameliorate the severity of sickle cell disease and β-thalassemia1. BCL11A represses the genes encoding HbF and regulates human hemoglobin switching through variation in its expression during development2–7. However, the mechanisms underlying the developmental expression of BCL11A remain mysterious. Here we show that BCL11A is regulated at the level of mRNA translation during human hematopoietic development. Despite decreased BCL11A protein synthesis earlier in development, BCL11A mRNA continues to be associated with ribosomes. Through unbiased genomic and proteomic analyses, we demonstrate that the RNA-binding protein LIN28B, which is developmentally expressed in a reciprocal pattern to BCL11A, directly interacts with ribosomes and BCL11A mRNA.
Furthermore, we show that BCL11A mRNA translation is suppressed by LIN28B through direct interactions, independent of its role in regulating let-7 microRNAs, and BCL11A is the major target of LIN28B-mediated HbF induction. Our results reveal a previously unappreciated mechanism underlying human hemoglobin switching that illuminates new therapeutic opportunities.
The developmental switch from fetal to adult hemoglobin in humans has been extensively studied and is of substantial interest for developing approaches to induce fetal hemoglobin (HbF) to treat sickle cell disease and β-thalassemia1,8. Through functional and genetic follow up of genome-wide association studies for HbF levels9,10, BCL11A has been identified as a key regulator of both developmental hemoglobin switching and silencing of HbF in the adult1–7. BCL11A protein levels are developmentally regulated in humans such that, at the earlier developmental stages when HbF is highly expressed in erythroid cells, there is little or no BCL11A protein2,3. In contrast, BCL11A protein is robustly expressed in adult erythroid cells that have low levels of HbF expression. Despite extensive studies, the basis of this developmental regulation of BCL11A protein expression and thereby the upstream regulators of human hemoglobin switching remain undefined.
Consistent with earlier studies2,3, we found that BCL11A protein showed a gradient in expression across fetal, newborn, and adult erythroid cells at all stages of maturation (Fig. 1a and Extended Data Fig. 1a,b,d,h,i). Surprisingly, there was no substantial change in
BCL11A mRNA expression between fetal, newborn, or adult erythroid cells (Fig. 1b and Extended Data Fig. 1c,e–g), suggesting a post-transcriptional mechanism underlying the observed variation in protein expression. This difference in protein levels between the developmental stages could not be attributed to variation in the maturation state of cells or to differences in BCL11A mRNA splicing (Extended Data Fig. 2).
One possible post-transcriptional mechanism underlying the observed variation in protein expression could involve BCL11A protein being more readily degraded at the earlier developmental stages, as compared with adult erythroid cells. Since newborn erythroid cells had some, albeit lower, expression of BCL11A protein, we could directly compare the rates of protein degradation by arresting protein synthesis with cycloheximide11. No difference was observed in BCL11A protein degradation between newborn or adult erythroid cells (Fig.
A
uthor Man
uscr
ipt
A
uthor Man
uscr
ipt
A
uthor Man
uscr
ipt
A
uthor Man
uscr
ipt
1c,d). Thus, alteration in protein synthesis appeared to be a more likely mechanism to account for the variation in BCL11A protein levels. To directly measure protein synthesis rates, we metabolically labeled newly synthesized proteins with the methionine analog L-azidohomoalanine (L-AHA)12,13. Newborn and adult erythroid cells showed similar global AHA incorporation (Fig. 1e). By immunoprecipitation, we also noted similar levels of L-AHA labeled GATA1 protein, a key erythroid transcription factor14,15. In contrast, we observed a two-fold reduction in newly synthesized BCL11A levels in newborn vs. adult erythroid cells (Fig. 1f). Importantly, our immunoprecipitation procedure was effective at capturing nearly all detectable BCL11A and GATA1 protein from cell lysates (Extended Data Fig. 3a,b).
We reasoned that assessing translation by examining the distribution of BCL11A mRNA across polysomes might allow us to identify mechanisms for the observed variation in protein synthesis rates12,16. Surprisingly, we noted that BCL11A mRNA occupied actively translating ribosomes in polysome fractions with overlapping distributions in the newborn and adult erythroid cells (Fig. 1g,h and Extended Data Fig. 3c). This finding demonstrates that, while BCL11A has a lower rate of overall protein synthesis in newborn erythroid cells, its mRNA was bound by multiple ribosomes. To more clearly define whether there may be altered ribosome occupancy at specific regions of BCL11A mRNA, we conducted ribosome profiling15,17. Consistent with our findings from polysome profiling, we found that the overall translational efficiency (TE) – a metric of the number of ribosomes bound across the entire mRNA normalized to total mRNA levels – was comparable in stage-matched newborn and adult proerythroblasts (Fig. 1i). However, specific regions of the BCL11A transcript showed reduced ribosome occupancy (Fig. 1j, white arrows), while other regions showed more consistency (Fig. 1j). This variation in the pattern of ribosome occupancy may suggest ineffective ribosome elongation as a cause of reduced protein synthesis in newborn erythroid cells17,18. Reduced translational elongation can be mediated through interactions of an mRNA with RNA-binding proteins, as is seen with the fragile X mental retardation protein, FMRP16,18,19. In an analogous manner, we reasoned that an RNA binding protein expressed in erythroid cells at the earlier developmental stages might bind to the BCL11A mRNA and prevent its effective translation. In the case of FMRP, altered translation elongation is mediated through direct interactions with the ribosome20. We therefore sought to identify ribosome-associated RNA-binding proteins in human erythroid cells that displayed appropriate developmental expression.
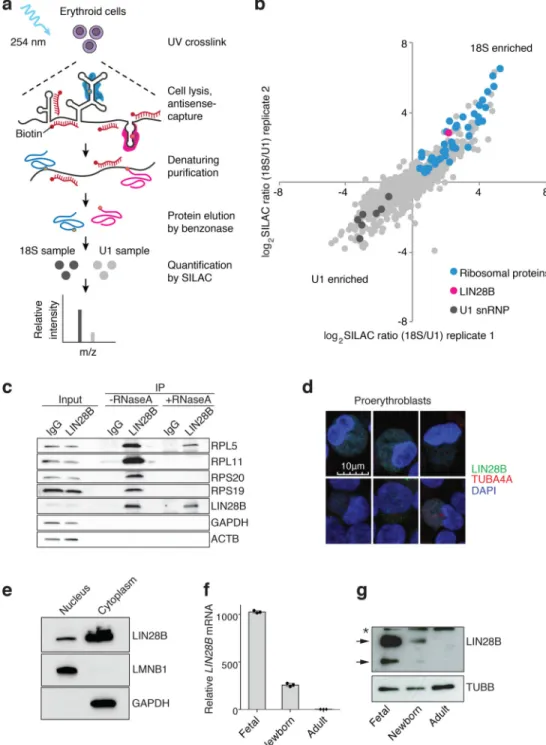
We conducted an unbiased survey of ribosome-interacting proteins in human erythroid cells through the use of the RNA antisense purification (RAP) method targeting the 18S
ribosomal RNA (rRNA) coupled to quantitative mass spectrometry using stable isotope labeling by amino acids in cells (SILAC) (Fig. 2a and Supplementary Table 1)21–23. Interestingly, among the most enriched proteins in the 18S RAP experiment was the RNA binding protein LIN28B, which showed similar enrichment as ribosomal proteins known to interact with the 18S rRNA (Fig. 2b,c and Supplementary Tables 1 and 2). This finding was validated through LIN28B co-immunoprecipitation (Fig. 2c). In cord blood-derived erythroid cells, a substantial fraction of LIN28B was localized to the cytoplasm and associated with translating ribosomes (Fig. 2d,e and Extended Data Fig. 4). Treatment of cell lysates with RNase A prior to polysome fractionation revealed some continued, albeit
A
uthor Man
uscr
ipt
A
uthor Man
uscr
ipt
A
uthor Man
uscr
ipt
A
uthor Man
uscr
ipt
reduced, interactions of LIN28B with ribosomes, suggesting potential direct interactions beyond those that are RNA-dependent (Extended Data Fig. 5).
Importantly, LIN28B showed a gradient of expression across fetal liver, newborn, and adult erythroid cells for both its mRNA and protein levels (Fig. 2f,g, Extended Data Fig. 6a,b, and Supplementary Table 2). LIN28B is an attractive upstream candidate regulator of BCL11A due to its documented role in binding numerous mRNAs and modulating their translation24. Despite these studies, LIN28B has not been previously appreciated as a ribosome-associated protein. Motivated by the observed differences in LIN28B expression between fetal and adult hematopoietic cells, a recent study suggested that LIN28B may promote the
reprogramming of hematopoietic progenitors into a fetal-like state and may thereby elevate HbF levels, but no specific mechanisms for these activities were identified25. In addition, LIN28B has been shown to be a key regulator at the early stages of developmental hematopoiesis26–29.
We therefore tested whether the repression of BCL11A mRNA translation may be mediated by LIN28B. Initial experiments suggested that lentiviral-mediated LIN28B expression resulted in extremely high levels of LIN28B, far exceeding what was seen physiologically, which was also the case in a previous study and which may have confounded this prior analysis25. To obtain physiologically relevant LIN28B levels, we devised a strategy to sort cells based on expression of a GFP marker linked to the LIN28B cDNA transcript through an internal ribosomal entry site. By separating cells into GFP high and low expressing fractions, we were able to obtain differentiating hematopoietic progenitor cells that expressed LIN28B at levels comparable to what was observed in normal physiology at the earlier stages of human erythroid development (Fig. 3a,b). While unregulated high-level LIN28B overexpression showed a reduction in BCL11A mRNA and a concomitant upregulation of γ-globin (encoded by HBG1/2; Extended Data Fig. 7a–c), expression of LIN28B at physiologically relevant levels in adult erythroid cells resulted in a ~2-fold reduction in BCL11A protein levels without an appreciable change in its mRNA levels (Fig. 3b–d). Importantly, physiologically relevant expression of LIN28B was sufficient to robustly induce γ-globin (Fig. 3e) to a similar extent as higher-level expression and without
perturbation of erythroid differentiation (Extended Data Fig. 3h).
While these results show that LIN28B can suppress BCL11A protein synthesis, the underlying mechanisms were unclear, particularly given the pleiotropic functions of LIN28B. LIN28B can both negatively regulate the production of let-7 microRNAs and directly bind mRNAs with either a positive or negative impact on their translation (Fig. 3f)24,30–32. Most studies on the role of LIN28B in hematopoiesis have focused on its role in let-7 microRNA biogenesis26–29. Our observation of a LIN28B-ribosome interaction in erythroid cells suggests that let-7 independent roles might be important in this context. To decipher the mechanisms of LIN28B-mediated BCL11A regulation, we initially explored whether the well-characterized let-7 microRNA pathway downstream of LIN28B may have a role in regulating human BCL11A expression and hemoglobin switching. Given that all let-7 family microRNAs harbor the same seed targeting sequence (Fig. 3g), we introduced mimics of the let-7 microRNA, let7g, into cord blood-derived erythroid cells (where let-7 is absent or lowly expressed, while LIN28B is robustly expressed) and observed appropriate
A
uthor Man
uscr
ipt
A
uthor Man
uscr
ipt
A
uthor Man
uscr
ipt
A
uthor Man
uscr
ipt
suppression of a known let-7 mRNA target, HMGA2 (Fig. 3h)27. However, there was no change in BCL11A protein or γ-globin mRNA levels despite increased let-7 activity (Fig. 3i,j). To bolster these findings, we introduced LIN28B into adult hematopoietic progenitors and differentiated the cells toward the erythroid lineage. Concomitant introduction of let-7 mimics successfully suppressed the LIN28B-mediated upregulation of HMGA2 mRNA, but failed to suppress the LIN28B-mediated induction of γ-globin (Fig. 3k,l). Together, these experiments show that the LIN28B-mediated suppression of BCL11A protein expression and concomitant HbF induction are independent of let-7 microRNA activity.
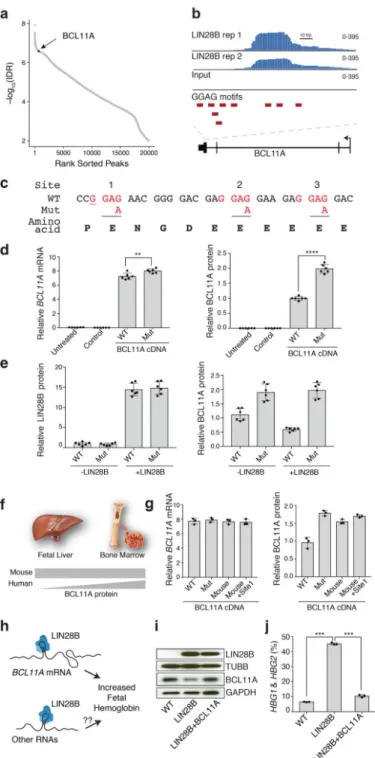
An alternative possibility is that LIN28B directly influences BCL11A mRNA translation through direct interactions, as previously described for other mRNA targets24,32,33. We therefore immunoprecipitated LIN28B from primary newborn erythroid cells after formaldehyde cross-linking and fractionation of the cells. We observed an enrichment of BCL11A mRNA relative to input, which was also seen for HMGA1, a known direct binding target of LIN28B24,33, but not for several non-target mRNAs (Extended Data Fig. 8). However, formaldehyde crosslinking cannot discriminate direct interactions from indirect RNA-protein binding events. To overcome this limitation, we applied ultraviolet cross-linking and immunoprecipitation (CLIP) together with massively parallel sequencing to map endogenous LIN28B binding sites in newborn erythroid cells34,35. We generated size-matched input libraries to calculate the enrichment of each peak over background. Using this approach, we identified 20,001 distinct binding sites of LIN28B that covered a total of 5,640 mRNAs in these cells at a 1% irreproducible discovery rate (IDR; Fig. 4a and Extended Data Fig. 9). LIN28B-bound mRNAs showed a range of translational changes when comparing ribosome profiles from newborn and adult erythroid cells (Extended Data Fig. 9f), consistent with prior studies that demonstrate disparate modes of regulation among LIN28 bound mRNAs24,36. Notably, we identified a 139-bp LIN28B-binding site in the 3’ coding region of the BCL11A mRNA (Fig. 4b). This peak in BCL11A mRNA was among the top 1% of all of the observed binding peaks in the newborn erythroid cells (Fig. 4a and Extended Data Fig. 7). This region contained three instances of a previously reported LIN28B binding motif (GGAG)24,32,37 and overlapped with the coding sequence that is unique to the XL isoform of BCL11A, which is critical for HbF silencing (Fig. 4c)5.
To assess the functional importance of the LIN28B binding site on BCL11A, we disrupted all three GGAG motifs in the LIN28B binding site of BCL11A cDNA by synonymous base changes (G>A), which resulted in an increase in BCL11A protein synthesis in the presence of LIN28B expression (Fig. 4d). Importantly, further elevating LIN28B expression further suppressed protein production from the wild-type but not the triple GGAG motif-mutated form of BCL11A (Fig. 4e). We have previously shown that the difference between mouse and human hemoglobin switching is mediated through alterations in BCL11A protein expression in definitive erythroid cells (Fig. 4f)3. Crucially, the first GGAG motif (termed site 1 here) displays a synonymous change in the orthologous position in mouse and human BCL11A mRNA (Fig. 4c, underlined). Strikingly, mutation of this single position from G>A was sufficient to enable increased protein production of BCL11A in the presence of LIN28B (Fig. 4g), suggesting that this distinct region of BCL11A mRNA underlies the
developmental differences between mice and humans in BCL11A protein expression and hemoglobin switching.
A
uthor Man
uscr
ipt
A
uthor Man
uscr
ipt
A
uthor Man
uscr
ipt
A
uthor Man
uscr
ipt
While these results emphasize a major role for LIN28B in the regulation of BCL11A translation and human hemoglobin switching, we sought to assess the degree to which the suppression of BCL11A mRNA translation results in the observed HbF induction by LIN28B (Fig. 4h). When we simultaneously expressed LIN28B and BCL11A in primary adult hematopoietic progenitors undergoing erythroid differentiation, γ-globin levels were reduced to nearly the extent that is seen at baseline conditions in these adult erythroid cells (Fig. 4i,j and Extended Data Fig. 10). In addition, we examined the levels of various let-7 microRNAs and observed no significant change after increasing the expression of BCL11A in the setting of LIN28B transduction, reinforcing the independence of the observed translational regulation from the well-characterized functions of LIN28B in regulating let-7 family microRNA biogenesis (Supplementary Fig. 1).
Together, our results show that LIN28B is expressed in a developmental stage-specific manner during the ontogeny of human erythropoiesis, such that at earlier developmental stages LIN28B is able to directly bind BCL11A mRNA and prevent its effective translation. The absence of LIN28B expression in adult erythroid cells allows effective BCL11A protein synthesis and γ-globin expression is thereby suppressed. The observed graded translational inhibition of BCL11A mRNA by LIN28B thus promotes the gradual shift from fetal to adult hemoglobin expression during development1–3. Our findings provide important new insights into the upstream regulators of hemoglobin switching and suggest a simplified model for the regulation of this process. In addition, we show that alterations of the LIN28B regulatory axis by modulating an individual evolutionarily divergent interaction site are sufficient to confer species-divergent BCL11A protein expression and hemoglobin switching3. Moreover, our study illuminates a key role for translational regulation of BCL11A in human
development, beyond previously well-studied roles that depend upon the let-7
microRNAs26–29. This finding is one of the first examples of a physiologic function of LIN28B that does not depend upon its regulation of let-7 microRNAs and that acts through alteration of translation of a distinct mRNA by direct interactions. It is likely that further studies may reveal additional targets that are regulated in a similar manner and that may impact other development processes. This newly uncovered translational regulatory
mechanism or upstream regulators of LIN28B may represent unique targetable opportunities to induce HbF for the treatment of sickle cell disease and β-thalassemia.
METHODS
Isolation of CD34+ hematopoietic stem and progenitor cells (HSPCs)
CD34+ HSPCs from various stages of human development were isolated by positive magnetic selection using the EasySep Human CD34 Positive Selection Kit II (Stem Cell Technologies) after mononuclear cell isolation on a Ficoll-Paque density gradient (Stem Cell Technologies). Purity of isolated cells was assessed by flow cytometry with a PE conjugated anti-human CD34 antibody (Supplementary Table 3). Freshly isolated CD34+ HSPCs were either immediately cultured or cryopreserved for later use.
A
uthor Man
uscr
ipt
A
uthor Man
uscr
ipt
A
uthor Man
uscr
ipt
A
uthor Man
uscr
ipt
In vitro erythroid differentiation from primary hematopoietic cells
CD34+ HSPCs were cultured in a three-stage erythroid differentiation culture system that we have previously described38. Briefly, the cells were cultured in Iscove’s Modified
Dulbecco’s Medium (IMDM, Life Technologies) containing 2% human AB plasma, 3% human AB serum, 1% penicillin/streptomycin, 200 μg/mL human holo-transferrin, 3 U/mL heparin, and 10 μg/mL insulin (base medium). In Phase I (day 0–7), the cultures were supplemented with erythropoietin (EPO) (3 U/mL), stem cell factor (SCF) (10 ng/mL), and interleukin 3 (IL-3) (1 ng/mL), and in Phase II (day 7–12), they were supplemented with EPO and SCF alone. In Phase III (day 12 onwards), primary cell cultures contained 1mg/mL human holo-transferrin and were supplemented with EPO. Cell counts were measured either using a Beckman Coulter automated cell counter or manually with a hemocytometer. Cells were maintained between 105-106 cells per mL in Phases I and II, and at 106 cells per mL in Phase III. Cells were split into fresh culture medium every 3 days.
Flow cytometry
Cells were washed in phosphate-buffered saline (PBS) and stained with anti-human CD71 and CD235a antibodies (Supplementary Table 3). Propidium iodide (PI) or 4
′,6-diamidino-2- phenylindole (DAPI) were used for live/dead cell discrimination. Flow cytometric analyses were conducted on Becton Dickinson LSRII, LSR Fortessa, or Accuri C6 instruments and all data was analyzed using FlowJo software (version 10.3).
RNA-sequencing
CD34+ HSPCs from adult and newborn were differentiated until day 7 (primarily
proerythroblasts and basophilic erythroblasts) and RNA was isolated. cDNA libraries were generated from 2 μg of RNA with TruSeq RNA Sample Prep Kit v2 (Illumina). Sequencing of 101 nucleotide paired-ends reads were carried out on an Illumina HiSeq 2000 sequencing system. Adapters were removed with trimmomatic using the following options: “PE -phred33 ILLUMINACLIP:TruSeq2-PE-2.fa:2:30:10 HEADCROP:5 LEADING:10 TRAILING:10 SLIDINGWINDOW:4:20 MINLEN:36”. Transcript abundance per million reads for each sample were estimated using kallisto v0.4.4 using default parameters (k-mer size = 31 for the hg19 reference genome)39. Per-gene abundances were then estimated with Sleuth40. Sashimi plots were generated using the R package Gviz41 using trimmed reads that were aligned to the hg19 reference genome using Tophat2.1.042,43.
RNA isolation and quantitative RT-PCR
RNA was isolated with the RNeasy Mini Kit (Qiagen) with an on-column DNAse (Qiagen) digestion, according to manufacturer’s instructions. cDNA was synthesized with the iScript cDNA synthesis kit (BioRad) in a total volume of 20 μL according to manufacturer’s instructions. Quantitative reverse transcriptase polymerase chain reaction (qRT-PCR) was carried out using a 96-well plate on a CFX96 Real Time System (BioRad) with iQ SYBR Green Supermix (BioRad)4. Gene specific primers used for qRT-PCR are listed in Supplementary Table 4.
A
uthor Man
uscr
ipt
A
uthor Man
uscr
ipt
A
uthor Man
uscr
ipt
A
uthor Man
uscr
ipt
Analysis of microRNA (miRNA) levels
miRNAs were detected by TaqMan Small RNA Assays (Applied Biosystems). Total RNA was isolated using the miRNeasy Mini Kit (Qiagen) with an on-column DNAse (Qiagen) digestion. cDNA was synthesized in a total volume of 15 μL with the TaqMan MicroRNA Reverse Transcription Kit (Applied Biosystems). miRNA levels were quantified with appropriate TaqMan primer sets using the TaqMan Universal PCR Master Mix II (Applied Biosystems) on a CFX96 Real Time System (BioRad).
Western blot analysis
Cells were lysed in RIPA buffer (sc-24948, Santa Cruz Biotechnology) and protein levels were quantified with the DC Protein Assay (BioRad). Western blots were performed with BCL11A (14B5; ab19487, AbCam, at a 1:100 dilution), LIN28B (4196, Cell Signaling, at a 1:1,000 dilution), β-actin (AC15; Sigma, at a 1:2,500 dilution), β-tubulin (ab6046, AbCam at a 1:500 dilution), and GAPDH (6C5; sc-32233, Santa Cruz, at a 1:1,000 dilution) antibodies. The secondary antibodies used were goat anti-rabbit (170–5046, Biorad), goat anti-mouse (170–5047, Biorad), and donkey anti-goat (705–035-147, Jackson Immuno Research).
Cycloheximide chase experiments
Adult and newborn HSPCs underwent erythroid differentiation for 7 days and were then treated with cycloheximide (Sigma Aldrich) at 25 μg/ml to inhibit protein synthesis, and harvested at indicated time points following treatment. BCL11A protein was analyzed by western blotting as described above and the intensities of BCL11A protein bands were quantified using ImageJ. GAPDH was used as a control.
In vitro protein labeling and detection
Metabolic labeling of proteins was carried out using Click-iT chemistry12. CD34+ HSPCs derived from adults and newborns were cultured in parallel until day 7 of erythroid differentiation washed with warm PBS, and incubated in methionine-free RPMI medium (Sigma Aldrich) with 10% FBS and 2 mM L-glutamine for 1 hour at 37 °C to deplete both cell types of methionine reserves. Methionine-starved cells were then labeled with Click-iT L-azidohomoalanine (L-AHA, Life Technologies) at a concentration of 50 μM for 6 hours at 37 °C. Harvested cells were washed twice in PBS warmed to 37 °C, and protein extraction was carried out in RIPA lysis buffer supplemented with PMSF, sodium orthovanadate, and protease inhibitor cocktail solution (Santa Cruz Biotechnology). 50 μg of protein lysate was used for the Click reaction with tetramethylrhodamine alkyne (TAMRA, Life Technologies) in a total volume of 200 μl using the Click-iT Protein Reaction Buffer Kit (Thermo Fisher Scientific). TAMRA signal was detected on total proteins separated by SDS-gel
electrophoresis with an AI600 imager (Amersham Biosciences).
Immunoprecipitation coupled to Click-iT labeling
Protein lysate obtained as described above (500 μg for BCL11A and 300 μg for GATA1) was used for immunoprecipitation with a mouse monoclonal antibody against BCL11A (14B5; ab19487, AbCam) and a goat polyclonal antibody against GATA1 (M-20; sc-1234, Santa
A
uthor Man
uscr
ipt
A
uthor Man
uscr
ipt
A
uthor Man
uscr
ipt
A
uthor Man
uscr
ipt
Cruz Biotechnology) bound to Dynabeads Protein G (10003D, Life Technologies) for 3 hours at 4 °C with end-to-end rotation. The Dynabeads-antibody-antigen complex was washed three times with RIPA buffer, resuspended in 60 μl RIPA buffer, and detected using the Click-iT Protein Reaction Buffer Kit (C10276, Invitrogen). The immunoprecipitate resin was washed once in RIPA buffer and bound proteins were eluted in 40 μl Laemmli sample buffer (161–0747, BioRad) and heated at 70 °C for 10 minutes. Proteins were separated by SDS-gel electrophoresis, followed by TAMRA detection as described above or western blot analysis using antibodies against BCL11A and GATA1. The immunoprecipitate (IP) fractions and the flow-throughs (FT) were probed under identical experimental conditions (simultaneous SDS-gel electrophoresis, same primary and secondary antibody dilutions used).
Polysome profiling
Polysome gradient formation and fractionation were performed as described previously12. Briefly, CD34+ HSPCs from adult and newborn were differentiated until day 7 for examining polysome profiles. Cells were incubated with 100 μg/ml of cycloheximide (Sigma Aldrich) for 10 minutes at 37 °C, washed twice with ice-cold PBS containing 100 μg/ml of cycloheximide, and lysed in polysome extraction buffer (10 mM Tris-HCl, pH 7.4, 1% Triton X-100, 5 mM MgCl2, 100 mM KCl, 2 mM DTT, 100 μg/ml cycloheximide, 500 U/ml RNasin Plus (Promega) and complete EDTA-free Protease Inhibitor (Roche)) by shearing the lysate gently through a 26-gauge needle. The lysate was obtained after centrifugation for 10 minutes at 1,300g, 4 °C. Polysomes were layered on a 10–50% linear sucrose gradient containing 20 mM HEPES-KOH (pH 7.4), 5 mM MgCl2, 100 mM KCl, 2 mM DTT, 100 μg/ml cycloheximide and SUPERase In RNase Inhibitor (Ambion) and centrifuged at 36,000 rpm for 2 hours in a SW41 rotor using an XE-90 ultracentrifuge (Beckman Coulter). Gradients were fractionated in a Biocomp Gradient Station fractionator with absorbance at 254 nm used to visualize the gradients.
RNA was extracted on the collected fragments with TRIzol LS reagent (Ambion). BCL11A, GATA1, and ACTB primers were used for the calculation of mRNA abundance in
monosome and polysome gradient fractions, as previously described44, and represented as a percentage of the entire sucrose gradient. This representation was used for accuracy, since individual fractions did not always have consistent volumes. When showing the overall pattern of the sucrose gradient fractions, the x-axis is the total size (in mm) of the sucrose fraction. Given the inability to collect identical fraction sizes for different samples, mRNA levels have been quantified such as to normalize the x-axis as a percentage of the total sucrose gradient.
For RNase treatment, erythroid cells were grown to ~75% confluence. Cells were incubated with 100 μg/ml of cycloheximide (Sigma Aldrich) for 10 minutes at 37 °C, washed twice with ice-cold PBS containing 100 μg/ml of cycloheximide, and lysed in polysome extraction buffer (20 mM Tris-HCl, pH 8.0, 1% Triton X-100, 15 mM MgCl2, 150 mM NaCl, 1 mM DTT, complete EDTA-free Protease Inhibitor (Roche) and 2U Turbo DNase (Thermo Fisher)). The lysate obtained after centrifugation for 10 minutes at 15000 rpm, 4°C was analyzed for total RNA. 100 μg total RNA was digested with RNase A (Thermo Fisher) at
A
uthor Man
uscr
ipt
A
uthor Man
uscr
ipt
A
uthor Man
uscr
ipt
A
uthor Man
uscr
ipt
0.01 mg/mL for 15 min at 25 °C on a thermomixer shaking at 500 rpm. 10 μL Superase In RNase inhibitor (Ambion) was used to stop digestion. Lysates were layered on to a sucrose gradient and fractionated as described above.
Protein extraction from sucrose gradient fractions was carried out as previously described45. Briefly, 0.15% deoxycholate (DOC, Sigma) was added to the sample and incubated at room temperature for 10 minutes. 100% trichloroacetic acid (TCA, Sigma) was then used to precipitate the protein on ice for 30 minutes. After centrifugation at 10,000g for 15 minutes at 4 °C, the pellet thus obtained was washed with ice-cold acetone 5 times to remove traces of TCA. The pellet was subsequently air-dried, dissolved in 2x Laemmli sample buffer (BioRad), and analyzed by western blotting.
Ribosome profiling and analysis
CD34+ HSPCs from adult and newborn were differentiated until day 7 (proerythroblast stage) for examining ribosome profiles. Cells were incubated with 100 μg/ml of
cycloheximide (Sigma Aldrich) for 5 minutes at 37 °C, washed twice with ice-cold PBS containing 100 μg/ml of cycloheximide, and lysed in 10 mM Tris-HCl (pH 7.4), 5 mM MgCl2, 100 mM KCl, 1% Triton X-100, 3 mM DTT, 100 μg/ml cycloheximide, 500 U/ml RNasin (Promega) and 1x Complete Protease Inhibitor, EDTA-free (Roche). Lysates for ribosome profiling were prepared and ribosome protected RNA fragments (RPFs) were isolated as described previously15 with the following modifications: rRNA was depleted using the RiboMinus Eukaryote Kit v2 (Thermo Fisher Scientific) by following the manufacturer’s instructions. rRNA depleted RPFs were purified with the Zymo RNA Clean & Concentrator-5 kit by following the manufacturer’s instructions for small RNAs. PAGE purification of RPFs was performed as described previously15 and resulting RPFs were dephosphorylated in FastAP mix (19.5 μl H2O, 2.5 μl 10x FastAP buffer (Thermo Fisher Scientific), 2.5 U FastAP enzyme (1 U/μl; Thermo Fisher Scientific), 0.5 μl Murine RNase Inhibitor (New England Biolabs)) and incubating for 20 minutes at 37 °C. In the meantime, polynucleotide kinase mix was prepared (57 μl H2O, 10 μl 10x PNK buffer (New England Biolabs), 0.5 μl Murine RNase Inhibitor, 6.5 μl T4 PNK (10 U/μl; New England Biolabs), 1 μl TURBO DNase) and added 75 μl to each 25-μl sample and incubated 20 minutes at 37 °C. RPFs were purified with the Zymo RNA Clean & Concentrator-5 kit following the
manufacturer’s instructions for small RNAs. RNA was eluted in 7 μl H2O, 1.5 μl DMSO and 10 pM 3’ adapter (/Phos/AGATCGGAAGAGCACACGTCTG/ddC) were added before denaturation at 65 °C for 2 minutes and transferring samples to ice. Subsequently, 11 μl ligation mix was added (2 μl 10x T4 RNA ligation buffer (New England Biolabs), 0.3 μl DMSO, 0.2 μl ATP, 0.3 μl RNAse inhibitor, 7 μl 50% PEG 8000, 1.2 μl T4 RNA Ligase 1 High Concentration (New England Biolabs)) using low retention pipette tips and incubated 1 hour at 23 °C with agitation. Ligation reactions were purified to remove free 3’ adapter using Silane bead purifications. For each reaction, 15 μl Silane beads (Thermo Fisher Scientific) were washed twice in 1 ml RLT buffer (Qiagen), beads were resuspended in 60 μl RLT, and 60 μl beads in RLT was combined with 20 μl ligation reaction. 0.7 volumes 100% ethanol were added and incubated for 10 minutes at room temperature. Supernatant was removed and beads were washed twice with 70 % ethanol before eluting air-dried beads in 10 μl H2O. Next, 10 pM reverse transcription primer (/5’biotin/GACGTGTGCTCTTCCGA)
A
uthor Man
uscr
ipt
A
uthor Man
uscr
ipt
A
uthor Man
uscr
ipt
A
uthor Man
uscr
ipt
was added and samples were denatured at 72 °C for 3 minutes before transferring to ice. To each reaction 7 μl reverse transcription mix (0.25 μl H2O, 2 μl 5x Smartscribe first strand buffer (Takara), 0.25 μl RNase inhibitor, 2 μl Smartscribe RT (Takara), 2 μl dNTP, 0.5 μl 20 mM DTT) were added and samples were incubated at 42 °C for 15 minutes. Next, 2 μl template-switching oligo (5’biotin/TACACGACGCTCTTCCGATCTrGrG+G) were added and samples were incubated 90 minutes at 42 °C, followed by 10 minutes at 70 °C. Samples were purified with Silane beads and subjected to PCR amplification using 2x NEBNext Q5 Hot Start HiFi PCR Master Mix (New England Biolabs) as described previously46. Amplicons migrating at a size of ~157 bp were subjected to two consecutive rounds of gel purification. For preparation of mRNA sequencing libraries, total RNA was extracted with the Direct-zol RNA MiniPrep Plus Kit (Zymo Research) according to the manufacturer’s instructions. Total RNA was poly-A selected using the NEBNext Poly(A) mRNA Magnetic Isolation Module (New England Biolabs) according to the manufacturer’s instructions. mRNA was eluted in 27 μl H2O, 3 μl 10x FastAP buffer were added and RNA was heat fragmented for 3 minutes at 91 °C. Fragmented RNA was end-repaired, adapter ligated, reverse transcribed and PCR amplified as described in the above section. All libraries were sequenced on a HiSeq 2500 system (Illumina).
Raw reads were trimmed using cutadapt with parameters -u 3 untrimmed -a
AGATCGGAAGAGCACACGTCTG -q 5 -m 20. We then aligned trimmed reads with STAR (v2.6.0c)47. Per gene abundances of ribosome occupancy were determined using the
geneCounts feature in STAR. Triplet periodicity verified the libraries to be of high quality and were determinged using RibORF. To determine differentially translated genes, we used RiboRex48. Raw read pileups for BCL11A were visualized in IGV after merging
replicates49.
RNA immunoprecipitation
RNA immunoprecipitation (RIP) was carried out in differentiating HSPCs derived from newborns on day 7 of erythroid differentiation. Dynabeads were washed in blocking solution (PBS+0.5% BSA), and incubated overnight at 4 °C with end-to-end rotation in LIN28B antibodies (4196, Cell Signaling and A303–588A, Bethyl Labs) and IgG (PP64, Millipore) as control. Cells were lysed in NP40 lysis buffer, supplemented with Protease inhibitors, RNasin, and 1 mM DTT and pre-cleared with beads for 1 hour at 4 °C. After saving 1/50 volume for input, the rest of the pre-cleared lysate was incubated with the dynabeads-antibody complex for overnight at 4 °C with rotation. The beads-dynabeads-antibody-antigen complex was washed three times with low-salt buffer (5X PBS, 0.1% SDS, 0.5% Na-DOC and 0.5% NP-40) and then twice with high-salt buffer (1X PBS, 0.1% SDS, 0.5% Na-DOC and 0.5% NP-40). All washing steps were carried out at 4 oC, and the supernatant saved as flow through (FT). Elution buffer (50 mM HEPES, 0.1 M NaCl, 5 mM EDTA, 10 mM DTT, 0.5% Triton X-100, 10% glycerol, 1% SDS), freshly supplemented with RNase inhibitor was used. RNA extraction was carried out with TRI-Reagent (R2050–1-50, Zymo
Research). RNA was quantified with Qubit, and qRT-PCR was subsequently carried out for LIN28B, HMGA2, GATA1, ALAS2, LDB1, KLF1 and LMO2 with primers listed in Supplementary Table 4.
A
uthor Man
uscr
ipt
A
uthor Man
uscr
ipt
A
uthor Man
uscr
ipt
A
uthor Man
uscr
ipt
Crosslinking immunoprecipitation (CLIP)
Crosslinking immunoprecipitation (CLIP) experiments were carried out using ultraviolet crosslinking and LIN28B antibody-mediated precipitation in primary human erythroid cells. Details of the CLIP methods can be found in the Supplementary Note.
RNA antisense purification and mass spectrometry (RAP MS)
RNA antisense purification of the 18S ribosome RNA was carried out in erythroid cells. Details of the RAP MS approaches used can be found in the Supplementary Note.
Immunoprecipitation
Co-immunoprecipitation (coIP) was carried out in the K562 cell line, which expresses LIN28B. Dynabeads were washed in PBS, supplemented with protease inhibitors (complete mini protease inhibitor cocktail, Roche) and incubated at 4 °C for 1 hour with LIN28B antibody (4196, Cell Signaling) and IgG (2729S, Cell Signaling) as control. Cells were lysed in RIPA (Millipore), supplemented with Protease inhibitors and 0.1 mM DTT. 5% was saved as input and the lysate was incubated with dynabeads-antibody at 4 °C for overnight. The beads-antibody-antigen complex was washed three times at 4 oC with RIPA, supplemented with 0.1 mM DTT and protease inhibitors. For RNase digestion, experimental conditions were adapted from published protocols50,51. Briefly, the dynabeads-antibody complex was washed three times at 4 oC with RIPA containing RNAseA (Ambion). Samples were rocked at 25 oC for 10 minutes in between washes. The final wash was done with RIPA containing Superase In RNase inhibitor (Invitrogen), and rocked for 10 minutes at 25 oC, before eluting in RIPA added with 4x Laemmli buffer (BioRad) and protease inhibitors. Samples were directly loaded on to SDS-PAGE, and probed for protein distribution through western blots, as described above.
Lentiviral infections
HSPCs undergoing erythroid differentiation were transduced with control, LIN28B, or BCL11A lentiviral constructs on day 2 of differentiation. 293T cells for lentivirus production were cultured in Dulbecco’s Modified Eagle Medium (DMEM, Life Technologies) with 10% FBS and 1% penicillin/streptomycin. Approximately 24 hours before transfection, the 293T cells were seeded, without antibiotics, in 6-well plates. Cells were co-transfected with the packaging vectors pVSVG, pΔ8.9, and the lentiviral genomic vector of interest. The media was changed to base media on the day following transfection, and the viral supernatant was collected approximately 48 hours post-transfection, filtered with a 0.45-μm filter and used for infection of CD34+ cells. Where the virus needed to be concentrated, the 293T cells were seeded in 10-cm dishes, the viral supernatant was filtered and centrifuged at 24,000 rpm for 2 hours at 4 °C. 200,000–300,000 CD34+ cells were infected in 6-well plates with 8 μg/mL polybrene (Millipore), and spun at 2,000 rpm for 1.5 hours at room temperature, and incubated in the viral supernatant overnight at 37 °C. Virus was washed off one day after infection, and infected cells were selected for by GFP or RFP expression driven by IRES-GFP or IRES-RFP in the HMD vector in the particular construct. GFP+, RFP+ and GFP+RFP+ cells were sorted by fluorescence-activated cell sorting (FACS) in a sterile manner and cultured for further analysis.
A
uthor Man
uscr
ipt
A
uthor Man
uscr
ipt
A
uthor Man
uscr
ipt
A
uthor Man
uscr
ipt
Transfections in 293T cells
293T cells were maintained in DMEM with 10% FBS and 1% penicillin/streptomycin. Lentiviral infections were carried out as described above. Transfection of constructs was carried out using 1 μg vector of interest with OPTI-MEM (Gibco) and Fugene 6 (Promega).
Introduction of mimics
miRIDIAN microRNA mimics for human let7g (C-300583–05-0005, Dharmacon) were used, along with positive (CP-001000–02-05, Dharmacon) and negative (CN-002000–01-05, Dharmacon) controls. The Amaxa human CD34+ Cell Nucleofector Kit (Lonza, VPA-1003) was used to electroporate 50 nmol of each mimic into CD34+ cells derived from newborns on day 5 of erythroid differentiation according to manufacturer’s instructions. After recovery, cells were harvested on day 7 of differentiation for western blot and qRT-PCR, as described above. siRNA mimics targeting GAPDH, human let7g, and a scrambled negative control are shown.
Immunocytochemistry analysis
Differentiating HSPCs derived from newborns on day 7 were crosslinked with 4% paraformaldehyde, and fixed with Triton X-100. LIN28B was detected with the AbCam antibody 191881 (1:1,000 dilution) and Alexa Fluor 488-conjugated goat anti-rabbit IgG secondary antibody (ab150077, AbCam, 1:1,000 dilution). Tubulin was detected with the anti-tubulin ab7291 (AbCam, 1:1,000 dilution) and Alexa Fluor 594 goat anti-mouse secondary antibody (ab150120, AbCam, 1:1,000 dilution). DAPI was used as the nuclear counterstain during the final mount (VectaShield with DAPI, Vector Laboratories, H-1200). Slides were observed under Olympus Flouview FV1000 confocal microscope.
Subcellular localization studies
Newborn derived HSPCs were cultured until day 7 of differentiation. Nuclear and
cytoplasmic fractionation was performed with the PARIS kit (AM1921, Ambion) according to manufacturer’s instructions. Western blots were performed with LIN28B, GAPDH (described above) and Lamin B1 (B10; sc-374015, Santa Cruz, at a 1:1,000 dilution) antibodies.
Statistical analysis
All statistical significances between control and test groups were calculated with two-tailed Student’s t-test. Biological replicates are mentioned wherever applicable. Error bars show s.d. *P < 0.05; **P < 0.01; ***P < 0.001; ****P < 0.0001; N.S. not significant throughout the text. All statistical analyses were carried out in GraphPad Prism 7.
Reporting Summary
Further information on research design is available in the Reporting Summary linked to this article.
A
uthor Man
uscr
ipt
A
uthor Man
uscr
ipt
A
uthor Man
uscr
ipt
A
uthor Man
uscr
ipt
Data Availability Statement
The massively parallel sequencing data associated with this manuscript are available at https://www.ncbi.nlm.nih.gov/geo/query/acc.cgi?acc=GSE118359.
The original mass spectra and the protein sequence database used for searches have been deposited in the public proteomics repository MassIVE (http://massive.ucsd.edu) and are accessible at ftp://massive.ucsd.edu/MSV000084443/.
Code Availability
Custom computer code for reproducing sequencing-based analyses is available at https:// github.com/sankaranlab/translation-regulation-bcl11a.
Extended Data
A
uthor Man
uscr
ipt
A
uthor Man
uscr
ipt
A
uthor Man
uscr
ipt
A
uthor Man
uscr
ipt
Extended Data Fig. 1:
BCL11A protein and mRNA expression in fetal, newborn and adult erythroid cells
a, Representative flow cytometry plots showing CD71 and CD235a surface expression in
newborn (left) and adult (right) at differentiation day 7. Mean ± s.d shown. (n = 3; 3 biologically independent experiments). b, Representative westerns showing BCL11A expression, with GAPDH as control, in newborn (left) and adult (right) at differentiation day 7 (5 independent experiments). c, BCL11A mRNA expression (normalized to GAPDH), in newborn and adult at differentiation day 7 (n = 3; 3 biologically independent experiments).
A
uthor Man
uscr
ipt
A
uthor Man
uscr
ipt
A
uthor Man
uscr
ipt
A
uthor Man
uscr
ipt
Mean ± s.d shown. Two-sided Student t-test used. N.S., not significant; P = 0.7153. d, Representative westerns showing BCL11A expression, with GAPDH used as control, at differentiation days 4, 7, & 10 (5 independent experiments). e, BCL11A mRNA expression (normalized to GAPDH) in newborn and adult (n = 3; 3 independent experiments) at differentiation days 4, 7, and 10. Mean ± s.d shown. Two-sided Student t-test used. N.S., not significant; P = 0.4395 (d4), P = 0.3051 (d7), P = 0.3672 (d10). f, XL isoform of BCL11A mRNA with 4 exons and qRT-PCR primers. FP, forward primer; RP, reverse primer. g, BCL11A mRNA expression (normalized to GAPDH), in newborn and adult (n = 3; 3 independent experiments) with 2 independent primer sets at differentiation day 7. Mean ± s.d shown. Two-sided Student t-test used. N.S., not significant, P = 0.2365 (pair 1), P = 0.4099 (pair 2). h, Stacked bar graphs showing fetal (HbF, red) and adult (HbA, grey) hemoglobin abundance (by HPLC) in newborn and adult on differentiation day 16. i, Representative westerns showing BCL11A expression with GAPDH as control at differentiation days 4, 7, 10, and 12 in fetal and adult (3 independent experiments). Blots have been cropped and the corresponding full blots are available in the Source Data files.
A
uthor Man
uscr
ipt
A
uthor Man
uscr
ipt
A
uthor Man
uscr
ipt
A
uthor Man
uscr
ipt
Extended Data Fig. 2:
Assessment of BCL11A and other mRNAs expressed in newborn and adult erythroid cells using RNA sequencing
a, Scatter plots of gene expression, determined from RNA-sequencing reads, expressed as
log2 TPM (transcripts per million reads) in adult and newborn primary erythroid cells. ‘r’ represents the Pearson correlation coefficient. b, Expression of BCL11A, represented as log2 TPM, between newborn (n = 2) and adult (n = 2) erythroid cells. Error bars show s.d. c, BCL11A mRNA structure and splicing is comparable between developmental stages.
A
uthor Man
uscr
ipt
A
uthor Man
uscr
ipt
A
uthor Man
uscr
ipt
A
uthor Man
uscr
ipt
Sashimi plots depicting exon-exon spanning reads are shown for annotated isoforms of BCL11A. d, Representation of known BCL11A isoforms. e, Relative abundances of BCL11A isoforms in newborn (n = 2) and adult (n = 2). Error bars show s.d. No transcript was differentially expressed at P < 0.01 between the newborn and adult cells.
A
uthor Man
uscr
ipt
A
uthor Man
uscr
ipt
A
uthor Man
uscr
ipt
A
uthor Man
uscr
ipt
Extended Data Fig. 3:
BCL11A protein expression is regulated via translation by polysome-associated LIN28B
a, Western blots for BCL11A in the input and flow-through (FT) fractions of the
immunoprecipitate in newborn (left) and adult (right) erythroid cells (2 independent experiments). b, Western blots for BCL11A and GATA1 in the total immunoprecipitate (IP) in newborn (left) and adult (right) erythroid cells after L-azidohomoalanine (L-AHA) labeling for 6 hours at day 7 of differentiation, followed by immunoprecipitation with BCL11A and GATA1 antibodies. c, Quantification of adult-BCL11A (blue) and newborn-BCL11A (purple) mRNAs across the different sucrose gradient fractions are shown as a percentage of the gradient. Cells were differentiated until day 7. Blots have been cropped and the corresponding full blots are available in the Source Data files.
A
uthor Man
uscr
ipt
A
uthor Man
uscr
ipt
A
uthor Man
uscr
ipt
A
uthor Man
uscr
ipt
Extended Data Fig. 4:
LIN28B association with polysomes and expression in newborn and adult cells
Representative LIN28B occupancy across polysome fractions in newborn erythroid cells at day 7 of differentiation. LIN28B abundance is probed by western blot, using RPL5 and RPS20 as controls. Please note two gaps in the western blot between sequential polysome fractions that were placed to avoid overloading of proteins (2 independent experiments). Blots have been cropped and the corresponding full blots are available in the Source Data files.
A
uthor Man
uscr
ipt
A
uthor Man
uscr
ipt
A
uthor Man
uscr
ipt
A
uthor Man
uscr
ipt
Extended Data Fig. 5:
LIN28B partially dissociates from polysomes after RNase A treatment
a, LIN28B occupancy across polysome fractions in erythroid cells either untreated (blue) or
treated with RNase A (red). Experiment repeated 3 times. b, LIN28B abundance probed by western blot, using RPL5 and RPS20 as controls in the untreated sucrose gradient fractions.
c, LIN28B abundance in polysome fractions with lysates digested with RNase A. Blots have
been cropped and the corresponding full blots are available in the Source Data files.
A
uthor Man
uscr
ipt
A
uthor Man
uscr
ipt
A
uthor Man
uscr
ipt
A
uthor Man
uscr
ipt
Extended Data Fig. 6:
LIN28B expression in newborn and adult cells
a, Volcano plot of differentially expressed genes between adult (n = 2) and newborn (n = 2) erythroid cells. Each dot is a gene with the value of the β coefficient (x-axis) from the sleuth linear model and the corresponding measure of statistical significance (y-axis). LIN28B is the most over-expressed gene in newborn cells compared to adult. Statistical test:
generalized linear model from sleuth. b, Expression of LIN28B, represented as log2 TPM, between newborn and adult erythroid cells. Error bars show s.d. ***P < 0.001. Statistical test: generalized linear model from sleuth.
A
uthor Man
uscr
ipt
A
uthor Man
uscr
ipt
A
uthor Man
uscr
ipt
A
uthor Man
uscr
ipt
Extended Data Fig. 7:
Effects of high-level LIN28B expression in adult erythroid cells
a, BCL11A mRNA levels (normalized to GAPDH expression), upon high-level LIN28B expression (GFP-high) in adult erythroid cells, assessed on differentiation day 7 (n = 3; 3 biologically independent experiments). Mean is plotted and error bars show s.d. Two-sided Student t-test used. **P < 0.01. b, Relative γ-globin expression as a percentage of total globins (γ- and β-globins), upon high-level LIN28B expression (GFP-high) in adult erythroid cells, on differentiation day 15 (n=3; 3 independent experiments). Error bars show s.d. ***P < 0.001. c, Representative flow cytometry plots showing CD71 and CD235a surface expression in control (left) and physiological level LIN28B expressing (right) adult erythroid cells at day 7 of differentiation. Data represents mean ± s.d., n = 3; 3 biologically independent experiments.
A
uthor Man
uscr
ipt
A
uthor Man
uscr
ipt
A
uthor Man
uscr
ipt
A
uthor Man
uscr
ipt
Extended Data Fig. 8:
LIN28B associates with BCL11A mRNA
a, RNA-immunoprecipitation (RNA-IP) in newborn erythroid cells at day 7 of
differentiation, with antibodies against LIN28B (4196, Cell Signaling) or control IgG. Detection of BCL11A, HMGA1, GATA1, ALAS2, LDB1, KLF1, and LMO2 mRNAs (n = 3; 3 independent experiments). Mean is plotted and error bars show s.d. Two-sided Student t-test used. **P < 0.01; N.S., not significant, P = 0.6395 (GATA1), P = 0.8782 (ALAS2), P = 0.8999 (LDB1), P = 0.9571 (KLF1), P = 0.9550 (LMO2). b, Detection of BCL11A,
A
uthor Man
uscr
ipt
A
uthor Man
uscr
ipt
A
uthor Man
uscr
ipt
A
uthor Man
uscr
ipt
HMGA1, GATA1, ALAS2, LDB1, KLF1, and LMO2 mRNAs (n = 3; 2 independent experiments) in the input for LIN28B antibody (4196, Cell Signaling). Mean is plotted and error bars show s.d. Two-sided Student t-test used. N.S., not significant, P = 0.3867 (BCL11A), P = 0.8050 (HMGA1), P = 0.6420 (GATA1), P = 0.8656 (ALAS2), P = 0.6413 (LDB1), P = 0.3257 (KLF1), P = 0.7152 (LMO2). c, RNA-IP in newborn erythroid cells with antibodies against LIN28B (A303–588A, Bethyl Labs) or control rabbit IgG. Detection of BCL11A (left), HMGA1 (center), and GATA1 (right) mRNAs (n = 3; 2 independent experiments). Mean is plotted and error bars show s.d. Two-sided Student t-test used. *P < 0.05; ***P < 0.001; N.S., not significant, P = 0.5393. d, Detection of BCL11A (left), HMGA1 (center) and GATA1 (right) mRNAs (n = 3; 3 independent experiments) in the input for LIN28B antibody (A303–588A, Bethyl Labs). Mean is plotted and error bars show s.d. Two-sided Student t-test used. N.S., not significant, P = 0.5261 (BCL11A), P = 0.4871 (HMGA1), P = 0.9464 (GATA1).
A
uthor Man
uscr
ipt
A
uthor Man
uscr
ipt
A
uthor Man
uscr
ipt
A
uthor Man
uscr
ipt
Extended Data Fig. 9:
CLIP-seq of LIN28B in newborn erythroid cells identifies genome-wide binding peaks
a, Genomic annotation of LIN28B binding sites. Peaks passing a 1% IDR for the consensus
between replicates and a 5% false-discovery rate for each replicate are shown. b, 4-mer motifs associated with LIN28B binding sites. The dashed lines represent a threshold of 60%. 17 4-mers are present at >60% in both exons and UTRs, including GGAG, GAAG, and AAGA. c, Fold enrichment of genomic distance covered by LIN28B binding peaks compared to the genome-wide proportions. d, Rank-order enrichment of LIN28B binding peaks genome-wide. Each peak’s enrichment, measured by its -log10 q-value is plotted against its rank genome-wide for both replicates (n = 2). Statistical test: macs2 peak calling
A
uthor Man
uscr
ipt
A
uthor Man
uscr
ipt
A
uthor Man
uscr
ipt
A
uthor Man
uscr
ipt
algorithm. e, Total coverage and mutation proportion for each replicate of the LIN28B/ BCL11A binding site. f, Volcano plots showing the log-fold change with Benjamini-Hochberg adjusted P-values for LIN28B target genes compared between newborn (n = 2) and adult (n = 2) proerythroblasts. Statistical test: generalized linear model from sleuth.
A
uthor Man
uscr
ipt
A
uthor Man
uscr
ipt
A
uthor Man
uscr
ipt
A
uthor Man
uscr
ipt
Extended Data Fig. 10:
Suppression of γ-globin by BCL11A expression in newborn erythroid cells
a, γ-globin levels upon BCL11A expression in newborn erythroid cells on differentiation
day 12 (n = 3; 3 biologically independent experiments) in control and BCL11A expressing cells. Mean is plotted and error bars show s.d. Two-sided student t-test used. ****P < 0.0001. b, Representative western blots showing BCL11A expression from lentiviral construct in newborn erythroid cells at day 12 of differentiation. GAPDH is used as a loading control (3 independent experiments). c, Representative flow cytometry plots
A
uthor Man
uscr
ipt
A
uthor Man
uscr
ipt
A
uthor Man
uscr
ipt
A
uthor Man
uscr
ipt
showing CD71 and CD235a surface expression in control (left) and BCL11A expressing (right) newborn erythroid cells at days 8, 10 and 12 of differentiation (3 biologically independent experiments). Blots have been cropped and the corresponding full blots are available in the Source Data files.
Supplementary Material
Refer to Web version on PubMed Central for supplementary material.
Acknowledgements
We are grateful to D. Nathan, G. Daley, L. Zon, and members of the Sankaran laboratory for valuable guidance and suggestions. We are grateful to D. Tenen for assistance with RNA immunoprecipitation and H. Keshishian for assistance with MS data access. This work was supported by National Institutes of Health grants U01 HL117720, R01 DK103794, and R33 HL120791 (to V.G.S.) and P01 DK32094 (to N.M.), a gift from the Lodish Family to Boston Children’s Hospital (to V.G.S.), and the New York Stem Cell Foundation (to V.G.S.). V.G.S. is a NYSCF-Robertson Investigator.
REFERENCES
1. Sankaran VG & Orkin SH The switch from fetal to adult hemoglobin. Cold Spring Harb Perspect Med 3, a011643 (2013). [PubMed: 23209159]
2. Sankaran VG et al. Human fetal hemoglobin expression is regulated by the developmental stage-specific repressor BCL11A. Science 322, 1839–1842 (2008). [PubMed: 19056937]
3. Sankaran VG et al. Developmental and species-divergent globin switching are driven by BCL11A. Nature 460, 1093–1097 (2009). [PubMed: 19657335]
4. Basak A et al. BCL11A deletions result in fetal hemoglobin persistence and neurodevelopmental alterations. J Clin Invest 125, 2363–2368 (2015). [PubMed: 25938782]
5. Liu N et al. Direct promoter repression by BCL11A controls the fetal to adult hemoglobin switch. Cell 173, 430–442 e17 (2018). [PubMed: 29606353]
6. Xu J et al. Transcriptional silencing of γ-globin by BCL11A involves long-range interactions and cooperation with SOX6. Genes Dev 24, 783–798 (2010). [PubMed: 20395365]
7. Martyn GE et al. Natural regulatory mutations elevate the fetal globin gene via disruption of BCL11A or ZBTB7A binding. Nat Genet 50, 498–503 (2018). [PubMed: 29610478]
8. Sankaran VG & Weiss MJ Anemia: progress in molecular mechanisms and therapies. Nat Med 21, 221–230 (2015). [PubMed: 25742458]
9. Menzel S et al. A QTL influencing F cell production maps to a gene encoding a zinc-finger protein on chromosome 2p15. Nat Genet 39, 1197–1199 (2007). [PubMed: 17767159]
10. Uda M et al. Genome-wide association study shows BCL11A associated with persistent fetal hemoglobin and amelioration of the phenotype of beta-thalassemia. Proc Natl Acad Sci USA 105, 1620–1625 (2008). [PubMed: 18245381]
11. Yen HC, Xu Q, Chou DM, Zhao Z & Elledge SJ Global protein stability profiling in mammalian cells. Science 322, 918–923 (2008). [PubMed: 18988847]
12. Ludwig LS et al. Altered translation of GATA1 in Diamond-Blackfan anemia. Nat Med 20, 748– 753 (2014). [PubMed: 24952648]
13. Dieterich DC, Link AJ, Graumann J, Tirrell DA & Schuman EM Selective identification of newly synthesized proteins in mammalian cells using bioorthogonal noncanonical amino acid tagging (BONCAT). Proc Natl Acad Sci USA 103, 9482–9487 (2006). [PubMed: 16769897]
14. Sankaran VG et al. Exome sequencing identifies GATA1 mutations resulting in Diamond-Blackfan anemia. J Clin Invest 122, 2439–2443 (2012). [PubMed: 22706301]
15. Khajuria RK et al. Ribosome levels selectively regulate translation and lineage commitment in human hematopoiesis. Cell 173, 90–103 e19 (2018). [PubMed: 29551269]
A
uthor Man
uscr
ipt
A
uthor Man
uscr
ipt
A
uthor Man
uscr
ipt
A
uthor Man
uscr
ipt
16. Darnell JC et al. FMRP stalls ribosomal translocation on mRNAs linked to synaptic function and autism. Cell 146, 247–261 (2011). [PubMed: 21784246]
17. Ingolia NT Ribosome footprint profiling of translation throughout the genome. Cell 165, 22–33 (2016). [PubMed: 27015305]
18. Das Sharma S et al. Widespread alterations in translation elongation in the brain of juvenile Fmr1 knockout mice. Cell Rep 26, 3313–3322 e5 (2019). [PubMed: 30893603]
19. Richter JD & Coller J Pausing on polyribosomes: make way for elongation in translational control. Cell 163, 292–300 (2015). [PubMed: 26451481]
20. Chen E, Sharma MR, Shi X, Agrawal RK & Joseph S Fragile X mental retardation protein regulates translation by binding directly to the ribosome. Mol Cell 54, 407–417 (2014). [PubMed: 24746697]
21. McHugh CA et al. The Xist lncRNA interacts directly with SHARP to silence transcription through HDAC3. Nature 521, 232–236 (2015). [PubMed: 25915022]
22. Rappsilber J, Mann M & Ishihama Y Protocol for micro-purification, enrichment, pre-fractionation and storage of peptides for proteomics using StageTips. Nat Protoc 2, 1896–1906 (2007).
[PubMed: 17703201]
23. Munschauer M et al. The NORAD lncRNA assembles a topoisomerase complex critical for genome stability. Nature 561, 132–136 (2018). [PubMed: 30150775]
24. Graf R et al. Identification of LIN28B-bound mRNAs reveals features of target recognition and regulation. RNA Biol 10, 1146–1159 (2013). [PubMed: 23770886]
25. Lee YT et al. LIN28B-mediated expression of fetal hemoglobin and production of fetal-like erythrocytes from adult human erythroblasts ex vivo. Blood 122, 1034–1041 (2013). [PubMed: 23798711]
26. Yuan J, Nguyen CK, Liu X, Kanellopoulou C & Muljo SA Lin28b reprograms adult bone marrow hematopoietic progenitors to mediate fetal-like lymphopoiesis. Science 335, 1195–1200 (2012). [PubMed: 22345399]
27. Rowe RG et al. Developmental regulation of myeloerythroid progenitor function by the Lin28b-let-7-Hmga2 axis. J Exp Med 213, 1497–1512 (2016). [PubMed: 27401346]
28. Copley MR et al. The Lin28b-let-7-Hmga2 axis determines the higher self-renewal potential of fetal haematopoietic stem cells. Nat Cell Biol 15, 916–925 (2013). [PubMed: 23811688] 29. Bronevetsky Y, Burt TD & McCune JM Lin28b regulates fetal regulatory T cell differentiation
through modulation of TGF-beta signaling. J Immunol 197, 4344–4350 (2016). [PubMed: 27793996]
30. Newman MA, Thomson JM & Hammond SM Lin-28 interaction with the Let-7 precursor loop mediates regulated microRNA processing. RNA 14, 1539–1549 (2008). [PubMed: 18566191] 31. Viswanathan SR, Daley GQ & Gregory RI Selective blockade of microRNA processing by Lin28.
Science 320, 97–100 (2008). [PubMed: 18292307]
32. Wilbert ML et al. LIN28 binds messenger RNAs at GGAGA motifs and regulates splicing factor abundance. Mol Cell 48, 195–206 (2012). [PubMed: 22959275]
33. Hafner M et al. Identification of mRNAs bound and regulated by human LIN28 proteins and molecular requirements for RNA recognition. RNA 19, 613–626 (2013). [PubMed: 23481595] 34. Van Nostrand EL et al. Robust transcriptome-wide discovery of RNA-binding protein binding sites
with enhanced CLIP (eCLIP). Nat Methods 13, 508–514 (2016). [PubMed: 27018577]
35. Hafner M et al. Transcriptome-wide identification of RNA-binding protein and microRNA target sites by PAR-CLIP. Cell 141, 129–141 (2010). [PubMed: 20371350]
36. Cho J et al. LIN28A is a suppressor of ER-associated translation in embryonic stem cells. Cell 151, 765–777 (2012). [PubMed: 23102813]
37. Nam Y, Chen C, Gregory RI, Chou JJ & Sliz P Molecular basis for interaction of let-7 microRNAs with Lin28. Cell 147, 1080–1091 (2011). [PubMed: 22078496]
38. Giani FC et al. Targeted application of human genetic variation can improve red blood cell production from stem cells. Cell Stem Cell 18, 73–78 (2016). [PubMed: 26607381]
39. Bray NL, Pimentel H, Melsted P & Pachter L Near-optimal probabilistic RNA-seq quantification. Nat Biotechnol 34, 525–527 (2016). [PubMed: 27043002]
A
uthor Man
uscr
ipt
A
uthor Man
uscr
ipt
A
uthor Man
uscr
ipt
A
uthor Man
uscr
ipt
40. Pimentel H, Bray NL, Puente S, Melsted P & Pachter L Differential analysis of RNA-seq incorporating quantification uncertainty. Nat Methods 14, 687–690 (2017). [PubMed: 28581496] 41. Hahne F & Ivanek R Visualizing genomic data using Gviz and Bioconductor. Methods Mol Biol
1418, 335–351 (2016). [PubMed: 27008022]
42. Ulirsch JC et al. Altered chromatin occupancy of master regulators underlies evolutionary divergence in the transcriptional landscape of erythroid differentiation. PLoS Genet 10, e1004890 (2014). [PubMed: 25521328]
43. Trapnell C et al. Differential gene and transcript expression analysis of RNA-seq experiments with TopHat and Cufflinks. Nat Protoc 7, 562–578 (2012). [PubMed: 22383036]
44. Xue S et al. RNA regulons in Hox 5’ UTRs confer ribosome specificity to gene regulation. Nature 517, 33–38 (2015). [PubMed: 25409156]
45. Koontz L TCA precipitation. Methods Enzymol 541, 3–10 (2014). [PubMed: 24674058] 46. Engreitz JM et al. The Xist lncRNA exploits three-dimensional genome architecture to spread
across the X chromosome. Science 341, 1237973 (2013). [PubMed: 23828888]
47. Dobin A et al. STAR: ultrafast universal RNA-seq aligner. Bioinformatics 29, 15–21 (2013). [PubMed: 23104886]
48. Li W, Wang W, Uren PJ, Penalva LOF & Smith AD Riborex: fast and flexible identification of differential translation from Ribo-seq data. Bioinformatics 33, 1735–1737 (2017). [PubMed: 28158331]
49. Robinson JT et al. Integrative genomics viewer. Nat Biotechnol 29, 24–26 (2011). [PubMed: 21221095]
50. Klass DM et al. Quantitative proteomic analysis reveals concurrent RNA-protein interactions and identifies new RNA-binding proteins in Saccharomyces cerevisiae. Genome Res 23, 1028–1038 (2013). [PubMed: 23636942]
51. Simsek D et al. The mammalian ribo-interactome reveals ribosome functional diversity and heterogeneity. Cell 169, 1051–1065 e18 (2017). [PubMed: 28575669]
A
uthor Man
uscr
ipt
A
uthor Man
uscr
ipt
A
uthor Man
uscr
ipt
A
uthor Man
uscr
ipt
Fig. 1. The developmental expression of BCL11A in erythroid cells is regulated by altered protein synthesis
a, Representative western showing BCL11A protein expression (GAPDH is loading control)
at days 4 and 7 of differentiation in fetal, newborn, and adult erythroid cells (3 independent experiments). b, BCL11A mRNA expression (normalized to GAPDH), assessed by qRT-PCR in fetal, newborn, and adult (n = 3 per time point; 3 biologically independent experiments) at days 4 and 7 of differentiation. Mean plotted, error bars show s.d. c, Representative westerns of BCL11A following cycloheximide (CHX) treatment of newborn