Avian MRP126 Restricts Microbial Growth
through Ca(II)-Dependent Zn(II) Sequestration
The MIT Faculty has made this article openly available.
Please share
how this access benefits you. Your story matters.
Citation
Bozzi, Aaron T. and Elizabeth M. Nolan. "Avian MRP126 Restricts
Microbial Growth through Ca(II)-Dependent Zn(II) Sequestration."
Biochemistry 59, 6 (December 2019): 802–817 © 2019 American
Chemical Society
As Published
http://dx.doi.org/10.1021/acs.biochem.9b01012
Publisher
American Chemical Society (ACS)
Version
Author's final manuscript
Citable link
https://hdl.handle.net/1721.1/128016
Terms of Use
Article is made available in accordance with the publisher's
policy and may be subject to US copyright law. Please refer to the
publisher's site for terms of use.
Supporting Information
Avian MRP126 Restricts Microbial Growth through Ca(II)-dependent Zn(II) Sequestration
Aaron T. Bozzi and Elizabeth M. Nolan*
Department of Chemistry, Massachusetts Institute of Technology, Cambridge, Massachusetts 02139, United States
*Corresponding author: [email protected] Phone: 617-452-2495
This Supporting Information includes:
Supplementary Experimental Section………. S3 Design of the Synthetic Gene………. S10 Supporting Tables………. S11 Table S1. Primers and templates for site-directed mutagenesis……….. S11 Table S2. Mass spectrometry analysis of MRP126 and variants……….. S12 Table S3. Metal content of representative protein preparations………... S13 Table S4. Analytical SEC elution volumes and calculated molecular weights of proteins………… S14 Table S5. Metal content (µM) of Tris:TSB medium with or without treatment with S100 proteins… S15 Table S6. Microbial strains used in this work……… S16 Supporting Figures………... S17 Figure S1. Sequence logo generated from 118 bird/reptile MRP126 sequences………. S17 Figure S2. SDS-PAGE gel of recombinant proteins……… S18 Figure S3. CD spectra of MRP126 variants……….. S19 Figure S4. CD thermal denaturation of MRP126………. S20 Figure S5. Analytical SEC chromatograms of MRP126 variants……….. S21 Figure S6. Fit parameters and simulated fits for MRP126 and MF2 competition……… S22 Figure S7. Fit parameters and simulated fits for DTail and MF2 competition………
.
………..
……… S23 Figure S8. Fit parameters and simulated fits for DHis3Asp and MF2 competition………..…….competition………
S24 Figure S9. Fit parameters and simulated fits for C5S and MF2 competition……… S25 Figure S10. Fit parameters and simulated fits for C102S and MF2 competition………….………… S26 Figure S11. Fit parameters and simulated fits for MRP126 and ZP4……….…... competition……….… competition………
S27 Figure S12. Fit parameters and simulated fits for DTail and ZP4 competition………. ………..…. competition………
S28 Figure S13. Fit parameters and simulated fits for DHis3Asp and ZP4 competition………..
com………
…...
…… competition………S29 Figure S14. Fit parameters and simulated fits for C5S and ZP4 competition………..… S30 Figure S15. Fit parameters and simulated fits for C102S and ZP4 competition………..… S31 Figure S16. Co(II) optical absorption titrations……….…... S32 Figure S17. Summary of findings and comparisons to CP and S100A12……… S33 Supporting References……… S34
Supporting Experimental Section
General Materials and Methods. All chemicals were acquired from commercial suppliers and used as received. All solutions were prepared using Milli-Q water (18.2 MWcm) and buffers were sterile filtered (0.2 µm) before use. ULTROL-grade HEPES (Calbiochem), BioXtra NaCl (>99.5%) and Suprapur NaOH (EMD Millipore) were used to prepare buffers for the Zn(II) competition experiments to minimize metal ion contamination. Stock solutions of Co(II) (20 mM, 100 mL), Ca(II) (1 M, 100 mL), and Zn(II) (100 mM, 100 mL) were prepared from 99.999% CoCl2 (Sigma), CaCl2 (Sigma), and ZnCl2 (Sigma, anhydrous),
respectively, in Milli-Q water. The metal stock solutions were prepared in nitric acid-washed volumetric glassware and stored in sterile polypropylene tubes. Low-millimolar concentration stock solutions of the Zn(II)-sensitive dyes Zinpyr-4 (ZP4) (Strem) in dimethyl sulfoxide (DMSO), Mag-Fura-2 (MF2) tetrapotassium salt (ThermoFisher Scientific) in water, and Zincon (Sigma) in DMSO were prepared, aliquoted, stored at -20 °C, and thawed and diluted immediately before use. Human CP (S100A8/S100A9 heterodimer) and S100A12 were prepared as previously described.1, 2 Protein aliquots were thawed
immediately prior to use. All concentrations were determined using calculated extinction coefficients (https://web.expasy.org/protparam/), and all reported concentrations are for homodimers and heterodimers: chicken MRP126 (all variants) heterodimer (ε280 = 5,960 M-1 cm-1), human S100A8/S100A9 heterodimer
(ε280 = 18,450 M-1 cm-1), human S100A12 heterodimer (ε280 = 5,960 M-1 cm-1). For chicken MRP126, the
ε280 of the native protein was 1.25X greater than that of protein denatured in 6 M guanidine HCl. Absorbance
values used to calculate concentrations of the native protein were therefore adjusted by this factor.
Cloning of Chicken MRP126 Expression Construct. An Escherichia coli codon-optimized synthetic gene encoding the nucleotide sequence for chicken (Gallus gallus) MRP126 was synthesized and ligated into pET41a using the NdeI and XhoI restriction sites by ATUM (see below for sequence). Chemically-competent TOP10 E. coli were transformed with the plasmid for amplification and subsequently purified using a miniprep kit (Qiagen). The DNA sequence was confirmed by DNA sequencing (Quintara Biosciences). Variants of MRP126 were obtained by site-directed mutagenesis as described below. Plasmids were then used to transform BL21(DE3) E. coli and single transformants were used to inoculate
overnight cultures grown in LB supplemented with 50 µg/mL kanamycin. Cultures were then diluted 1:1 into autoclaved 50% glycerol and stored at -80 °C.
Site-directed mutagenesis. Oligonucleotides used to generate MRP126 variants were synthesized by Integrated DNA Technologies (Coralville, IA) (see below for sequences). pET41a-MRP126 was used as a template to generate the DTail (H105Stop), D36H, C5S, and C102S variants. The DHis3Asp
variant (H26N/D36S/H96N/H100N) was generated in two rounds of mutagenesis, with the product of the first round (H26N/D36S) used as the template in the second round to generate the quadruple mutant H26N/D36S/H96N/H100N. We note that we initially prepared a plasmid for a DHis3Asp variant where the
four His3Asp site residues were mutated to four alanines; however, this protein variant was found in the
insoluble fraction after overexpression in E. coli and cell lysis (data not shown). Primers were designed to have a melting temperature of ≈81 °C as calculated using the formula TM = 81.5 + (0.41 × %GC) – 675 / N
– 100 × %mismatch (Stratagene), where N is the number of nucleotides, %GC is the percent of nucleotides that are G or C, and % mismatch is the percent of nucleotides in the primer that do not match the template. A modified QuikChange mutagenesis protocol was used with Pfu Turbo DNA polymerase (Agilent) and the following thermocycle protocol: 98 °C for 30 s; 98 °C for 30 s, 55 °C for 30 s, 72 °C for 12 min (20X); 72 °C for 12 min, 12 °C hold. DpnI (New England Biolabs) was used to degrade the template plasmid by adding a 1-µL aliquot to the reaction product and incubating overnight at 37 °C. The resulting DNA was used to transform chemically-competent TOP10 E. coli, with the cells plated on LB agar supplemented with 50 µg/mL kanamycin. Single colonies were inoculated into LB (5 mL, 50 µg/mL kanamycin) and grown overnight and plasmids were isolated using a miniprep kit (Qiagen). Plasmid sequences were confirmed by DNA sequencing (Quintara Biosciences). Plasmids with the correct mutations were transformed into BL21(DE3) E. coli for protein overexpression.
Recombinant expression of MRP126. Cultures of transformed BL21(DE3) E. coli in LB (50 mL, 50 µg/mL kanamycin) were inoculated from freezer stocks and grown overnight (≈16 h) to saturation. A 2-L culture of 2-LB-kanamycin was inoculated 1/100 from the overnight culture and grown at 37 °C with shaking at 150 rpm. When the OD600 reached approximately 0.6, protein expression was induced with 0.5 mM IPTG
and the temperature was reduced to 25 °C for overnight (≈20 h) expression with shaking at 150 rpm. Cells were pelleted by centrifugation (3500 rpm, 15 min, 4 °C), transferred to polypropylene tubes, flash-frozen in liquid N2, and stored at -80 °C. Typical cell pellets weighed ≈4–5 g/L of culture.
Purification of MRP126. All protein purification steps were performed on ice or at 4 °C. For native MRP126, a 2-L cell pellet was thawed on ice and resuspended in ≈50 mL of lysis buffer (50 mM Tris, 100 mM NaCl, 1 mM EDTA, 0.5% Triton X-100, pH 8.0), with 5 mM DTT (from a frozen 1-M stock solution) and 1 mM PMSF (from a 100-mM stock solution in ethanol stored at -20 °C) added just before use. The cells were sonicated (3 min, 30 s on, 10 s off, 40% amplitude) in a steel beaker on ice, and the cell lysate was then centrifuged (22,000 rpm, 10 min, 4 °C). The supernatant containing soluble MRP126 was transferred to a 500-mL plastic beaker on ice, and the pellet was resuspended in ≈60 mL of lysis buffer and sonicated a second time (2 min, 30 s on, 10 s off, 40% amplitude). The lysate was centrifuged again, and the second supernatant was combined with the first for a total volume of ≈120 mL. The combined lysate was treated with 50% ammonium sulfate to precipitate contaminating proteins (rapid stirring, ≈1 h, 4 °C). The solution containing soluble MRP126 was centrifuged (22,000 rpm, 20 min, 4 °C), and the supernatant was filtered and transferred to a dialysis bag (SpectraPor, 3,500 kDa MWCO). The protein solution was dialyzed against 20 mM HEPES, pH 8.0 supplemented with 5 mM DTT (4 L, >12 h, 2X , 4 °C) and then against 20 mM acetic acid, pH 5.0 supplemented with 5 mM DTT (4 L, >12 h, 2X , 4 °C), with DTT powder freshly added to each dialysis buffer just before use. After dialysis, the protein solution was centrifuged (22,000 rpm, 20 min, 4 ° C), filtered (0.2 µm), and loaded onto a pre-equilibrated MonoS 10/100 GL column (GE Life Sciences) using a Superloop (150 mL, GE Life Sciences) in MonoS buffer A (20 mM acetic acid, pH 5.0) supplemented with 5 mM DTT. Contaminating proteins were removed by washing the column with 2 column volumes of MonoS buffer A and 3 column volumes of 35% MonoS buffer B (20 mM acetic acid, 1 M NaCl, pH 5.0). MRP126 was eluted with a gradient of 35–65% B over 9 column volumes. The fractions containing MRP126 were combined, concentrated to ≈15 mL by spin filtration (Amicon, 10 kDa MWCO), and loaded onto a pre-equilibrated HiLoad 26/600 Superdex S75 column (GE Life Sciences) using 20 mM acetic acid, 100 mM NaCl, pH 5.0 containing 5 mM DTT. The protein was dialyzed against 4 L of 20 mM HEPES, 100 mM NaCl, pH 8.0, 5 mM DTT overnight (>12 h) at 4 °C and then dialyzed against 1 L of 20 mM HEPES, 100 mM
NaCl, pH 8.0, 5 mM DTT supplemented with ≈10 g of Chelex resin (Biorad) overnight (>12 h) at 4 °C. The protein was then filtered (0.2 µm) and concentrated to ≈1 mM by spin filtration (Amicon, 15 mL filter, 10 kDa MWCO), flash frozen in 50-µL aliquots, and stored at −80 °C. Typical yields for MRP126 were ≈60–90 mg/2L of culture. MRP126 variants were prepared analogously with a few modifications. For DHis3Asp, to
avoid precipitation of the desired protein, only 20% ammonium sulfate was added to the pooled lysate, and the dialysis buffers were supplemented with 75 mM NaCl. For DTail, the MonoS column was washed with 15% MonoS B and the protein was eluted using a 15–45% gradient of MonoS B. For D36H, the MonoS column was washed with 40% MonoS B and the protein was eluted using a 40–70% gradient of MonoS B. Typical yields for MRP126 variants were slightly lower than for the native protein (≈40–60 mg/2L of culture).
Protein characterization. Electrospray ionization mass spectrometry (ESI-MS), circular dichroism (CD) spectroscopy, and analytical size exclusion chromatography (aSEC), SDS-PAGE, and ICP-MS were performed as described.3 For ESI-MS measurements, protein samples were diluted to 8 µM in Milli-Q water.
For CD measurements, protein samples were thawed and buffer exchanged three times by spin filtration (Amicon, 0.5 mL filter, 10 kDa MWCO) into 1 mM Tris-HCl, pH 7.5 + 0.2 mM TCEP and diluted to 8 µM in 1 mM Tris-HCl, pH 7.5 + 0.2 mM TCEP, ± 2 mM Ca(II), ± 100 µM Zn(II). For analytical SEC, protein samples were buffer-exchanged into SEC running buffer of 75 mM HEPES, 100 mM NaCl, pH 7.0 + 0.2 mM TCEP ± 2 mM Ca(II) and diluted to 80 µM. For samples with Zn(II), 350 µM Zn(II) was added to the protein sample at 4 °C before centrifuging and loading the sample.
Metal-depletion Assay. The metal-depletion assay and ICP-MS analyses of the resulting samples were performed as described.3 Protein samples were thawed and buffer exchanged three times by spin
filtration (Amicon, 0.5 mL filter, 10 kDa MWCO) into antimicrobial activity (AMA) buffer (20 mM Tris-HCl, pH 7.5, 100 mM NaCl), AMA buffer was mixed with TSB in a 62:38 buffer/TSB v/v ratio; ± 3 mM BME, ± 2 mM Ca(II). In sterile 1.7-mL tubes, 900 µL of Tris:TSB was added 100 µL of 80 µM protein in AMA buffer to yield a final concentration of 8 µM. Samples were incubated at 30 °C for 20 h shaking at 150 rpm before collection for spin filtration and ICP-MS analysis.
Antimicrobial Activity Assays. Antimicrobial activity (AMA) assays were performed as described.3 Sterile filtered AMA buffer (vide supra) was mixed in a 62:38 v/v ratio with microbial growth
media (as appropriate for each organism, listed in Table S6) ± 2 mM Ca(II). Protein samples were thawed and buffer exchanged three times by spin filtration (Amicon, 0.5 mL filter, 10 kDa MWCO) into AMA buffer. Cultures of each microbe at OD600 ≈ 0.6 were diluted 1:500 into this media and 90 µM was added to 10 µL
of 10X protein in AMA buffer (or buffer only) in a clear-bottom 96-well plate (polystyrene, Corning). Plates were wrapped in wet paper towels and plastic wrap and incubated at 37 °C for 8 or 20 h shaking at 150 rpm, and the OD600 was recorded using a BioTek Synergy HT plate reader.
Zn(II) Competition Titrations with MRP126 and metal-binding dyes. Zn(II) competition titrations with Zincon, MF2, and ZP4 were performed as described.1, 4 For all assays, protein was buffer exchanged
three times by spin filtration (Amicon, 0.5 mL filter, 10 kDa MWCO) into 75 mM HEPES, 100 mM NaCl, pH 7.0 + 0.2 mM TCEP. For Zincon competition, 8 µM protein and 20 µM Zincon were diluted in 2 mL of buffer ± 2 mM Ca(II). To this mixture, 2.5 mM Zn(II) was added in increments of 2 µL 24 times, 4 µL 2 times, and 8 µL two times, with the optical absorption spectra from 200–800 nm recorded after an incubation of at least 2 min following each addition. Formation of the Zn(II)-Zincon complex was monitored via the increase in absorbance at 621 nm. For MF2 competition, 8 µM protein and 10 µM MF2 were diluted in 2 mL of buffer (without Ca(II)). To this mixture, 2.5 mM Zn(II) was added in increments of 2 µL 28 times with the optical absorption spectra from 200 to 800 nm recorded after each addition. Formation of the Zn(II)-MF2 complex was monitored via the increase in absorbance at 325 nm. Zn(II) competition titrations in the presence of Ca(II) were not performed with MF2 because this sensor is responsive to Ca(II). For ZP4 competition, 4 µM protein and ≈1.5 µM ZP4 were diluted in 2 mL of buffer ± 2 mM Ca(II). To this mixture, 0.5 mM Zn(II) was added in increments of 2 µL 30 times and 4 µL five times. Formation of the Zn(II)-ZP4 complex was monitored by measuring the fluorescence emission (lex = 495 nm, with emission integrated from lem = 505–
650 nm).
Co(II)-binding Titrations and substitution Assays. Co(II)-binding titrations and Zn(II)-substitution experiments were performed as described.1, 4 The protein was buffer exchanged three times
by spin filtration (Amicon, 0.5 mL filter, 10 kDa MWCO) into 75 mM HEPES, 100 mM NaCl, pH 7.0 + 0.2 mM TCEP ± 6 mM Ca(II) and diluted to 240 µM. To 300-µL protein, 20 mM Co(II) was added in increments of 2.3 µL16 times to reach a final concentration of 2.4 mM, with the optical absorption spectra from 200 to 800 nm recorded after each addition. For the Zn(II) substitution, 7.2 µL of 100 mM Zn(II) (10 equivalents) was added to the Co(II)-protein solution and the optical absorption spectra were recorded at 2, 6, 20, 60, and 120 min timepoints post addition.
Fitting binding constants to the Zn(II) competition data. The Zn(II) titration competition data with MF2 for each variant were fit using Dynafit5 and a custom script as previously described.2 For MRP126,
two different binding affinities were fit according to the following equilibria:
E + M <==> E.M : Ka dissoc E.M + M <==> E.M.M : Ka dissoc E.M.M + M <==> E.M.M.M : Ka dissoc E.M.M.M + M <==> E.M.M.M.M : Ka dissoc E.M.M.M.M + M <==> E.M.M.M.M.M : Kc dissoc E.M.M.M.M.M + M <==> E.M.M.M.M.M.M : Kc dissoc L + M <==> LM : Kd dissoc
where “E” is the protein (MRP126 dimer), “M” is the Zn(II), and “L” is the dye (MF2). The Ka dissociation constant was used to model the first 4 Zn(II) equivalents to bind to the protein, the Kc dissociation was used to model the next 2 Zn(II) equivalents to bind to the protein, and the Kd dissociation constant for Zn(II)-MF2 binding was set as the previously-reported value of 36 nM.6 The raw titration data (in triplicate) were used
for each fit. To fit the data, the constants Ka and Kc as well as the concentration of protein and the concentration of dye and the minimum/maximum response were allowed to fluctuate to fit the data. Fits in which the protein/dye concentrations varied by greater than ≈10% from that expected were rejected. MRP126 variants titration data were fit the same way, except that only 2 Zn(II) equivalents were fit to a Ka for the DHis3Asp variant and no Zn(II) binding with a Kc was fit for the DTail variant.
The Zn(II) titration competition data with ZP4 for each variant were fit similarly with Dynafit. For the MRP126, two different binding affinities were fit according to the following equilibria:
E + M <==> E.M : Ka dissoc E.M + M <==> E.M.M : Ka dissoc E.M.M + M <==> E.M.M.M : Kb dissoc E.M.M.M + M <==> E.M.M.M.M : Kb dissoc L + M <==> LM : Kd dissoc
where “E” is the protein (MRP126 dimer), “M” is the Zn(II), and “L” is the dye (ZP4). The Ka dissociation constant was used to model the first 2 Zn(II) equivalents to bind to the protein, the Kb dissociation was used to model the next 2 Zn(II) equivalents to bind to the protein, and the Kd dissociation constant for Zn(II)-ZP4 binding was set as the previously-reported value of 650 pM.7 The raw titration data (in triplicate) were used
for each fit. To fit the data, the constants Ka and Kb as well as the concentration of protein and the concentration of dye and the minimum/maximum response were allowed to fluctuate to fit the data. Fits in which the protein/dye concentrations varied by greater than ≈10% from that expected were rejected. MRP126 variants titration data were fit the same way, except that no third or fourth Zn(II) binding with a Kb was fit for the DHis3Asp, C5S, or C102S variants.
The binding affinity results from the MF2 competition (without Ca(II)) do not agree entirely with the result obtained with ZP4 in the absence of Ca(II). If the binding affinities were in the low-nanomolar range, then it would be expected that the protein would be able to more effectively compete with ZP4 than it did in the absence of Ca(II). Thus, there is some inconsistency between the results from the MF2 and the ZP4 experiments. Some skepticism about the absolute values of the binding constants determined via this method is warranted, but relative comparisons will still be informative between the variants and between conditions with and without Ca(II).
Design of the Synthetic Gene
The synthetic gene for chicken MRP126 expression was optimized for E. coli codon usage and ordered from ATUM in the pET41a vector. An NdeI restriction site was placed at the 5ʹ end and a stop codon and an XhoI restriction site was placed at the 3ʹ end.
E. coli optimized nucleotide sequence for NdeI-MRP126-Stop-XhoI:
CAT ATG AGC AAA GGT TGT CAA ACG CAA GGC CCG CTG TCT GAA CTG GAA AAG GCA ATT GAT GTT ATC ATC GAC GTT TTT CAT CAA TAT AGC CGT CGC GAG GGT GAC AAA GAT ACC CTG ACG CGT AAA GAA CTG AAG TTG CTG ATT GAG AAA CAG CTG GCC AAC TAC TTG AAA CAT GTG AAG AAT CAA GTT AGC ATT GAC CAG ATC TTT AAA GAC CTG GAC AAC AAC AAA GAT CAA CAG CTG TCC TTC GGC GAA GTC ATG CTG CTG ATT ATC CGT GTG ACC GTC GCG ACC CAC GAG CAT CTG CAC TTC TGC GAG GAT CAC CAA CAG CAG CAC CAA CAC CAG CAC CAG CAT CAG CAT AAT CAC TAA CTC GAG
Translated sequence for NdeI-MRP126-Stop-XhoI:
H M S K G C Q T Q G P L S E L E K A I D V I I D V F H Q Y S R R E G D K D T L T R K E L K L L I E K Q L A N Y L K H V K N Q V S I D Q I F K D L D N N K D Q Q L S F G E V M L L I I R V T V A T H E H L H F C E D H Q Q Q H Q H Q H Q H Q H N H Stop L E
Supporting Tables
Table S1. Primers and templates for site-directed mutagenesis.a
Primer Sequence H105Stop-1 5ʹ-AGGATTAACAACAGCAGCACCAACACCAGCACCAGCATCAG-3ʹ H105Stop-2 5ʹ-TGTTGTTAATCCTCGCAGAAGTGCAGATGCTCGTGGGTCG-3ʹ H26N/D36S-1 5ʹ-ACAAATCTACCCTGACGCGTAAAGAACTGAAGTTGCTGATTGAGAAACAG-3ʹ H26N/D36S-2 5ʹ-GGGTAGATTTGTCACCCTCGCGACGGCTATATTGATTAAAAACGTCGATG-3ʹ H96N/H100N-1 5ʹ-CGACCAACGAGCATCTGAACTTCTGCGAGGATCACCAAC-3ʹ H96N/H100N-2 5ʹ-CTCGTTGGTCGCGACGGTCACACGGATAATCAG-3ʹ D36H-1 5ʹ-ACAAACATACCCTGACGCGTAAAGAACTGAAGTTGCTGATTG-3ʹ D36H-2 5ʹ-GGTATGTTTGTCACCCTCGCGACGGCTATATTGATG-3ʹ C5S-1 5ʹ-AAGGTAGTCAAACGCAAGGCCCGCTGTCTGAAC-3ʹ C5S-2 5ʹ-AGCGGGCCTTGCGTTTGACTACCTTTGCTCATATG-3ʹ C102S-1 5ʹ-ACTTCAGCGAGGATCACCAACAGCAGCACCAAC-3ʹ C102S-2 5ʹ-CTCGCTGAAGTGCAGATGCTCGTGGGTCGC-3ʹ
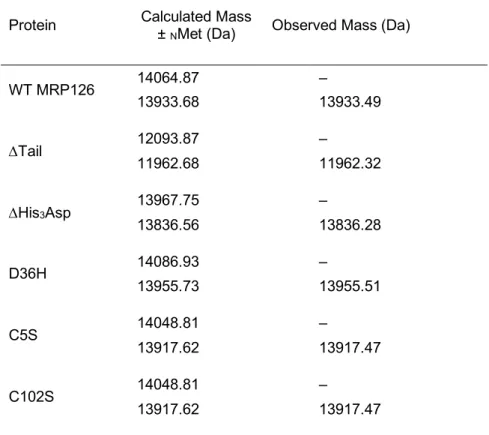
Table S2. Mass spectrometry analysis of MRP126 variants.a
Protein Calculated Mass ±
NMet (Da) Observed Mass (Da)
WT MRP126 14064.87 – 13933.68 13933.49 DTail 12093.87 – 11962.68 11962.32 DHis3Asp 13967.75 – 13836.56 13836.28 D36H 14086.93 – 13955.73 13955.51 C5S 14048.81 – 13917.62 13917.47 C102S 14048.81 – 13917.62 13917.47
Table S3. Metal content of representative protein preparations.a
Metal MRP126 DTail DHis3Asp D36H C5S C102S
[Mg] (µM) 0.355 0.395 0.569 0.316 0.196 0.301 equivalents 0.044 0.049 0.071 0.039 0.025 0.038 [Ca] (µM) 0.512 0.382 1.064 0.303 0.135 0.295 equivalents 0.064 0.048 0.133 0.038 0.017 0.037 [Mn] (µM) 0.005 0.007 0.008 0.005 0.005 0.005 equivalents 0.001 0.001 0.001 0.001 0.001 0.001 [Fe] (µM) 0.268 0.295 0.377 0.254 0.231 0.260 equivalents 0.034 0.037 0.047 0.032 0.029 0.033 [Co] (µM) 0.003 0.004 0.005 0.003 0.007 0.003 equivalents 0.000 0.000 0.001 0.000 0.001 0.000 [Ni] (µM) 0.026 0.027 0.036 0.026 0.024 0.022 equivalents 0.003 0.003 0.004 0.003 0.003 0.003 [Cu] (µM) 0.012 0.014 0.016 0.029 0.013 0.013 equivalents 0.002 0.002 0.002 0.004 0.002 0.002 [Zn] (µM) 0.082 0.060 0.077 0.088 0.043 0.042 equivalents 0.010 0.008 0.010 0.011 0.005 0.005
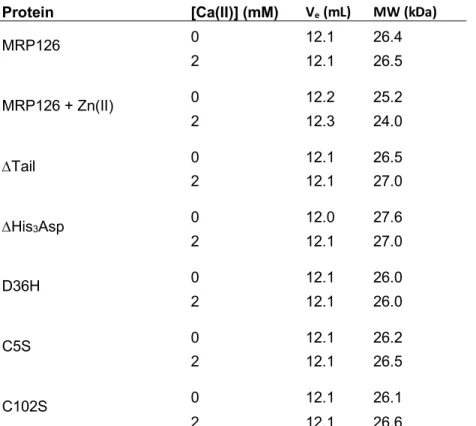
Table S4. Analytical SEC elution volumes and calculated molecular weights of proteins. Protein [Ca(II)] (mM) Ve (mL) MW (kDa)
MRP126 0 12.1 26.4 2 12.1 26.5 MRP126 + Zn(II) 0 12.2 25.2 2 12.3 24.0 DTail 0 12.1 26.5 2 12.1 27.0 DHis3Asp 0 12.0 27.6 2 12.1 27.0 D36H 0 12.1 26.0 2 12.1 26.0 C5S 0 12.1 26.2 2 12.1 26.5 C102S 0 12.1 26.1 2 12.1 26.6
For each SEC run, 100 µL of 80 µM protein was loaded on a Superdex 75 10/300 GL SEC column in a running buffer of 75 mM HEPES, 100 mM NaCl, pH 7.0 + 0.2 mM TCEP ± 2 mM Ca(II). For MRP126 +Zn(II), 350 µM Zn(II) was added to the protein before loading the sample. The elution volume (Ve) corresponds to
the maximum peak absorbance at 280 nm, and the molecular weight was calculated from comparing Ve to
Table S5. Metal content (µM) of Tris:TSB medium with or without treatment with 8 µM MRP126, DTail, DHis3Asp, D36H, or 10 µM hCP.a
Metal Protein n.s. SEM BME SEM Ca(II) SEM Ca(II), BME SEM Mn untreated 0.113 0.004 0.123 0.001 0.125 0.003 0.133 0.003 MRP126 0.124 0.001 0.125 0.001 0.109 0.004 0.121 0.004 DTail 0.125 0.005 0.127 0.002 0.117 0.004 0.121 0.005 DHis3Asp 0.120 0.004 0.128 0.004 0.128 0.003 0.131 0.006 D36H 0.129 0.003 0.134 0.006 0.123 0.005 0.125 0.005 hCP 0.006 0.001 0.009 0.004 0.009 0.003 0.007 0.002 Fe untreated 1.936 0.080 2.232 0.025 2.340 0.067 2.459 0.131 MRP126 2.019 0.088 2.056 0.041 2.415 0.097 2.374 0.084 DTail 2.439 0.448 2.198 0.162 2.548 0.128 2.602 0.320 DHis3Asp 2.061 0.119 2.093 0.165 2.356 0.118 2.872 0.464 D36H 2.247 0.080 2.080 0.041 2.521 0.196 2.455 0.187 hCP 1.405 0.166 1.131 0.550 0.960 0.210 0.480 0.084 Co untreated 0.018 0.001 0.020 0.000 0.020 0.001 0.021 0.001 MRP126 0.019 0.000 0.019 0.000 0.019 0.001 0.019 0.000 DTail 0.019 0.000 0.022 0.003 0.022 0.002 0.019 0.001 DHis3Asp 0.020 0.001 0.020 0.001 0.021 0.001 0.021 0.001 D36H 0.022 0.002 0.021 0.001 0.021 0.001 0.022 0.001 hCP 0.021 0.002 0.018 0.001 0.020 0.001 0.018 0.001 Ni untreated 0.557 0.083 0.651 0.024 0.615 0.092 0.701 0.078 MRP126 0.575 0.115 0.538 0.036 0.437 0.066 0.584 0.030 DTail 0.716 0.140 0.621 0.061 0.507 0.040 0.447 0.051 DHis3Asp 0.758 0.115 0.680 0.141 0.650 0.062 0.622 0.044 D36H 0.420 0.047 0.355 0.007 0.250 0.019 0.351 0.023 hCP 0.365 0.034 0.347 0.038 0.304 0.035 0.310 0.031 Cu untreated 0.078 0.003 0.086 0.005 0.089 0.004 0.088 0.003 MRP126 0.085 0.002 0.087 0.004 0.085 0.004 0.083 0.003 DTail 0.095 0.005 0.089 0.003 0.090 0.005 0.083 0.002 DHis3Asp 0.079 0.001 0.081 0.003 0.081 0.002 0.086 0.003 D36H 0.095 0.023 0.070 0.002 0.060 0.004 0.066 0.003 hCP 0.057 0.003 0.058 0.008 0.058 0.008 0.042 0.005 Zn untreated 3.617 0.136 4.142 0.057 3.798 0.129 4.447 0.129 MRP126 0.236 0.079 0.130 0.036 0.217 0.124 0.143 0.048 DTail 0.096 0.005 0.172 0.035 0.093 0.005 0.104 0.009 DHis3Asp 2.388 0.061 1.771 0.116 2.249 0.030 1.305 0.057 D36H 0.587 0.051 0.458 0.054 0.364 0.154 0.230 0.006 hCP 0.135 0.043 0.126 0.036 0.096 0.007 0.160 0.069
Table S6. Microbial strains used in this work. Strain
Growth
Medium Source
Escherichia coli K12 TSB Keio Collection
Escherichia coli DznuA TSB Keio Collection
Salmonella enterica serovar Typhimurium IR715 TSB Rafatellu Lab (UCSD)8
Salmonella enterica serovar Enteritidis P125109 TSB Rafatellu Lab (UCSD)9
Acinetobacter baumannii TSB ATCC 17961
Staphylococcus aureus USA300 JE2 TSB NARSA repository
Listeria monocytogenes BHI ATCC 19115
Lactobacillus plantarum WCFS1 MRS ATCC
Supporting Figures
Figure S1. Sequence logo generated from 118 bird/reptile MRP126 sequences compared to chicken MRP126. Chicken MRP126 was used as a search sequence for protein BLAST. An e-value of 1 x 10-30 was
used to filter out mammalian sequences. Sequences were aligned using MUSCLE,10 and a sequence logo
was generated using WebLogo 3.11 In the chicken MRP126 sequence shown below the sequence logo,
Ca(II)-binding site residues are colored purple, His3Asp site residues are colored orange, likely Cys2His2
Figure S2. SDS-PAGE gel (15% Tris-HCl, with reducing sample buffer) shows purity of recombinant proteins used in this study. Lane 1: New England Biolabs Color Prestained Protein Standard, Broad Range (11–245 kDa). Lane 2: MRP126 (13.9 kDa). Lane 3: DTail (12.0 kDa). Lane 4: DHis3Asp (13.8 kDa). Lane
5: D36H (14.0 kDa). Lane 6: C5S (13.9 kDa). Lane 7: C102S (13.9 kDa). Lane 8: hCP (10.8 kDa S100A8, 13.2 kDa S100A9). Lane 9: hS100A12 (10.6 kDa). Lane10: same as Lane 1. The faint bands between 25 and 32 kDa for MRP126 variants were confirmed to also be MRP126 (perhaps a persistent non-covalent oligomer or disulfide-linked form) by excising the bands, digesting the protein with trypsin, and performing LC-MS/MS to identify the resulting fragments.
1 2 3 4 5 6 7 8 9 10 25 22 17 11 32 46 kDa-MRP1 26 DTail DHis 3AspD36H C5 S C102 S hCP hS100A 12
Figure S3. CD spectra of MRP126 variants (8 µM) in the absence (black) and presence (red) of 2 mM Ca(II) in 1 mM Tris-HCl, pH 7.5, with 0.2 mM TCEP at 25 °C. Spectra are averages of three measurements and are representative of at least two independent experiments.
Figure S4. CD thermal denaturation of MRP126. Protein (8 µM) in the absence (black) and presence (red) of 2 mM Ca(II) in 1 mM Tris-HCl, pH 7.5, with 0.2 mM TCEP was heated from 35 °C to 95 °C in 1 °C increments, and the CD signal was recorded at 226 nm. The relative change between the starting (T ≤ 40 °C) value and ending (T ≥ 90 °C) value normalized to the change observed for the no metal condition is plotted. Data are averages of three independent experiments.
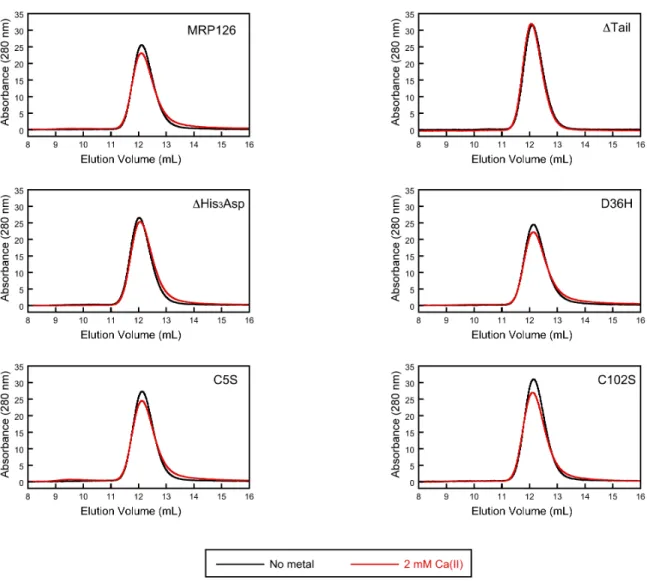
Figure S5. Analytical SEC chromatograms of MRP126 variants (80 µM) in the absence (black) and presence (red) of 2 mM Ca(II) in 75 mM HEPES, 100 mM NaCl, pH 7.0, with 0.2 mM TCEP at 4 °C. Elution volumes are listed in Table S4. Data are representative of at least two independent experiments.
Figure S6. Fit parameters and simulated fits with higher and lower Kd values for MRP126 and MF2 competition. Fit parameters [MRP126] = 7.9 μM [MF2] = 9.9 μM Kd,A,Zn(II)= 1 ± 0.3 nM [Sites 1+2, 4 equiv] Kd,B,Zn(II)= 80 ± 10 nM [Site 3, 2 equiv] Kd,MF2,Zn(II)= 36 nM
Figure S7. Fit parameters and simulated fits with higher and lower Kd values for DTail and MF2 competition. Fit parameters [ΔTail ] = 7.4 μM [MF2] = 9.5 μM Kd,A,Zn(II)= 1.6 ± 0.5 nM [Sites 1+2, 4 equiv] Kd,MF2,Zn(II)= 36 nM
Figure S8. Fit parameters and simulated fits with higher and lower Kd values for DHis3Asp and MF2 competition. Fit parameters [ΔHis3Asp ] = 9.1 μM [MF2] = 11.2 μM Kd,A,Zn(II)= 7 ± 2 nM [Site 2, 2 equiv] Kd,B,Zn(II)= 190 ± 40 nM [Site 3, 2 equiv] Kd,MF2,Zn(II)= 36 nM
Figure S9. Fit parameters and simulated fits with higher and lower Kd values for C5S and MF2 competition. Fit parameters [C5S ] = 7.9 μM [MF2] = 9.9 μM Kd,A,Zn(II)= 5 ± 1 nM [Sites 1+2, 4 equiv] Kd,B,Zn(II)= 130 ± 40 nM [Site 3, 2 equiv] Kd,MF2,Zn(II)= 36 nM
Figure S10. Fit parameters and simulated fits with higher and lower Kd values for C102S and MF2 competition. Fit parameters [C102S ] = 7.3 μM [MF2] = 9.5 μM Kd,A,Zn(II)= 4.3 ± 0.7 nM [Sites 1+2, 4 equiv] Kd,B,Zn(II)= 150 ± 40 nM [Site 3, 2 equiv] Kd,MF2,Zn(II)= 36 nM
Figure S11. Fit parameters and simulated fits with higher and lower Kd values for MRP126 and ZP4 competition. Fit parameters [MRP126] = 4.16 μM [ZP4] = 1.43 μM Kd,A,Zn(II)= 23 ± 4 pM [Site 1, 2 equiv] Kd,B,Zn(II)= 3.6 ± 0.4 nM [Site 2, 2 equiv] Kd,ZP4,Zn(II)= 650 pM
Figure S12. Fit parameters and simulated fits with higher and lower Kd values for DTail and ZP4 competition. Fit parameters [ΔTail ] = 4.38 μM [MF2] = 1.42 μM Kd,A,Zn(II)= 67 ± 8 pM [Site 1, 2 equiv] Kd,B,Zn(II)= 13 ± 2 nM [Site 2, 2 equiv] Kd,ZP4,Zn(II)= 650 pM
Figure S13. Fit parameters and simulated fits with higher and lower Kd values for DHis3Asp and ZP4 competition. Fit parameters [ΔHis3Asp ] = 4.01 μM [ZP4] = 1.36 μM Kd,A,Zn(II)= 1.9 ± 0.2 nM [Site 2, 2 equiv] Kd,ZP4,Zn(II)= 650 pM
Figure S14. Fit parameters and simulated fits with higher and lower Kd values for C5S and ZP4 competition. Fit parameters [C5S ] = 4.15 μM [ZP4] = 1.43 μM Kd,A,Zn(II)= 42 ± 4 pM [Site 1, 2 equiv] Kd,ZP4,Zn(II)= 650 pM
Figure S15. Fit parameters and simulated fits with higher and lower Kd values for C102S and ZP4 competition. Fit parameters [C102S ] = 4.13 μM [ZP4] = 1.42 μM Kd,A,Zn(II)= 49 ± 5 pM [Site 1, 2 equiv] Kd,ZP4,Zn(II)= 650 pM
Figure S16. Co(II) optical absorption titrations. Expanded plots of the spectra shown in Figure 6 show the Co–S charge-transfer transitions below 400 nm. Each line represents an addition of 300 µM Co(II) (1.25 equivalents). + Co(II) + Co(II) + Co(II) + Co(II) + Co(II) + Co(II) + Co(II) + Co(II) + Co(II) + Co(II)
Figure S17. Summary of findings in this work as compared to previous studies with human CP and S100A12. See main text for details. A mass spectrometry study reported that Zn(II) binding to hCP induced heterotetramer formation.12 His3Asp His3Asp His3Asp His6 His3Asp His3Asp Hisx Hisx Cys2 His2 Cys2 His2
CP (S100A8/S100A9) S100A12 MRP126
Ca(II) Zn(II) and/or Ca(II) Zn(II) and/or Ca(II) Zn(II)
Sequesters Mn(II), Fe(II), Ni(II), Zn(II) Sequesters Zn(II) Sequesters Zn(II)
Effective against limited range of pathogens Effective against limited range of pathogens Effective against broad range of pathogens
mammalian homodimer
mammalian heterodimer avian homodimer
Oligomerization behavior
Ca(II) increases metal-binding affinity and enhances antimicrobial activity
Oligomerization behavior Oligomerization behavior
Ca(II) likely increases metal-binding affinity
and does enhance antimicrobial activity Ca(II) increases metal-binding affinity and enhances antimicrobial activity
Supporting References
[1] Cunden, L. S., Gaillard, A., and Nolan, E. M. (2016) Calcium ions tune the zinc-sequestering properties and antimicrobial activity of human S100A12, Chem. Sci. 7, 1338-1348.
[2] Brophy, M. B., Hayden, J. A., and Nolan, E. M. (2012) Calcium ion gradients modulate the zinc affinity and antibacterial activity of human calprotectin, J. Am. Chem. Soc. 134, 18089-18100.
[3] Hadley, R. C., Gu, Y., and Nolan, E. M. (2018) Initial biochemical and functional evaluation of murine calprotectin reveals Ca(II)-dependence and its ability to chelate multiple nutrient transition metal ions, Biochemistry 57, 2846-2856.
[4] Cunden, L. S., Brophy, M. B., Rodriguez, G. E., Flaxman, H. A., and Nolan, E. M. (2017) Biochemical and functional evaluation of the intramolecular disulfide bonds in the zinc-chelating antimicrobial protein human S100A7 (psoriasin), Biochemistry 56, 5726-5738.
[5] Kuzmic, P. (1996) Program DYNAFIT for the analysis of enzyme kinetic data: Application to HIV proteinase, Anal. Biochem. 237, 260-273.
[6] Golynskiy, M. V., Gunderson, W. A., Hendrich, M. P., and Cohen, S. M. (2006) Metal binding studies and EPR spectroscopy of the manganese transport regulator MntR, Biochemistry 45, 15359-15372.
[7] Burdette, S. C., Frederickson, C. J., Bu, W. M., and Lippard, S. J. (2003) ZP4, an improved neuronal Zn2+ sensor of the Zinpyr family, J. Am. Chem. Soc. 125, 1778-1787.
[8] Stojiljkovic, I., Baumler, A. J., and Heffron, F. (1995) Ethanolamine utilization in Salmonella
typhimurium: nucleotide sequence, protein expression, and mutational analysis of the cchA cchB eutE eutJ eutG eutH gene cluster, J. Bacteriol. 177, 1357-1366.
[9] Thomson, N. R., Clayton, D. J., Windhorst, D., Vernikos, G., Davidson, S., Churcher, C., Quail, M. A., Stevens, M., Jones, M. A., Watson, M., Barron, A., Layton, A., Pickard, D., Kingsley, R. A., Bignell, A., Clark, L., Harris, B., Ormond, D., Abdellah, Z., Brooks, K., Cherevach, I.,
Chillingworth, T., Woodward, J., Norberczak, H., Lord, A., Arrowsmith, C., Jagels, K., Moule, S., Mungall, K., Sanders, M., Whitehead, S., Chabalgoity, J. A., Maskell, D., Humphrey, T., Roberts, M., Barrow, P. A., Dougan, G., and Parkhill, J. (2008) Comparative genome analysis of
Salmonella Enteritidis PT4 and Salmonella Gallinarum 287/91 provides insights into evolutionary
and host adaptation pathways, Genome Res. 18, 1624-1637.
[10] Edgar, R. C. (2004) MUSCLE: multiple sequence alignment with high accuracy and high throughput,
Nucleic Acids Res. 32, 1792-1797.
[11] Crooks, G. E., Hon, G., Chandonia, J. M., and Brenner, S. E. (2004) WebLogo: A sequence logo generator, Genome Res. 14, 1188-1190.
[12] Vogl, T., Leukert, N., Barczyk, K., Strupat, K., and Roth, J. (2006) Biophysical characterization of S100A8 and S100A9 in the absence and presence of bivalent cations, Biochim. Biophys. Acta