Phenotype of autosomal dominant spastic
paraplegia linked to chromosome 2
A. Durr,
1'
2C.-S. Davoine,
3C. Paternotte,
5J. von Fellenberg,
6S. Cogilnicean,
12P. Coutinho,
7C. Lamy,
4S. Bourgeois,
3J.-F. Prud'homme,
5C. Penet,
1J.-L. Mas,
4J.-M. Burgunder,
6J. Hazan,
5J. Weissenbach,
5A. Brice
12and B. Fontaine
2311NSERM U289, the 2Federation de Neurologie, the
^INSERM U134, Hopital de la Salpetriere, the 4Service de
Neurologie, Hopital Sainte Anne, Paris, the 5Genethon and
CNRS URA 1922, Evry, France, the 6Neurologische Klinik,
Inselspital, Bern, Switzerland and the 1Servigo de
Neurologia, Hospital Geral de Santo Antonio, Porto, Portugal
Correspondence to: Dr Alexandra Durr, INSERM U289, Hopital de la Salpetriere, 47, Boulevard de VHopital, 75651 Paris Cedex 13, France
Summary
We report the clinical features of 12 families with autosomal dominant spastic paraplegia (ADSP) linked to the SPG4 locus on chromosome 2p, the major locus for this disorder that accounts for ~40% of the families. Among 93 gene carriers, 32 (34%) were unaware of symptoms but were clinically affected. Haplotype reconstruction showed that 90% of the asymptomatic gene carriers presented increased reflexes and/or extensor plantar responses independent of
age at examination. The mean age at onset was 29 years, ranging from 1 to 63 years. Intra- as well as inter-familial variability of age at onset was important, but did not result from anticipation. Phenotype-genotype correlations and comparison with SPG3 and SPG5 families indicated that despite the variability of age at onset, SPG4 is a single genetic entity but no clinical features distinguish individual SPG4 patients from those with SPG3 or SPG5 mutations. Keywords: spastic paraplegia; SPG4; linkage analysis; anticipation; genetic heterogeneity
Abbreviation: ADSP= autosomal dominant spastic paraplegia
Introduction
Spastic paraplegia, a hereditary disease first described by Striimpell (1880) in two brothers, is characterized patho-logically by degeneration of the corticospinal tracts and thinning of the columns of Goll and spinocerebellar tracts. A 'pure' form of the disease has been distinguished, but its pattern of inheritance is variable. In patients with ADSP in addition to pyramidal signs in the lower limbs, sphincter disturbances and diminished vibration sense are frequently observed (Polo et al., 1993; Durr et ai, 1994). Even in the 'pure' form, paraclinical investigations revealed asymptomatic multisystem involvement of the nervous system (Tedeschi et al., 1991; Durr et ai, 1994). Age at onset is highly variable, and Harding (1981) used this parameter in a series of 61 patients to distinguish two types of ADSP. In type I onset ranges from 20 to 40 years, in type II from 40 to 65 years. Sensory loss and urinary symptoms were more frequent in the latter. Both © Oxford University Press 1996
types may be observed in a single family (Polo et al., 1993; DUrr et al., 1994).
'Pure' ADSPs are genetically heterogeneous. There are at least three loci, designated SPG3-5. The first was assigned to chromosome 14q (SPG3) in a single French family (Hazan et al., 1993). A German and a Tunisian family were found to be linked to the same locus (Hentati et al, 1994; Gispert et al., 1995). Genetic linkage to chromosome 2p (SPG4) was demonstrated in 12 families, seven French and one Dutch (Hazan et al., 1994), three North American and one Tunisian (Hentati et al., 1994). In a North American family with ADSP, the locus was mapped to chromosome 15q (SPG5) (Fink et al., 1995ft). In this study, the clinical features of ADSP genetically linked to SPG4 were analysed in 12 families of different geographic origins to define the characteristics of this disorder, and their variability among a genetically
homo-geneous group of patients, compared with SPG3 and SPG5 kindreds.
Methods
Patients
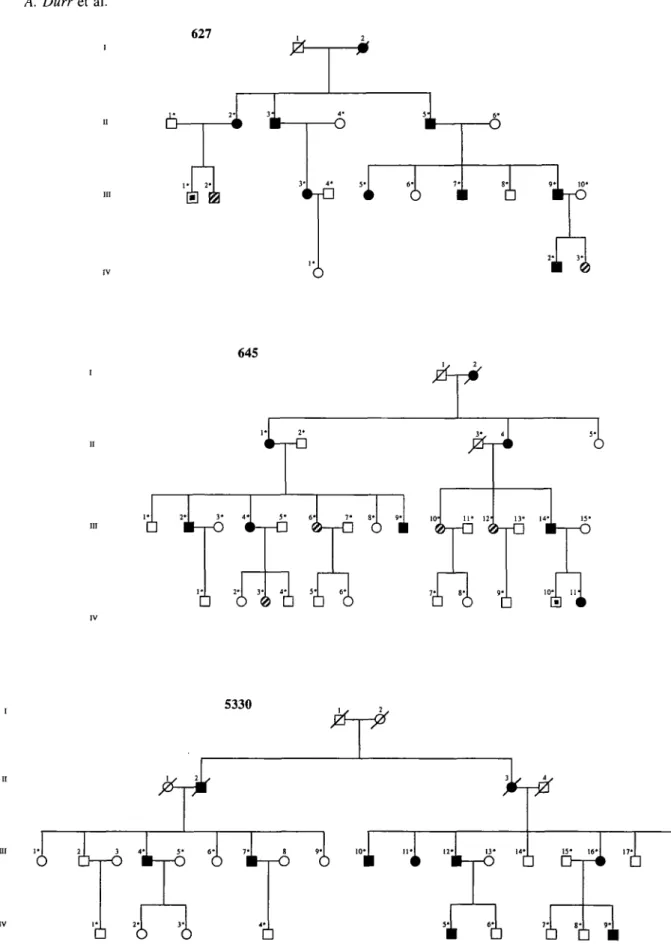
One hundred and seventy-seven individuals from 12 families with spastic paraplegia were included in this study. The kindreds are shown in Fig. 1, except the already published families: 618, 624, 625 (Fontaine et al, 1995) and family A (Hazan et al, 1993). Two published families, 627 and 645 were re-examined: the status of individuals III-1, 627-IV-1, 627-1V-3 and 645-IV-8 had changed, and a new patient 645-III-6 was added (Fig. 1). Seven families were French (618, 624, 625, 627, 645, 4014, A), three Swiss (2992, 5330, 5226), one Polish (1620) and one Portuguese (3266).
The clinical inclusion criteria for the index cases, prior to the linkage study, were the existence of progressive spastic paraplegia with pyramidal signs in the lower limbs and a pattern of segregation of the disease in the family, compatible with autosomal dominant inheritance. The patients were classified: definitely affected if they had spasticity, increased reflexes in the lower limbs and an extensor plantar response; probably affected if only increased reflexes in the lower limbs or extensor plantar response were present; possibly affected if they had brisker reflexes in the lower than in the upper limbs. Disability was assessed on a three-point scale: 1 = normal gait or very slight stiffness in the legs; 2 = unable to run, but able to walk without help; 3 = unable to walk without help or chairbound. A severity score related to disease duration was obtained by dividing the disability score by disease duration in years and multiplying by 100. Age at onset calculations included eight deceased patients at the time of the study for whom clinical data were available. Statistical significance was determined with the Yates corrected x2 test and with the Mann-Whitney U comparison.
Parent-offspring and sibship resemblance was tested by intraclass and interclass analysis.
Genetic linkage analysis
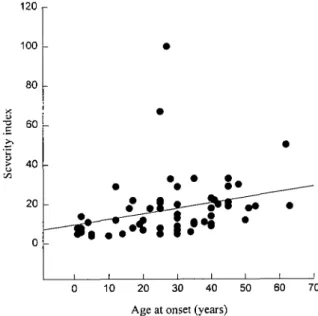
Informed consent was obtained from each family member and each control individual. Blood samples from the family members and from unrelated control individual were drawn, and genomic DNA was prepared according to standard procedures (Gusella, 1986). Polymerase chain reaction amplification and genotyping of the dinucleotide repeats were performed as described in Hazan et al. (1992). The dinucleotide repeats used in this study were D2S352, D2S400 and D2S367 (Gyapay et al, 1994). Two newly identified dinucleotide repeats D2S2347 and D2S2351 were also used (Dib et al., 1996). Both loci map within the 3 cM interval flanked by D2S352 and D2S367 (Fig. 2).
Pairwise lod-scores were calculated with the M-LINK program of the computer package LINKAGE (version 5.1)
(Lathrop et al., 1985). A frequency of 0.0001 was assumed for ADSP. To perform linkage analysis, liability classes were determined from the cumulative age at onset curve for the studied families: 0-19 years, 0.17; 20-24 years, 0.32; 25-30 years, 0.55; 31-51 years, 0.92; >51 years old, 0.99 (Fontaine et al., 1995). Equal allele frequencies were used. Recombination fractions were assumed to be equal beween men and women. For linkage analysis, definitely affected individuals were considered as affected, the status of probably and possibly affected individuals was considered to be undetermined. Genetic homogeneity was tested with the program HOMOG (Ott, 1991).
Results
Clinical examination revealed spastic paraparesis in 95 patients, including 83 with definite, 10 with probable and two with possible spastic paraplegia as defined above (Table 1).
Linkage analysis
Lod-scores for the tested markers were positive in the 12 families (Table 2). For D2S2351 and D2S2347, total peak-lod-scores were 19.16 and 21.30, respectively, for a recombination fraction of 9 = 0.00. HOMOG analysis confirmed the genetic linkage of the families to chromosome 2, with posterior probabilities of linked type ranging from 0.75 to 0.99 for D2S2351. Similar results were obtained for the other three markers (data not shown).
Genotypes of probable and possible cases
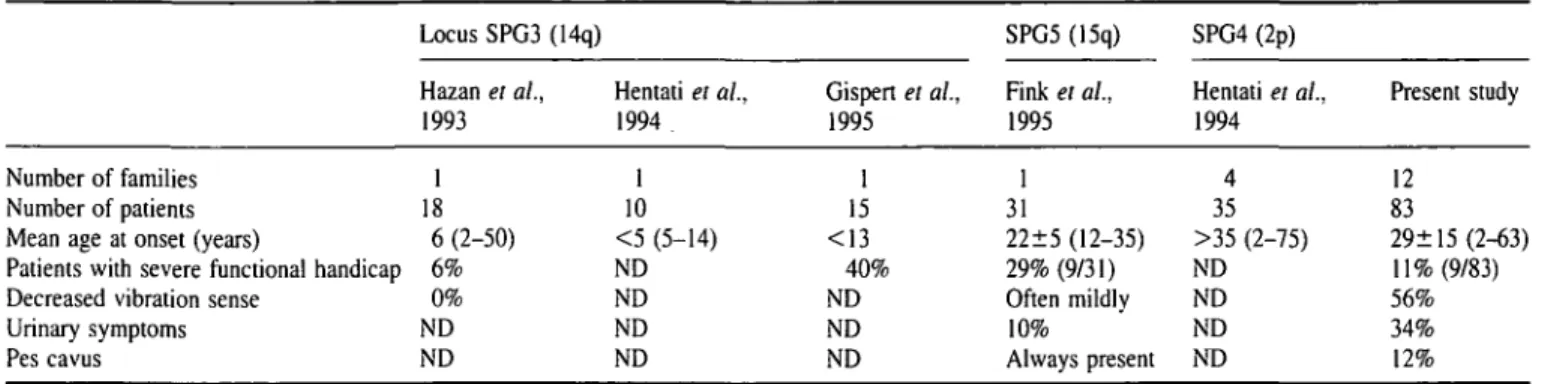
Phenotype-genotype correlations confirmed the clinical suspicion in nine out of 12 probable or possible cases (Table 3). Three probably affected patients did not carry the disease haplotype: a 54-year-old woman and a 51-year-old man, both with hyper-reflexia in the lower limbs and flexor plantar response, and a 6-year-old girl with clearly increased reflexes in the lower limbs but no extensor plantar response. No other neurological abnormalities were noticed in either patient. In another woman with a diagnosis of probable spastic paraplegia, leg spasticity began at age 26 years, but at the time of examination, at age 42 years, she had experienced relapsing episodes of motor weakness. Cerebrospinal fluid and MRI studies were suggestive of multiple sclerosis, but she, as well as the two possibly affected individuals, all carried the disease haplotype. Among the 82 at-risk individuals with normal neurological examination only one, aged 57 years, carried the disease haplotype.
Clinical analysis of 83 patients with definite
spastic paraplegia
Mean age at examination was 45 ±20 years, ranging from 3 to 85 years. Functional impairment was absent or slight in
Table 1 Twelve families with pure autosomal dominant spastic paraplegia linked to the SPG4 locus on chromosome 2p Family 618 624 625 627 645 1620 4014 A 2992 3266 5330 5226 Total
No. of patients with Definite* 10(3) 4 ( 1 ) 6(3) 8(4) 7(3) 8(1) 6(3) 7(0) 6(0) 8(4) 9(1) 4(0) 83 (23) spastic paraplegia Probable 0 1 0 2 4 0 2 1 0 0 0 0 10 Possible 0 0 0 1 1 0 0 0 0 0 0 0 2
Mean age (years) at examination (n 32 ±20 50±25 40±21 38±21 48+19 47±17 26±12 43±19 52±16 45±17 49±15 67±19 43 ±20 (3-85) = 95) at onset (« = 61) 24± 17 (17-51) 37 ±10 (25^5) 25 37 ±12 (25-53) 37 ±21 (5-63) 22 ±22 (2-62) 12±11 (1-22) 21 ±10 (4-30) 31 ±7 (20-40) 43±7 (35-50) 30±14(l-45) 33±16 (10-45) 29±15 (1-63) *Unaware of symptoms.
27% (n = 22), moderate with inability to run in 41% (n = 34) and severe in 32% (n = 27), who walked with help or were wheelchair-bound. The overall clinical picture is presented in Table 4. There was no significant clinical difference between men (n = 42) and women (n = 41), except the frequence of sphincter disturbances, more often mentioned in women (P < 0.05).
Age at onset and anticipation
The age at onset could be determined for 61 patients, 23 were unaware of symptoms but were definitely affected, and one, aged 77 years, could not remember when his symptoms first began. The mean age at onset was 29± 15 years, ranging from 1 to 63 years. In more than half of the patients, 37 out of 61, the disease started before the age of 35 years. Mean age at onset was not statistically different among families (P = 0.15), but decreased in successive generations (Table 5). Mean age at onset was significantly earlier in generation III than in generation I or II (P < 0.001), but the proportion of gene carriers, asymptomatic or unaware of their symptoms, significantly increased in successive generations (P < 0.001), reaching 100% in generation IV. In 33 parent-offspring pairs, age at onset was a mean 7 years earlier in offspring (P < 0.005); the mean age at onset in parents was 35±13 years and in their children of 28± 15 years. The differences ranged from 58 years earlier to 32 years later than the age at onset of their parents. There was a positive correlation between age at onset of parents and anticipation (r = 0.57, P < 0.001). This suggested an observation bias, since the likelihood of observing an earlier age at onset in children is greater when the parent is older (Fig. 3); however, among the 33 parent-child pairs, 20 showed anticipation and 12 anti-anticipation and in one, the age at onset was the same in the parent and the child. This distribution was not significantly different from the null hypothesis that half of the offspring had an earlier and half a later onset than the parent (P = 0.22).
Clinical signs according to age at onset and
disease duration
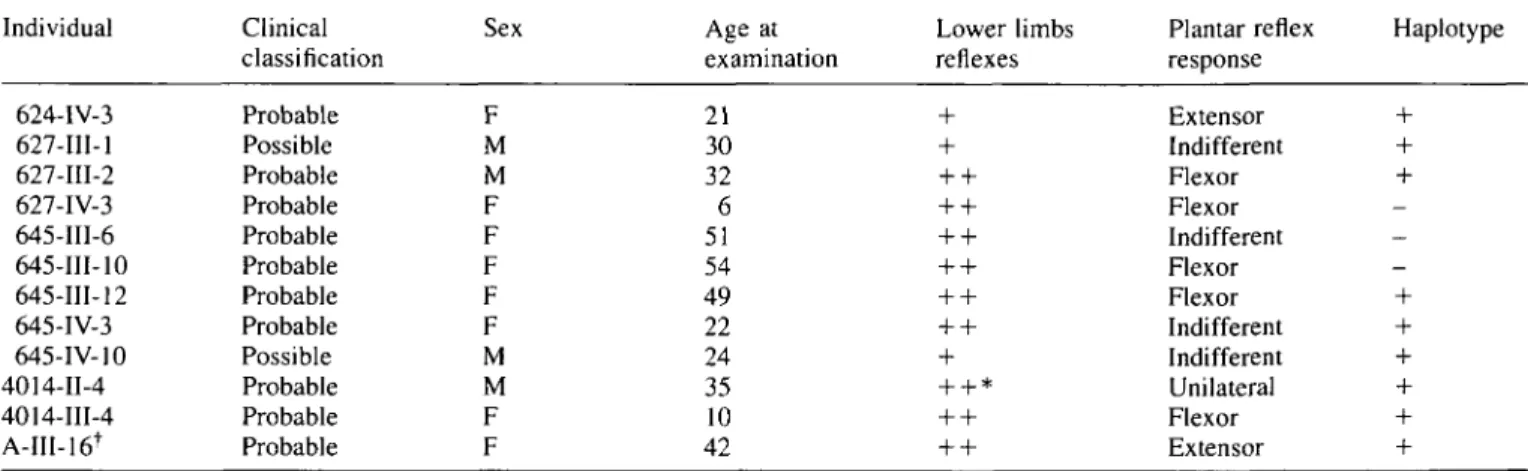
In accordance with Harding's classification (1981), we divided the patients in two groups, with onset before and after age 35 years. There was no significant difference in the frequency of the clinical signs associated with spastic paraplegia or in the severity of the disease. Disease duration, as expected, influenced the clinical picture. Spasticity and muscle weakness were more severe in advanced stages of the disease. The frequency of urinary urgency and decreased vibration sense increased with the duration of the disease. In contrast, hyper-reflexia in the upper limbs did not increase with evolution. To evaluate differences in the clinical course according to the age at onset, a severity index was calculated for each individual. The correlation between the age at onset and the severity index was significant (r = 0.26, P = 0.035). The older the onset the more severe the course of the disease, but this correlation is not individual (Fig. 4).
Phenotype-genotype correlations
Comparison between these 12 SPG4 families and 4 SPG4 kindreds reported in the literature (Hentati et al., 1994) confirmed the wide variability of age at onset, ranging from 1 to 75 years, but no other clinical information was available for comparison (Table 6). Three SPG3 kindreds had an earlier mean age at onset but the range was still large (2-50 years) (Hazan et al., 1993; Hentati etai, 1994; Gispert et al., 1995). The course of the disease was reported to be more benign in one family (Hazan et al, 1993), but 40% of the patients needed help walking in the other (Gispert et al., 1995). The single SPG5 family was unusual in that age at onset was less variable, ranging from 12 to 35 years, and all patients had pes cavus. As in SPG4 kindreds, vibration sense was often decreased (percentage was not indicated) (Fink et al., 1995a).
627
6-s
-o
6
I
• o 8- ?• 10* • B-rO•i
645tfi
I* 2* 3 ' 4* 5* 6'D O 0 D D 0
1
1 "La •
T 8* 9- 10* 11 • O D H < 5330i
l l 3 4*1 5- 6-I 7-| 8 »•[ 1 Ol L " ' 1 1 2J _ l3' 14> 15' 1 6' 1 " J _ 18'1• 6 6
ii il
\
Fig. 1 Pedigrees of families with autosomal dominant spastic paraplegia linked to SPG4. Definitely affected individuals are represented by filled symbols, probably affected ones by hatched symbols and possibly affected ones by small black symbols. Asterisks indicate examined and sampled individuals.
1620
• 6
•i i
Ui
3266o
1
o
111 1- 2' 29925M> i i
ft I
5226i i i
4014 ID , .6
3-14-2pter SPG4 1 cM 3cM D2S400 D2S352 D2S2351 D2S2347 • D2S367 2pcen
Fig. 2 Abriged map of the chromosome 2p interval containing the SPG4 locus.
20 30 40 50 60 Parent's age at onset (years)
70
Fig. 3 Correlation between anticipation and the parent's age at onset. The positive correlation suggests an observation bias since the likelihood of observing an earlier age at onset in children is greater the later the parent's age at onset.
Discussion
Families with ADSP were screened for genetic linkage to chromosome 2p (SPG4). Approximately 40% of the tested families showed linkage to SPG4, establishing SPG4 as a major locus for ADSP. We report 12 ADSP families linked to chromosome 2p (SPG4) with 83 definitely affected individuals. This represents the largest series of genetically homogeneous ADSP which enabled us to analyse, in detail, the clinical characteristics of the disorder. Haplotype reconstruction confirmed that the SPG4 gene was located in the interval flanked by D2S400 and D2S367 (Hazan et al, 1994). Haplotype reconstruction also confirmed the genetic status of the 12 probably or possibly affected individuals, nine of whom carried the haplotype segregating with the disease. This indicates that the disease may be suspected in at-risk individuals on clinical grounds, before they become aware of symptoms. For example, only increased and spread reflexes were present in a 10-year-old girl and a 54-year-old women, both gene carriers. However, three other individuals
100 80 60 40 20 0 • • -• • • • -*•%-*——iV>r^ • • • • 1 I 1 1 1 I 1 10 20 30 40 50 60 70
Age at onset (years)
Fig. 4 Correlation between the severity index, defined as the disability score divided by disease duration in years and multiplied by 100, and the age at onset in ADSP patients.
with increased reflexes were not gene carriers. Conversely, a 57-year-old man with a normal neurological examination turned out to be a gene carrier. Despite some exceptions, this study demonstrates the presence and the high specificity of neurological abnormalities in asymptomatic gene carriers, that should be taken into account in genetics studies or counselling.
Adult onset was observed in most patients but intrafamilial variability, and particularly its range (1-63 years), was considerable, as already reported in 'pure' ADSP (Harding, 1981; Polo et al., 1993; Diirr et al., 1994). These figures do not reflect the whole population of patients, however, since onset could only be assessed in 61 out of 93 gene carriers (66%). The others, with age at examination ranging from 3 to 74 years, were either unaware of their symptoms or completely asymptomatic. Over one-third of gene carriers are therefore unaware of their status.
Is the variability in age at onset due to anticipation? Although the differences in age at onset between generation I or II and III, and in parent-offspring pairs, suggest anticipation, it is only apparent, and results from an observation bias. There are several reasons for this: (i) no age at onset can be attributed to one-third of the gene carriers, especially in the youngest generations, who may become symptomatic later than their parent; (ii) awareness of the disease in families can result in diagnosis at an earlier age; (iii) anticipation is strongly correlated with the age at examination of the transmitting parent, with a tendency for regression to the mean; (iv) the distribution of parent-child pairs in which onset in the child is earlier or later than the parent is not significantly different from the null hypothesis which postulates absence of anticipation.
The presence of true anticipation would facilitate identification of the SPG4 gene, by analogy with the five
Table 2 Pairwise lod-scores with four chromosome 2p markers in 12 families with autosomal dominant spastic paraplegia Familj Locus 618 624 625 627 645 1620 2992 3266 5226 5330 4014 A Total Locus 618 624 625 627 645 1620 2992 3266 5226 5330 4014 A Total Locus 618 624 625 627 645 1620 2992 3266 5226 5330 4014 A Total Locus 618 624 625 627 645 1620 2992 3266 5226 5330 4014 A Total i Recombination 0.00 D2S352 2.42 0.74 2.38 1.35 No information 1.21 1.99 2.73 0.64 No information 1.02 0.19 14.67 D2S2351 2.31 No information 1.13 1.93 2.13 1.55 3.44 2.01 1.63 1.72 0.66 0.65 19.16 D2S2347 1.18 0.27 2.38 1.14 0.45 2.17 3.19 2.39 1.78 3.69 0.89 2.22 21.75 D2S367 3.56 1.33 -3.89 1.37 2.03 2.18 2.14 2.21 -3.89 0.85 0.53 2.63 11.05 fraction 0.01 2.38 0.72 2.33 1.36 1.18 1.96 2.68 0.61 1.00 0.19 14.41 2.27 1.10 1.89 2.09 1.52 3.38 1.96 1.60 1.69 0.65 0.64 18.79 1.16 0.26 2.33 1.12 0.44 2.13 3.13 2.35 1.75 3.62 0.87 2.17 21.33 3.50 1.30 -0.22 1.39 1.99 2.14 2.10 2.16 -0.24 0.84 0.52 2.58 18.06 0.05 2.20 0.64 2.15 1.36 1.06 1.82 2.47 0.52 0.92 0.17 13.31 2.09 1.00 1.74 1.93 1.38 3.13 1.78 1.46 1.57 0.59 0.58 17.25 .06 0.23 2.15 1.03 0.39 .95 2.90 2.15 .60 3.37 0.80 .98 19.61 3.25 1.19 0.36 1.38 1.86 1.96 1.94 1.96 0.36 0.78 0.48 2.41 17.93 0.10 1.96 0.54 1.92 1.28 0.91 1.63 2.19 0.43 0.81 0.15 11.82 1.85 0.86 1.55 1.73 1.21 2.81 1.55 1.28 1.43 0.51 0.51 15.29 0.93 0.19 .92 0.92 0.34 1.73 2.60 .90 1.42 3.03 0.71 1.73 17.42 2.92 .04 0.49 1.30 1.68 1.73 1.72 1.71 0.52 0.71 0.43 2.18 16.43 0.20 1.45 0.34 1.41 1.01 0.61 1.21 1.61 0.28 0.60 0.11 8.63 1.34 0.58 1.15 1.28 0.85 2.11 1.08 0.90 1.09 0.36 0.39 11.13 0.65 0.12 1.41 0.67 0.22 1.25 1.96 1.36 1.02 2.31 0.53 1.19 12.69 2.21 0.74 0.45 1.02 1.26 1.26 1.25 1.18 0.51 0.53 0.32 1.67 12.40 0.30 0.88 0.17 0.87 0.64 0.32 0.73 0.97 0.15 0.39 0.06 5.18 0.79 0.29 0.72 0.78 0.51 1.33 0.62 0.50 0.66 0.22 0.28 6.70 0.35 0.06 0.87 0.40 0.12 0.75 1.23 0.78 0.58 1.51 0.35 0.63 7.63 1.42 0.45 0.27 0.65 0.78 0.77 0.74 0.65 0.35 0.34 0.21 1.10 7.73 0.40 0.30 0.05 0.32 0.24 0.09 0.23 0.34 0.05 0.19 0.02 1.83 0.27 0.07 0.28 0.28 0.21 0.47 0.23 0.14 0.23 0.10 0.15 2.43 0.10 0.01 0.32 0.13 0.05 0.30 0.44 0.25 0.17 0.64 0.18 0.13 2.72 0.59 0.20 0.08 0.25 0.28 0.32 0.23 0.21 0.13 0.15 0.10 0.49 3.03 #max 0.00 0.00 0.00 0.02 0.00 0.00 0.00 0.00 0.00 0.00 0.00 0.00 0.00 0.00 0.00 0.00 0.00 0.00 0.00 0.00 0.00 0.00 0.00 0.00 0.00 0.00 0.00 0.00 0.00 0.00 0.00 0.00 0.00 0.00 0.00 0.00 0.00 0.00 0.13 0.02 0.00 0.00 0.00 0.00 0.14 0.00 0.00 0.00 0.02 Smax 2.42 0.74 2.38 1.37 1.21 1.99 2.73 0.64 1.02 0.19 14.67 2.31 1.13 1.93 2.13 1.55 3.44 2.01 1.63 1.72 0.66 0.65 19.16 1.18 0.27 2.38 1.14 0.45 2.17 3.19 2.39 1.78 3.69 0.89 2.22 21.75 3.56 1.33 0.50 1.39 2.03 2.18 2.14 2.21 0.55 0.85 0.53 2.63 18.27
Table 3 Phenotype-genotype correlations in probably and possibly affected individuals with spastic paraplegia
Sex Age at Lower limbs Plantar reflex Haplotype Individual Clinical classification Age at examination Lower limbs reflexes Plantar reflex response 624-IV-3 627-III-1 627-III-2 627-IV-3 645-III-6 645-111-10 645-111-12 645-IV-3 645-IV-lO 4014-II-4 4014-III-4 A-III-16^ Probable Possible Probable Probable Probable Probable Probable Probable Possible Probable Probable Probable F M M F F F F F M M F F 21 30 32 6 51 54 49 22 24 35 10 42 + + * Extensor Indifferent Flexor Flexor Indifferent Flexor Flexor Indifferent Indifferent Unilateral Flexor Extensor
+ = normal, + + = increased reflexes. *Unilateral hyper-reflexia; tspastic paraplegia at the age of 26 years followed at 42 years by
relapsing episodes of motor weakness, then sphincter disturbances; oligoclonal gammaglobulin bounds in CSF and MRI lesions supporting the diagnosis of multiple sclerosis were seen.
Table 4 Clinical picture in 83 patients with definite spastic paraplegia linked to SPG4 on chromosome 2p
other neurodegenerative disorders with anticipation in which the expansion of a translated CAG repeat has been demonstrated (Sutherland and Richards, 1995). Even in these disorders, however, anticipation calculated among generations or in parent-offspring pairs is overestimated due to an observation bias (Diirr et al., 1996). Therefore, although the hypothesis of a CAG repeat expansion as the molecular basis of SPG4 is not supported by our data, it cannot be ruled out. Allelic heterogeneity at the SPG4 locus can also be excluded as the source of variability in age at onset, since variance within and among families is similar.
The SPG4 kindreds studied here do not conform to the classification of ADSP into two types according to age at onset, as proposed by Harding (1981). First, both type I and II patients were found in most SPG4 families making their classification impossible. Secondly, the frequency of associated signs, such as decreased vibration sense or urinary symptoms, did not vary as a function of age at onset. Thirdly, disease progression, variable and slightly more severe in late onset patients cannot be used to predict the progression of the disease.
The comparison of the phenotypes of SPG4 patients with published SPG3 and SPG5 patients (Hazan et al., 1993; Hentati et al., 1994; Gispert et al., 1995; Fink et al., 1995a) has brought certain differences to light. Although the number of SPG3 and SPG5 patients is too small for reliable genotype-Table 5 Difference between age at examination and age at onset in different generations of gene
carriers
Number of families Number of patients
Mean age at examination (years) Mean age at onset (years)
Number of affected individuals unaware of symptoms
Functional handicap Normal or slight Cannot run
Walk with help or wheelchairbound Spasticity in the lower limbs
None Mild Moderate Severe
Hyper-reflexia in the upper limbs Extensor plantar reflexes
Proximal or generalized weakness in the lower limbs
Impaired vibration sense Urinary urgency or incontinence Pes cavus Dysarthria Supranuclear ophthalmoplegia Mental retardation 12 83 45 ±20 (3-85) 29±15 (1-63) 23 27% 41% 32% 23% 21% 31% 25% 22% 86% 53% 56% 34% 12% 4% 2% 2%
Generations Mean age at examination* (years)
Mean age at onset** (range) (years) % unaware of their status" II III IV 72±11 (« = 10) 56±8 (n = 36) 31 ±6 (n = 38) 10±5 (n = 8) 33±21 (10-63)n = 8 35±13 (2-53) n = 31 19±11 (1-35) n = 22 10 19 42 100
Table 6 Phenotype-genotype correlations in ADSP families
Number of families Number of patients Mean age at onset (years)
Patients with severe functional handicap Decreased vibration sense
Urinary symptoms Pes cavus Locus SPG3 (14q) Hazan et al., 1993 1 18 6 (2-50) 6% 0% ND ND Hentati et al.. 1994 1 10 <5 (5-14) ND ND ND ND Gispert et al., 1995 1 15 <13 40% ND ND ND SPG5 (15q) Fink et al.. 1995 1 31 22 ±5 (12-35) 29% (9/31) Often mildlv 10% Always present SPG4 (2p) Hentati et al.. 1994 4 35 >35 (2-75) ND ND ND ND Present study 12 83 29±15 (2-63) 11% (9/83) 56% 34% 12%
phenotype correlations, the mean age at onset was clearly earlier in the SPG3 than in the SPG4 or SPG5 groups, adult onset was still found in one out of the 18 SPG3 patients (Hazan et al, 1993). True anticipation was not apparent in SPG4 and SPG5 families. However, in one SPG3 kindred the severity increased from one generation to the next (Hazan et al., 1993). Decreased vibration sense and urinary symptoms were common in SPG4 and SPG5, but absent in SPG3 patients. On the contrary, pes cavus found in all SPG5 patients is rarely observed in those with SPG4. In spite of these differences, the variability in age at onset and clinical presentation of SPG4 patients prevent the application of phenotype-genotype correlation to single affected individuals.
In conclusion, the major locus for ADSP, SPG4 on chromosome 2, is characterized by a marked intrafamilial variability of age at onset and severity. This variability does not result from anticipation or allelic heterogeneity but could be due to other genetic or environmental factors. Careful clinical evaluation of at risk family members can identify most presymptomatic carriers, but accurate diagnosis can only be obtained by haplotype reconstruction. The high frequency of gene carriers unaware of their status is particularly important for genetic counselling.
Acknowledgements
We wish to thank the families for participating in this study. We also wish to thank Professors Olivier Lyon-Caen and Pascal Brunet, Drs Michel Serdaru and Catherine Allaire and the Association Striimpell-Lorrain for referring index cases, Christiane Penet, Yolaine Pothin, Claire Ponthieux and Jacqueline Bou for technical assistance and Dr Merle Ruberg and Professor Yves Agid for critical reading of the manuscript. The study was supported by the Association Francaise contre les Myopathies, the Groupement de Recherches et d'Etudes sur les Genomes and the Assistance Publique-Hopitaux de Paris.
References
Dib C, Faure S, Fizames C, Samson D, Drouot N, Vignal A, et al. A comprehensive genetic map of the human genome based on 5264 microsatellites. Nature 1996; 380: 152-4.
Diirr A, Brice A, Serdaru M, Rancurel G, Derouesne C, Lyon-Caen O, et al. The phenotype of 'pure' autosomal dominant spastic paraplegia. Neurology 1994; 44: 1274—7.
Diirr A, Stevanin G, Cancel G, Duyckaerts C, Abbas N, Didierjean O, et al. Spinocerebellar ataxia 3 and Machado-Joseph disease: clinical, molecular and neuropathological features. Ann Neurol
1996; 39: 490-9.
Fink JK, Sharp GB, Lange BM, Wu C-B, Haley T, Otterud B, et al. Autosomal dominant, familial spastic paraplegia, type I: clinical and genetic analysis of a large North American family. Neurology 1995a; 45: 325-31.
Fink JK, Wu C-B, Jones SM, Sharp GB, Lange BM, Lesicki A, et al. Autosomal dominant familial spastic paraplegia: tight linkage to chromosome 15q. Am J Hum Genet 1995b; 56: 188-92. Fontaine B, Rime C-S, Hazan J, Diirr A, Stevanin G, Penet C, et al. Exclusion of the candidate locus FSP1 in six families with late-onset autosomal dominant spastic paraplegia. Neuromuscul Disord 1995; 5: 11-17
Gispert S, Santos N, Damen R, Voit T, Schulz J, Klockgether T, et al. Autosomal dominant familial spastic paraplegia: reduction of the FSPI candidate region on chromosome 14q to 7cM and locus heterogeneity. Am J Hum Genet 1995; 56: 183-7.
Gusella JF. DNA polymorphism and human disease. [Review]. Annu Rev Biochem 1986; 55: 831-54.
Gyapay G, Morissette J, Vignal A, Dib C, Fizames C, Millasseau P, et al. The 1993-94 Genethon human genetic linkage map [see comments]. Nat Genet 1994; 7 (2 Spec No): 246-339. Comment in: Nat Genet 1994; 7 (2 Spec No): 219.
Harding AE. Hereditary 'pure' spastic paraplegia: a clinical and genetic study of 22 families. J Neurol Neurosurg Psychiatry 1981; 44: 871-83.
Hazan J, Dubay C, Pankowiak M-P, Becuwe N, Weissenbach J. A genetic linkage map of the human chromosome 20 composed entirely of microsatellite markers. Genomics 1992; 12: 183-9. Hazan J, Lamy C, Melki J, Munnich A, de Recondo J, Weissenbach J. Autosomal dominant familial spastic paraplegia is genetically heterogeneous and one locus maps to chromosome 14q. Nat Genet
1993; 5: 163-7.
Hazan J, Fontaine B, Bruyn RP, Lamy C, van Deutekom JC, Rime C-S, et al. Linkage of a new locus for autosomal dominant familial
spastic paraplegia to chromosome 2p. Hum Mol Genet 1994; 3: 1569-73.
Hentati A, Pericak-Vance MA, Lennon F, Wasserman B, Hentati F, Juneja T, et al. Linkage of a locus for autosomal dominant familial spastic paraplegia to chromosome 2p markers. Hum Mol Genet 1994; 3: 1867-71.
Lathrop GM, Lalouel JM, Julier C, Ott J. Multilocus linkage analysis in humans: detection of linkage and estimation of recombination. Am J Hum Genet 1985; 37: 482-98.
Ott J. Analysis of human genetic linkage. Baltimore: Johns Hopkins University Press, 1991.
spastic paraplegia: a study of nine families. J Neurol Neurosurg Psychiatry 1993; 56: 175-81.
Sutherland GR, Richards RI. Simple tandem DNA repeats and human genetic disease. [Review]. Proc Natl Acad Sci USA 1995; 92: 3636-41.
Striimpell A. Beitrage zur Pathologie des Riickenmarks. Arch Psychiat Nervenkrankh 1880; 10: 676-717.
Tedeschi G, Allocca S, Di Costanzo A, Carlomagno S, Merla F, Petretta V, et al. Multisystem involvement of the central nervous system in StriimpeH's disease. J Neurol Sci 1991; 103: 55-60. Polo JM, Calleja J, Combarros O, Berciano J. Hereditary 'pure' Received March 5, 1996. Accepted April 26, 1996