Publisher’s version / Version de l'éditeur:
Bulletin of the Seismological Society of America, 50, 4, pp. 537-552, 1960-11-01
READ THESE TERMS AND CONDITIONS CAREFULLY BEFORE USING THIS WEBSITE.
https://nrc-publications.canada.ca/eng/copyright
Vous avez des questions? Nous pouvons vous aider. Pour communiquer directement avec un auteur, consultez la
première page de la revue dans laquelle son article a été publié afin de trouver ses coordonnées. Si vous n’arrivez pas à les repérer, communiquez avec nous à [email protected].
Questions? Contact the NRC Publications Archive team at
[email protected]. If you wish to email the authors directly, please see the first page of the publication for their contact information.
NRC Publications Archive
Archives des publications du CNRC
This publication could be one of several versions: author’s original, accepted manuscript or the publisher’s version. / La version de cette publication peut être l’une des suivantes : la version prépublication de l’auteur, la version acceptée du manuscrit ou la version de l’éditeur.
Access and use of this website and the material on it are subject to the Terms and Conditions set forth at
Effect of stiffness taper in aseismic design
Bycroft, G. N.
https://publications-cnrc.canada.ca/fra/droits
L’accès à ce site Web et l’utilisation de son contenu sont assujettis aux conditions présentées dans le site LISEZ CES CONDITIONS ATTENTIVEMENT AVANT D’UTILISER CE SITE WEB.
NRC Publications Record / Notice d'Archives des publications de CNRC:
https://nrc-publications.canada.ca/eng/view/object/?id=de900776-3d51-478c-81a6-3d0f2dcb3758 https://publications-cnrc.canada.ca/fra/voir/objet/?id=de900776-3d51-478c-81a6-3d0f2dcb3758
I Ser
T
H1
N21r2 I no. 113 c. 2 BUILDIbIG RESEARCH-
E B R A R Y
-
1
NATIONAL
RESEARCH
COUNCIL
C A N A D A
DIVISION O F BUILDING RESEARCH
EFFECT OF STIFFNESS TAPER IN ASElSMlC DESIGN
BY G. N. BYCROFT R E P R I N T E D F R O M B U L L E T I N O F T H E S E I S M O L O G I C A L S O C I E T Y O F A M E R I C A V O L . 5 0 , NO. 4. O C T O B E R 1960, P. 537 - 552 R E S E A R C H P A P E R N O . 113 O F T H E
DIVISION O F BUILDING RESEARCH
OTTAWA NOVEMBER 1960
This p u b l i c a t i o n i s being d i s t r i b u t e d by t h e D i v i s i o n o f Building Research of t h e Natiomnal Research Council a s a c o n t r i b u t i o n towards b e t t e r b u i l d i n g i n Canada. I t s h o d d not be reproduced i n whole o r i n p a r t 9 w i t h o u t p e d s s i o n o f t h e o r i - g i n a l p u b l i s h e r . The D i v i s i o n would be glad t o be of a s s i s t a n c e i n o b t a i n i n g such p H n i s s i o n ,
F u b l i c a t i o n s of t h e D i v i s i o n of B u l l d i n g Research may be obtained by m a i l i n g t h e a p p r o p r f a t e r e m i t t a n c e , ( a Dank, Express, o r Post Office Money Order o r a cheque made payable a t par i n Ottawa, t o t h e Recsiver General of Canada, c r e d i t N a t i o n a l Research Council) t o t h e N a t i o ~ l a l Research Council,
Ottawa. Stamps a r e not a c c e p t a b l e ,
A coupon system has been rir~troduced L a
make payments f o r p u b l i c a t i o n s r e l a t i v e l y sjmpla, Coupons a r e a v a i l a b l e i n denominations of
5,
25,and 50 c e n t s , and may be obtained by making a re-
m i t t a n c e a s i n d i c a t e d above, These coupons nay be used f o r t h e purchase of a l l N a t i o n a l Research C o u n c i l p u b l i c a t i o n s i n c l u d i n g s p e c i f i c a t f o n s o f t h e Canadian GovernmentSpecif i c a t i o n s Board,
Bulletin of the Seismological Society of America. Vol. 50, No. 4, pp. 537-552. October, 1960
EFFECT OF STIFFNESS TAPER I N ASEISMIC DESIGN
ABSTRACT
An investigation is nlade of the effect of changing the stiffness distribution up the height of a linear shear framed structure when subjected to idealized earthquake motions. The mean value of the largest strrrins arising in successive earthquakes is determined together with the asso- ciated probability distribution. I t appcars that the chances of finding a strain value greater than twice the mean arc very snlall.
FRAMED structures subjected to horizoiltal ground motions deform mainly by bending of the vertical columns producing horizontal translation of the floors and hence a shearing deformation of the structure. In a pinjointed frame the shear forces come from direct tension and compression of the cross-ties. The vibration of the structure is compounded of the individual vibrations of the modes of oscillation of the structure and is a function of the ground motion, the mass and stiffness distributions up the structure and the damping ratios of the modes.
This investigation is concerned with examining the effect of changing the shear stiffness up the height of the structure.
Various assumptions have been made. The mass distribution up the structure has been taken as constant. This is approximately true for a number of structures. The damping ratios of the modes of oscillation of the structure have been made equal to conform with what little is known about structural damping. I n another paper' the author suggested that large earthquake ground acceleratioi~s be repre- sented by finite bursts of "white noise". This is the type of representation considered here. Initially, for the purposes of a little analysis, the mass and stiffness distribu- tion are taken as continuous up the structure and the stiffness variation assumed is linear with respect to height.
I = height of structure
.x = distance from top of the structure to some point down its height.
y = horizontal displacement of this point from its equilibrium position relative to the base
A = mass per unit height of the structure ko = shear stiffness a t the top
/co(l
+
p x / l ) = shear stiffness a t a distance n: from the top and is the assumed variation of stiffness.Each value of the parameter p determines a particular family of structures.
1 yo = displacemei~t of the ground in space.
1 Manuscript received for publication March 11, 1960.
This is a contribution from the Division of Building Research, National Research Coun- cil of Canada and is published with the approval of t h e Ilirector of the Divisiori.
1 "White noise representation of earthquakes", G. N. Bycroft, Proc. A.S.C.E., 86 (EM-2):
1-16 (1960).
538 BULLETIN O F THE SEISMOLOGICAL SOCIETY O F S M E R I C t l
The equation of motioil of this system follo~vs simply as,
If we substitute X/gko = a2, ( 1
+
px/l) = X , y+
yo = Y , thenA Laplace transfornlation of this expression with respect t o time gives,
where
P
is the transform of Y in the trailsfornl variable p.Substitute x = and
This is the zero order Bessel equation and the solution is,
The relevant boundary coi~ditions are that when n: = 1, 2~ = 0, i.e.,
f
= g o . At.the top the shear force is zero, i.e., when 1: = 0,
The transformed displacemeilt is now
2 alip 2 alip 2 alip 2 alip
io
[ J l ( - a ) ~ o ( - p - dl p:r/l)- Y I ( _ ) J O (p
=2 alip 2 alip
$
(_)
yo( 2 2 ~
P-
Yl(-)
P J O Pm)]
where
go
has been replaced by i.e. the traasform of the base acceleration. The roots of the denominator of this expressioil give the eigenvalues of trhe sys- tem. These roots, p,,,
are imaginary and ip, is red. If p, is a root, then so is -p,,.
This may be shown by usingSTIFFNESS TAPER I N ASEISMIC DESIGN 539
and
~ , ( z i " " ) = i - 2 m P ~ p ( ~ )
+
2i sin ( m p r ) ctg ( p r ) J , ( z ) (8) and taking the appropriate values of p, ?n, and the limits.Equation ( 6 ) is inverted by a combination of the inversion and convolutioil theorems.
The residue from the double pole p = 0 is zero. The residues from the poles =tip, are found by differentiation of t,he denominator and iiltroduction of the poles. The function really wanted is not the displacement Y but the strain,
c'
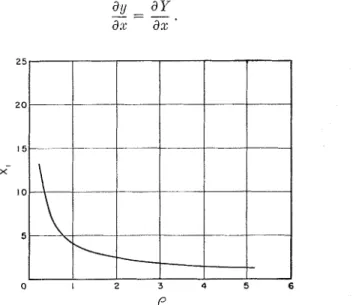
Fig. 1. \T:~ri:~tion o f Furidamental Frequency F : ~ c t o r XI, with Pnrarneter p .
After the necessary reduction this follows, as, p[.J1(Xn) Y L ( x , , ~ ~
+
pn:/l)-
Y l ( ~ . ) J 1 ( X . d l+
~ x / l ) l/'
V O ( T ) sin p n f ( t-
7 ) d r all -2
0 ( 9 )-
- ax ?,=I (1+
pm/l)1'21pnf [ J o ( X , , ) Y o ( ~ , d I $ - p )-
Y O ( X , ) Jo(XnV'1+
P )-
d
I
{A
(x,,)
Y ~ ( x , , ~ I )-
yY1(xn) J ~ ( x , , ~ F P )) I
where p,,' = ip,, and X,, = 2alpnf/p and is a function solely of p. The relation ofX 1 and p is shown in fig. 1. When X,, is large, as for the higher harmonics, the
Bessel functions in the characteristic equation may be replaced by their asymptotic values and then,
540 B U L L E T I N O F T H E SEIS&IOLOGICdL SOCIETY O F -4MERIC.4
Equation ( 9 ) is the summation of the responses of the various modes of the sys- tem. The ground motion occurs only in the factor
4
l t u o ( T ) sin p,,t(t - 7 ) d7P n
and the maximum value of this expression is the "displacement spectrum" of the earthquake. If the nth mode of vibration is damped by a factor q, of critical clamp- ing then the above undamped spectrunl is replaced by the damped one,
2
lt
g o ( T ) e - ( ~ r , ~ , , f ( l - r ) sin p,,'(t - 7 ) d7The coefficients in front of the integrals give the "participation factors" of the modes. Equation ( 9 ) could be used to calculate the strains arisingfor any particular earthquake acceleratioll y o ( t ) .
This would be extremely tedious and not espccially profitable unless carried out for a large number of earthquakes. The alternative, discussed in reference I , is to regard earthquakes as bursts of random accelerations of constant spectral density, i.e. "white". A suitable measure of the relative size of the vibration up the structure is the r.m.s. value and this may be obtained from known properties of random vibrations. The following analysis determines the r.m.s. value of the strain when y o ( t ) is a continuous white noise acceleration of spectral density X o .
If g o ( t ) is replaced by e i t U t in equation (9) the conlplex frequency response of the strain follows as
where
The root mean square strain is given by
If the common mode damping ratio q is not large and the frequencies of the modes are reasonably separated, as is the case here, the cross terms arising in I H ( w ) I 2 nlsy be neglected. A contour integration then determines the ~ ~ o o t , mean square strain as,
STIFFNESS TAPER I N ASEISMIC DESIGN 541 If we wish to compare the r.m.s. strains in structures having the same distributed illass and the same base stiffness but different stiffness taper p then ecluation ( 1 3 )
may be written as
~vhere K = lco(l
+
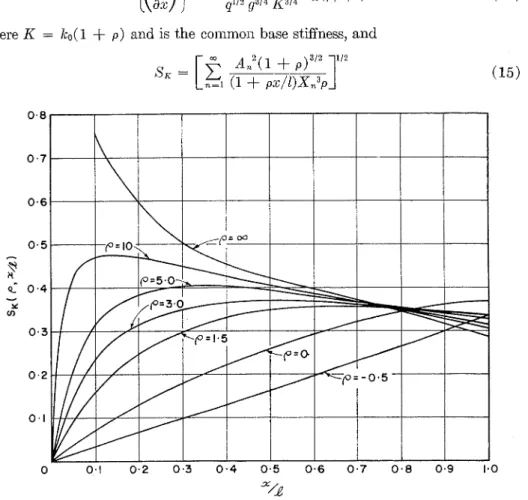
p) and is the coillmoil base stiffness, andFig. 2. Str:lirl l'nctor S K ( p , .c/l).
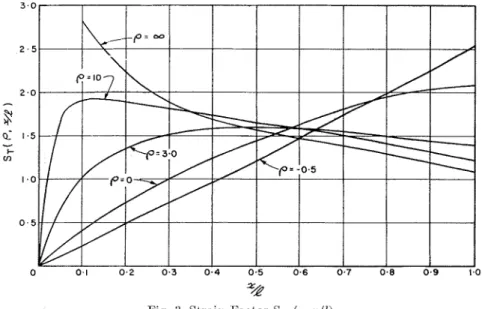
If we wish to compare structures having the same mass distribution and same fundamental period T1 then ecluation ( 1 3 ) is written as
where
These two functions have been calculated and are shown in figures 2 and 3. As ~vould be expected a uniform structure, given by p = 0, suffers the greatest strain
542 I3ULLETIS O F THE SEIS3IOLOGICAL SOCIETY 01" AhIERICA
a t the base. As the stiflness is tapered off, inore strain is thrown on t o the upper regions of the structure. For a con~pletely tapered structure given by p = co a whipping effect occurs a t the top aiid the strain here becon~es unbounded. Fig. 2 shows that structures having the same nlass and base stiffness experience approxi- mately the same base strain no matter how the stiffness tapers off. Further, the variation of strain up the structure is not critically dependent 011 the parameter p
except towards the top. The value p = 3.0 gives approximately equal strain over
most of the height.
2
Fig. 3. S t r : ~ i ~ l Factor S T ( p , . ~ . / l ) .
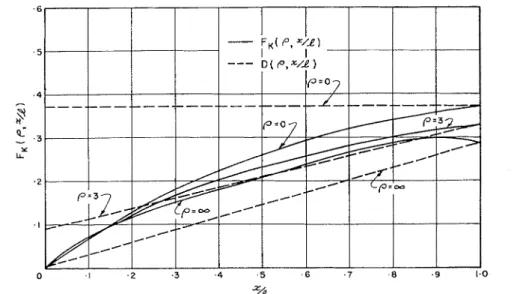
Of interest is the variation of the r.nl.s. shear force up the structure. For struc- tures ~vit,h a common base stiffness this is given by
The non-climensional r.1n.s. shear force inay then be definecl as E', 1 ( l + p d L )
X / l )
(1
+
P )This factor is sho~vn in fig. 4 and i t is seen that changilig the stiffness taper up the structure over the full range of p = 0 to p = co does not have a great effect on the shear forces arising.
A suitable design will depend on what permissible strains are allowed in the structure and on the relation of strength of the structure to the shear forces arising. The former criterion depends largely on the permissible deformation that the structure's cladding 1611 stand without damage and 1611 largely be a constant value up the height of the structure. The latter criterion depends on the relation of the
STIFFNESS TAPEIZ I N ASEISMIC DESIGN 543
stiffness a t any height to the strength there. This depends on the type of construc- tion. I n a pin-jointed structure with the same geometrical configuration of ties u p its height the strength will be proportional t o the stiffness. If the strength is denoted by D and the base strength by
DL,
then,This has been plotted as the dashed lines in fig. 4 where the base strength has been made equal to the base shear force arising. I n this situation a uniform structure
p = 0 is very much overdesigned and a completely tapered structure p = w is
%
Fig. 4. Shear Force Factor Pli ( P , r / l ) and Strength D ( P , x/L).
underdesigned. When p = 3, the shear forces and the strength are fairly closely t h e same except in the top 10 % of the height. As p = 3 also makes the strain largely constant up the height, this may be regarded as a suitable design for these circum- stances.
The probability distribution of instantailcous values of strain and shear force is Gaussian and has the associated well-known properties.
Although the r.m.s. values of stress and strain arising when the structure is sub- jected to a continuous white noise excitation is a useful means of comparing the relative sizes of the vibration a t different points of the structure, it does not provide all the information required.
I n a linearly elastic system failure will depend on exceeding some particular value of stress or strain.
Earthquakes are of finite duration and what is really wanted is a measure of the largest stress or strain that arises during successive bursts of the white noise excita- tion corresponding to successive earthquakes together with the associated prob- ability distribution. To the best of the author's knowledge, there is no analysis
544 BULLETIN O F TI-IE SEISMOLOGICAL SOCIETY O F AMERICA
available which determines these features. I n order to examine this aspect of the problem the situation was simulated on an analog computer.
ME,^ TT:YLu~~> AND PROBABILI~Y DISTRIBUTION OF LARGEST VALUES
Single Degree of Freedom.-Consider first the single degree of freedom case. The integral $0'w7,,(T)e - q ~ ( t - ~ ) cos p(t - 7) d~ gives the instantaneous velocity and the
integral (l/p) $ ~ l ~ , , ( ~ ) e - q P ( l - ' ) sill p(t
-
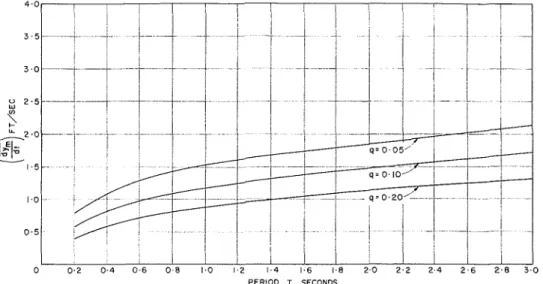
7) d~ the instantaneous displacement of the damped oscillator when subjected to a n acceleration W,(T). The largest values of these integrals are known as the damped velocity and displacement spectra of the particular excitation W,,(T). If W,(T) is a series of random acceleration excitations of the same duration and same spectral density ("white noise") but, of course,PERIOD T SECONDS
Fig. 5. Velocity Spectra, So = 0.75 ft2/sec*/cps : ~ n d of 35 seconds Duration.
different configurations, the largest values of velocity and displacement occurring during the passage of the particular excitatioil will all be different. I t is the mean value and the probability distribution of these largest values that we are interested in. A simple damped oscillator was simulated on an analog computer and fed with a white noise source.
The mean largest velocity %,/at occurring during each of a number of bursts of excitation was determined and is shown in fig. 5 as a function of period for three values of damping ratio q. I t is the close similarity of these damped spectra to Housner's averaged earthquake spectra2 that is the justification for this repre- sentation. The particular size shown corresponds to the mean value of the spectrum of the earthquake a t El Centro 1940 and this is given by a n acceleration spectral density of 0.75 ft2/sec4/c.p.s. and a duration of 25 seconds.
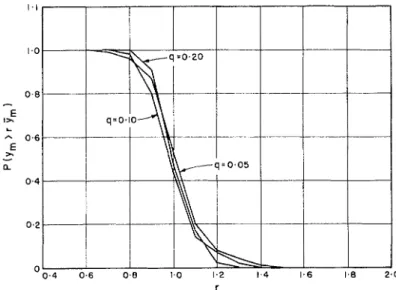
I t is to be expected that the probability distributions of the largest displacement ym or velocity ay,,/at are functions of period and damping. This is indeed the case
2 "Limit Design of Structures t o Withstand Earthquakes" G. W. Housncr, Proc. 1st World
STIFFNESS TAPER I N ASEISMIC DESIGN
r
Fig. 6. Prob:tbilit,y Dist,ribution, T = 0.20.
0 . 4 0.6 0.8 1.0 1.2 1.4 1.6 1.8 2.0
r
Fig. 7. I'rohability I)istjribution, 1'= 3.0.
but the effect of chailging these parameters over ranges relevant in thisinvestigation is found to be small. This is sho~vil in figs. 6 and 7 for 5 %, 10 %, 20 % damping and for two periods T = 0.2 and T = 3.0. The probability curves for periods between
these values were found to lie b e t ~ ~ e e n the two probability sets sho~vn. These curves were constructed from 100 runs and show the probability P(y,,,
>
rE)
i.e. of the largest displacemeilt or velocity in any one burst being T times greaterthan the mean largest. It is see11 that the effect of changing damping and period over the relevant range shown is small and also the chances of even finding a value twice the mean is very small. Zero damping, however, shows a much greater disper- sion of maxima.
546 BULLETIS OF THE SEISMOLOG~C.IL SOCIETY OF AMERICA
iMulti-degree of Freedom Case.-This investigation was extended to the multi- degree of freedom case. A lumped system of five stories mas simulated on the com- puter. The masses of the floors were made equal and the variation with height of the stiffness between floors made linear, i.e. if k , is the shear stiffness between the nth and (n - 1 ) t h floors then,
where z is measured from the top of the structure to the midpoint between the nth and ( n
-
1 ) th floors.I n a previous paper3 the author shows that by introducing viscous damping both in the relative motion of one floor to the next and in the relative motion of the floor to the base it is possible to approximately realize equal damping of the modes. This is used in the follo~ving simulation. Let
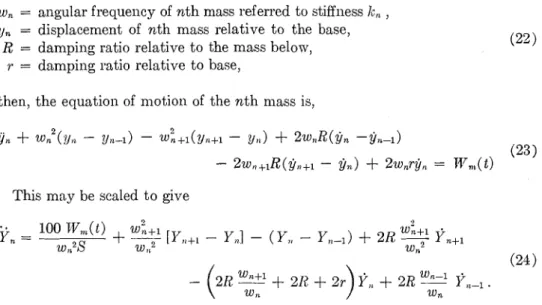
w, = angular frequency of n t h mass referred to stiffness k , ,
y, = displacement of nth mass relative to the base,
R = damping ratio relative to the mass below, ( 2 2
r = damping ratio relative to base,
then, the equation of nlotion of the n t h mass is,
This may be scaled t o give
Figure 8 sho~vs the computer circuit for the nth cell satisfying equation (24). As in the single degree of freedom case, bursts of acceleration W,(t) of equal spectral density and of 25 seconds duration were fed into this circuit for various values of
p, T and q and the mean largest relative displacement between stories ( Y ? , ~ , ~ , - ym,7,-1) determined. Any particular value of p determines a family of struc-
tures having particular mode shapes and ratios of inode frequencies which are independent of T and q. I t would seem likely that the variation of (1~,~,?,
-
Y ~ , , , - ~ ) would have a similar variation with p as sho~vn in figure 3 and its variation with Tand q would be similar to the single degree of freedom case shown in figure 5. I n order to show that this is largely true the results are presented as the ratio of the mean largest relative displacement t o the mean largest displacement of a single
3 "Yield 1)isplacements i n Multistory Aseismic Design", G. N. Bycrofl, Bull. Seism. Soc.
STIFFNESS TAPER I N ASEISMIC DESIGN 547
-Xn-l
F i g . 8. Analog Conlputer D i a g r a m of Nth S t o r y .
oscillator of the same period aiid damping as the fuiidainental period of the multi degree of freedom case. The mean largest displacement g, of the single oscillator -
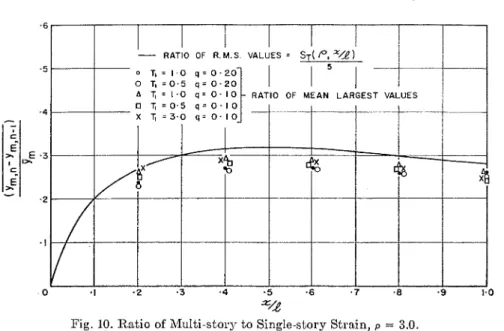
is closely given by ( ~ / n a ) [ G / a t ] from figure 5. The ratio (y,,,, - y,,,-I)/y, is shown in figures 9, 10, 11 for various periods, damping and values of p. On t h e
same graph is shown the corresponding ratio of r.m.s. values. The r.m.s. displace- ment of a single oscillator is given by,
. 6 .5 . 4
-
-
5 E-
3 =. E ).-
. 0 .2 3 4 5 . 6 II
TzI.0 q=O20 A T'I.0 q'0.10-
T.0 5 q zO.10 RATIO OF MEAN LARGEST0 T.0 5 q '0.20 X Tz3.0 q z0.I 0
-
RATIO OF11
R M.S. VALUES1
= ST( P,I
%/L) E 3 I). 1 7 . 8 .9 10 VALUES 2 Ix4?
F i g . 9. Ratio of filulti-story t o Single-slory S t r a i n , p = 0.
I/
/$
/ - --4
5 --,/*&
- - . -- -/(
- - -- - - - - - . - -B U L L E T I S O F THE SEIS&IOLOGICAL SOCIETY O F A&lERICA
x22?
Fig. 10. Ratio of Multi-story to Single-st;ory Strain, p = 3.0.
and corlsequelztly it is seen from ecluat,ioll (16) that the required r.m.s. ratio for a five storied structure is given by
I t is see11 from the graphs that these ratios are similar for the range of parameters relevant t o the problem. I t should not be inferred, however, that this is a lax-
STIFFNESS TAPER I S I S E I S M I C DESIGX 549
applicable to all damping ratios and ratios of duration of the excitation to period of the structure. By using the results of figures 3 and 5, it is thus possible t o obtain the average relevant displacements and strains in a structure of this type. Figure 5, of course, refers to a particular size and duration of earthquake but may be immedi-
Fig. 13. llulii-story Probal~ility I)istril,r~tioll, 1' = 1 0 , p = 0, q = 0.10.
ately scaled to any other size. Figures 9, 10, 11 refer to a five storied structure but may be interpolated for other number of stories.
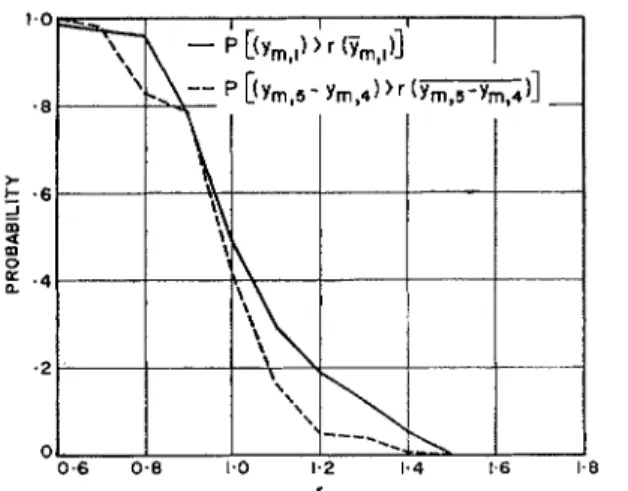
As in the single degree of freedom case, the associated probability distribution of largest values was determined and is sho~vn in figures 12, 13, 14, 15, 16 for various parameters.
Only the top and bottom floors are shown, the rest having similar distributions. These distributions are similar to each other and to the single degree of freedom case in that Ihe dispersioil is small and the chances of finding an amplitude greater
B U L L E T I N O F T H E SEISlMOLOGICAL SOCIETY O F AMER1C;I
r
Fig. 14. A/Iulti-story Probability Distribution, 1' = 0.5, p = 0, q = 0.05.
STIFFNESS TAPER I N ASEISMIC DESIGX 551
than 13 times the average is small. The chances of finding an amplitude twice t h e average appear negligible.
DESIGZ! g VALUES
Finally, the mean largest equivalent static design acceleration value may be esti- mated. Referred to the mass above the section under consideration and expressed as a fraction of gmvity, this may be shown ho be
Figure 1'7 shows g for two different cases.
Fig. 1'7. Mean ICcl~livalent Static A c c e l e s ~ ~ t i o n , 0
These are nleail largest values and should be increased by a factor of 1.5 to 2.0 t o allon- for the probability distribution. As is usually found in a linear analysis, these values are bigger than those specified by building codes.
The fact that 1,he smaller values used in practice are satisfactory is due to several causes. The size of the earthquake represented by figure 5 is a large one, and will
occur infrecluently. Safety factors introduced are also part of the explanation. B u t probably the greatest safety factor comes from plastic yielding of the materials. Most inateiials nlay safely yield a few times every B t y or more years without failure. The large hysteretic dissipation of energy involved is probably the main factor which keeps the vibrations within safe limits.
(1) Tapcring off the stiffness up the height of a structure does not have a great effect oil the shear forces arising. It has considerable effect, however, on the resulting strains. A suitable design will depend on the relation of the strength to the stiffness of the structure and on the permissible strains which call be tolerated.
552 BULLETIS O F TIlE SEISMOLOGICAL SOCIETY O F AblICR1C.i
largest stress and strain with period and damping is approximately the sanie in the multi-degree of freedom case as in the single degree of freedom case. Also the varia- tion of mean largest stress and strain with parameter p is similar t o the variation of r.m.s. stress and strain. Thus by use of Figures 3 and 5 mean design strains and stresses may be evaluated. The probability of finding a value twice the mean largest is very small.
(3) I t appears that this general method should apply equally well t o other structural systems having well separated mode frequencies.