HAL Id: hal-02621682
https://hal.inrae.fr/hal-02621682
Submitted on 26 May 2020
HAL is a multi-disciplinary open access
archive for the deposit and dissemination of
sci-entific research documents, whether they are
pub-lished or not. The documents may come from
teaching and research institutions in France or
abroad, or from public or private research centers.
L’archive ouverte pluridisciplinaire HAL, est
destinée au dépôt et à la diffusion de documents
scientifiques de niveau recherche, publiés ou non,
émanant des établissements d’enseignement et de
recherche français ou étrangers, des laboratoires
publics ou privés.
Distributed under a Creative Commons Attribution| 4.0 International License
graft-propagated cultivar in a traditional system based
on seed-propagation
Bariaa Hamadeh, Lamis Chalak, Laure Benoit, Helene I. Joly
To cite this version:
Bariaa Hamadeh, Lamis Chalak, Laure Benoit, Helene I. Joly. Evolution of almond genetic diversity
and farmer practices in Lebanon: impacts of the diffusion of a graft-propagated cultivar in a traditional
system based on seed-propagation. BMC Plant Biology, BioMed Central, 2018, 18,
�10.1186/s12870-018-1372-8�. �hal-02621682�
R E S E A R C H A R T I C L E
Open Access
Evolution of almond genetic diversity and
farmer practices in Lebanon: impacts of
the diffusion of a graft-propagated
cultivar in a traditional system based
on seed-propagation
Bariaa Hamadeh
1,2,3,4,5*, Lamis Chalak
6, Geo Coppens d
’Eeckenbrugge
4, Laure Benoit
7,8and Hélène I. Joly
4Abstract
Background: Under cultivation, many outcrossing fruit tree species have switched from sexual reproduction to vegetative propagation. Traditional production systems have persisted, where cultivar propagation is based on a mixed reproductive system. For millenia, almond, Prunus dulcis, has been propagated by seeds. Almond grafting remained of little importance until recently. In Lebanon, both sexual and clonal reproductions are used for almond propagation. We used 15 microsatellite markers to investigate the effect of introducing graft-propagated cultivars and associated practices, on the structure of the genetic diversity among and within the two main Lebanese cultivars.
Results: As expected, the sexually propagated cultivar Khachabi exhibited more genotypic and genetic diversity than the vegetatively propagated cultivar Halwani. It also exhibited lower differentiation among populations. The distribution of clones showed that propagation modes were not exclusive: farmers have introduced clonal propagation in the seed-propagated cultivar while they have maintained a diversity of genotypes within populations that were mostly graft-propagated. These practices are also important to avoid mate limitations that hamper fruit production in a self-incompatible species.
‘Khachabi’ is structured into two gene pools separated by the Lebanese mountains. As to ‘Halwani’, two different gene pools were introduced. The most ancient one shares the same geographic range as‘Khachabi’; longtime coexistence and sexual reproduction have resulted in admixture with‘Khachabi’. In contrast, the more recent introduction of the second gene pool in the Bekaa region followed an evolution towards more extensive clonal propagation of‘Halwani’ limiting hybridizations. Furthermore, some pairs of geographically distant ‘Halwani’ orchards, exhibited low genetic distances, suggesting that a network of exchanges between farmers was effective on a large scale and/or that farmers brought clonal plant material from a common source.
(Continued on next page)
* Correspondence:bariaa.hamadeh@gmail.com
1Lebanese Agricultural Research Institute, Fanar, Lebanon
2Université Montpellier 2, UMR CEFE, 34293 Montpellier Cedex, France
Full list of author information is available at the end of the article
© The Author(s). 2018 Open Access This article is distributed under the terms of the Creative Commons Attribution 4.0 International License (http://creativecommons.org/licenses/by/4.0/), which permits unrestricted use, distribution, and reproduction in any medium, provided you give appropriate credit to the original author(s) and the source, provide a link to the Creative Commons license, and indicate if changes were made. The Creative Commons Public Domain Dedication waiver (http://creativecommons.org/publicdomain/zero/1.0/) applies to the data made available in this article, unless otherwise stated.
(Continued from previous page)
Conclusions: Almond diversification in Lebanon is clearly related to the evolution of propagation practices adapted to self-incompatible cultivars. The comparison between both cultivars demonstrated the genetic effects of the introduction of a new cultivar and the associated grafting propagation practices. Our study provided information to develop a strategy for in situ conservation of cultivars and to limit gene flow from introduced material to ancient orchards.
Keywords: Population genetics, Prunus, Agricultural practices, Almond, Vegetative propagation, Grafting, Genetic differentiation
Background
Population genetic structure of a crop plant species is strongly determined by their mating system and mode of dissemination. Allogamous seed reproduction maintains the crop evolutive potential because it produces genetically variable progenies able to cope with and adapt to changing environments [1–3]. Characteristically, natural populations of outcrossing species present high within-population di-versity and low between-population differentiation for nu-clear genes [4]. Long-lived perennials uphold significantly higher levels of genetic diversity within populations than annual plants [5,6]. In a plant population, strict or partial clonal propagation results in a non-random distribution of genotypes, i.e., genetic sub-structuring [7]. High levels of clonal propagation lead to reduced genotypic diversity con-comitant with an increase in population differentiation and heterozygosity [7,8].
Under cultivation, many outcrossing fruit tree spe-cies have switched from sexual reproduction to vege-tative propagation [9], and the cost of the resulting clonality is precisely an absence or reduction of sex-ual recombination [10]. Vegetative propagation, by way of grafts or cuttings, ensures that selected traits are reliably passed true-to-type onto the next gener-ation [11]. This, together with large-scale cultivation of genetically uniform cultivars, has increased genetic vulnerability in intensive fruit production. However, less intensive production systems have persisted, where cultivar propagation is based on a mixed re-productive system, with two interlinked compartments corresponding respectively to sexually and clonally propagated plants. In the long run, farmer manage-ment of the aforemanage-mentioned compartmanage-ments will deter-mine the evolution and the population genetic structure of the species. Investigating the dynamics of such mixed sexual / clonal systems on spatial and temporal scales helps clarify these long-term pro-cesses. However, although the mating system of most clonally propagated crops is documented, their sexual reproductive ecologies are poorly known [11].
The relationship between sexual recombination and genetic diversity works in both directions. While the suppression of sexual recombination reduces genotypic
diversity, mate limitations conversely affect the potential for sexual recombination in monoclonal or polyclonal populations of obligate out-crossers. When the target of cultivation is a fruit, production can be ensured if the re-productive constraints are alleviated, for example by par-thenocarpy, a suppression of the self-incompatibility system, or a shift to hermaphroditism in dioecious spe-cies [10, 11]. Nevertheless, in many fruit tree species, even economically important ones whose cultivars have been propagated for centuries (e.g. pear, apple, cherry), efficient outcrossing is necessary, and sexual or clonal cultivar reproduction practices do not only concern propagation but also production potential. In modern, graft-established, horticulture, fruit production is ensured by establishing biclonal or polyclonal orchards, or inter-planting a few trees from a compatible pollen-donor. Synchronous flowering, pollinator activity control and separate harvesting of the different cultivars are then further constraints. How this problem is man-aged in traditional horticultural systems has largely escaped the attention of crop evolutionists.
The eastern Mediterranean Basin is documented to be one of the major centers of origin for agriculture, with the first domestication events of cereals and fruit trees occurring in the Levant about 12,000 years B.P. [12]. Al-mond, Prunus dulcis (Miller) D.A. Webb (syn. Amygda-lus communis L. and P. amygdalus Batsch.) [13], is considered to be one of the earliest domesticated nut-producing trees. It is a small deciduous self-incompatible tree, native to the Mediterranean re-gion, where P. dulcis and other Prunus species still grow in the wild [13]. For millennia, almond trees have been propagated by seeds [14]; thus, cultivated populations were domesticated a long time prior to the development of grafting [15]. Almond tree grafting was already known by the first century AD. However, it was of little import-ance until the beginning of the nineteenth century, when grafting became the propagation method used to multi-ply selected genotypes [16]. Thus, while both sexual and clonal reproductions have been used for almond propa-gation in the Mediterranean region, the introduction of new improved and clonal cultivars in the form of grafts has become more and more frequent [16, 17]. However,
little attention has been paid to the effect of these intro-ductions and the associated grafting practices, on the structure of the genetic diversity both among and within cultivars.
Molecular tools such as nuclear microsatellite SSR (simple sequence repeat) analysis have been successfully used to assess genetic diversity as well as to reveal syn-onymous and erroneous labeling in cultivated Prunus fruit germplasm [18–22] and in other Mediterranean cultivated fruit species such as olive [23,24] and fig [25]. To our knowledge, the differentiation among graft- or seed-propagated populations was only noted in a Tunis-ian apricot study [21]; its authors clearly distinguished two gene pools that are directly related to the different propagation modes of the Tunisian apricot cultivars. This study confirms the need to take into account the propagation mode when studying the structure and dy-namics of genetic diversity. However, the genetic diver-sity and structure within ancient seed propagated and recent clonally propagated almond cultivars has not been compared so far. Furthermore, to our knowledge, previous studies have been carried out at the individual level and not at the population level, except for Del-plancke et al. [26] and Wang et al. [27]. In these studies, genotyping was used to characterize clonally and sexu-ally propagated cultivars, identified by the genotype of a single individual. In our study we set out to evaluate the evolutionary process at the population level and carried out our sampling strategy accordingly.
Spontaneous populations of P. dulcis and its close wild relatives, P. orientalis (Mill.) Koehne and P. spartioides (Spach) C.K. Schneid., are still found in Lebanon [28– 30]. Cultivated P. dulcis is present in different agro-climatic areas and is part of the Lebanese land-scape. Old almond trees are still found over a wide range of elevations (0 to 1600 m). So far, studies on the diver-sity of almond in Lebanon have only concerned morpho-logical traits [31] and the identification of almond cultivars [18]. These studies give a preliminary view of the wide distribution of some cultivars across the coun-try and indicate greater varietal diversity in home gar-dens than in modern orchards. Using nuclear and chloroplastic SSR markers, gene flow were identified in both directions between cultivated almond species and P. orientalis,present in Lebanon, Syria and Turkey [26]. Moreover, the Levant was identified as a center of diver-sification for cultivated P. dulcis, since it is an important reservoir of almond genetic diversity [32].
Almond has not only been cultivated under widely di-vergent ecological conditions, but also the history of al-mond cultivation in the country is long-standing. Two main horticultural forms are recognized by farmers, based on fruit shell hardness. The most common and oldest cultivar is known as ‘Khachabi’, referring to its
fruit shell ‘as hard as wood’; for centuries, it has been cultivated and reproduced by seeds, maintaining a high level of morphological variability. Since the Ottoman period (16th to early twentieth century), many cultivars have been introduced to the country from different ori-gins. Among them, the cultivar now called‘Halwani’, was probably introduced to Lebanon during the last century; it has been widely accepted and mostly propagated by grafts, mainly in mono-varietal populations [33].
Questions arise regarding the genetic diversity of ‘Kha-chabi’ (common hard shell cultivar) and ‘Halwani’ (intro-duced soft shell cultivar), as well as their relationships and internal structure, taking into account the influence of their respective propagation modes. Nowadays, sexual reproduction is still important in almond populations and this importance depends largely on whether farmers incorporate sexual progeny into their stocks of grafting material. This practice is common in many traditional farming systems, and has probably been continued from the origin of domestication up to our time. For the present study, we sampled a large range of cultivated in-dividuals from different agro-climatic areas in Lebanon, and analyzed them with a set of 15 SSRs selected for their reproducibility and polymorphism in almond and other Prunus species, with the aim of: (1) characterizing the pattern of genotypic and genetic structure of each cultivar,‘Khachabi’ and ‘Halwani’, and (2) assessing the influence of the propagation mode on these patterns.
Methods
Survey and sampling
Field surveys were undertaken in 2009–2010 throughout Lebanon with the aim of collecting samples representa-tive of the most common almond cultivars,‘Khachabi’ and ‘Halwani’. We followed farmer’s determinations in the assignation of sampled trees to a given cultivar; no-menclature was usually based on shell hardness. Farmers usually propagated hard shell almonds from seed and soft ones by grafting. According to farmers, out of 331 ‘Khachabi’ individuals, 301 were propagated by seeds, and the 30 individuals from the youngest population were propagated by grafting. Out of the 285 ‘Halwani’ individuals, 255 were propagated by grafting and the 30 individuals from the oldest population were propagated either by grafting or seeds. In all, 14 ‘Khachabi’ and 11 ‘Halwani’ populations were sampled, covering the four major agro-climatic zones (Table1; see Additional file1: Figure S1 presents the locations of the collected popula-tions). Each sampled ‘Khachabi’ orchard only contained ‘Khachabi’ trees but the presence of rare individuals from other almond cultivars could sometimes be ob-served in ‘Halwani’ orchards. From the information gathered from farmers, we realized that, in localities of traditional almond production, orchards were either still
constituted of the original cultivar Khachabi, or they had been rejuvenated by grafting most trees with ‘Halwani’ scions. In other localities,‘Halwani’ had been established directly in new orchards. Our population approach led us to select orchards on the availability of a large enough number of individuals of a given cultivar.
Microsatellite amplification
Total genomic DNA was extracted from silica-dried leaves using ExtractNAmp™ Plant PCR Kits (SIGMA -Aldrich, St. Louis, MO, USA) abiding by the supplier’s instructions. Fifteen nuclear SSR markers previously se-lected for studying the genetic diversity of Prunus spe-cies in the Mediterranean region were used for this study: UDP96–001, UDP96–018, UDP96–003, UDP97– 401, UDP98–408, UDP98–409, pchgms1, pchgms3, BPPCT017, BPPCT001, BPPCT007, BPPCT025, BPPCT036, CPSCT018, CPDCT045 [34–38]. We ampli-fied these 15 SSR markers into three multiplexed PCRs, using one of the FAM, HEX or NED fluorophore-labeled primers (PE Applied Biosystems, Warrington, UK).
Multiplexed PCRs were carried out with the Extract-N-Amp PCR Ready Mix (SIGMA - Aldrich, St. Louis, MO, USA) in a final volume of 10 μl, containing 5μl of a SIGMA Master Mix 2X, 0.4 μl of primer mix at 5 μM, 1.6 μl of ultrapure water and 1 μl of template dNTPs. 3 μl of PCR product was mixed with 15 μl of formamide and 0.2μl of Genescan™ 500 LIZ size stand-ard (Applied Biosystems, Foster City, USA), and GeneS-can was performed with the ABI PRISM 3130 XL 16 capillary-sequencer (Applied Biosystems, Foster City, USA).
Genotyping and data organization
Allele size was read independently by two investigators using GEMEMAPPER 4.0 (Applied Biosystem, Foster City, USA). Genotyping errors were evaluated by check-ing the reproducibility of migrations uscheck-ing samples repli-cated on the different plates; in all, 95.1% of tested individuals gave the same allele size (i.e., the error rate was under 0.05).
Table 1 Populations collected throughout Lebanon
Population name Cultivar Eco-geographical zone Code n NDD EDD Age of plantation (years) Bire Halwani Bekaa HB_Bi 23 34.5872 36.2391 25
Ferzol Halwani Bekaa HB_Fe 33 33.8884 35.9396 25 Nabi Ayla Halwani Bekaa HB_NA 30 33.8819 35.9569 25 Zighrine Halwani Bekaa HB_Ze 16 34.4261 36.3528 25 Amchit Halwani Mount Lebanon HM_Am 35 34.1475 35.6464 48 Maasriti Halwani Mount Lebanon HM_Ma 30 33.7483 35.6347 30 Jeita Halwani Mount Lebanon HM_Je 30 33.9533 35.6478 70 Bchannine Halwani North Lebanon HN_Bc 35 34.3483 35.8859 20 Btaaboura Halwani North Lebanon HN_Bt 25 34.2742 35.7622 20 Deir Qanoun el Nahr Halwani South Lebanon HS_DQ 25 33.3000 35.3136 20 Tanbourit Halwani South Lebanon HS_Ta 15 33.5161 35.4153 20 Bakkifa Khachabi Bekaa KB_Ba 27 33.4933 35.8192 60 Bire Khachabi Bekaa KB_Bi 20 33.5842 35.8197 40 El Mhaidtheh Khachabi Bekaa KB_EM 30 33.5569 35.8117 60 Irsal 2 Khachabi Bekaa KB_Ir 15 34.1886 36.3923 35 Kamed el Lawz Khachabi Bekaa KB_KL 33 33.6203 35.8214 60 Lucy Khachabi Bekaa KB_Lu 35 33.6453 35.8383 60 Shaat Khachabi Bekaa KB_Sh 18 34.1422 36.2311 30 Assia Khachabi North Lebanon KN_As 25 34.2189 35.7856 50 El Qalamoun Khachabi North Lebanon KN_EQ 16 34.3872 35.7864 70 Baraachit Khachabi South Lebanon KS_Ba 30 33.1761 35.4433 50 Blida Khachabi South Lebanon KS_Bl 30 33.1400 35.5147 50 Chebaa Khachabi South Lebanon KS_Ch 23 33.3475 35.7492 80 Mays al Jabal Khachabi South Lebanon KS_MJ 18 33.1686 35.5242 37 Tanbourit Khachabi South Lebanon KS_Ta 30 33.5161 35.4153 30
Redundant genotypes were searched both within culti-vars and among populations of both‘Khachabi’ and ‘Hal-wani’ to identify multi-locus genotypes (MLGs) using GENCLONE 2.0 software [39]. Individuals with identical MLGs were considered as a clone. Different datasets were used for different analyses at different levels: global, cultivar and populations. Datasets were constructed using two different matrices: a matrix with a total of 615 individuals that will be referred to as the N dataset and a matrix with a single copy of redundant MLGs conserved within each population (with a total of 509 individuals) that will be referred to as the G dataset.
Data analysis Genotypic diversity
The discriminant power of the 15 markers used to dif-ferentiate MLGs present in the sample was explored by plotting the number of loci versus the maximum num-ber of MLGs detected for all datasets and for each culti-var; values were calculated using a re-sampling procedure (3000 permutations) implemented in GEN-CLONE. The relevance of marker information was de-scribed by the number of alleles (Na) implemented in the software GENALEX 6.5.1 [40] and the polymorphic information contents [41] ðPIC ¼ 1−Pip2i−Pi; jp2ip2j , where pi and pj are the frequency of the ith and jth
al-leles; implemented in CERVUS 3.0.7 software [42]. Genotypic richness was calculated following the cor-rected formula [43], R = (G-1) / (N-1), where G is the number of distinct genotypes and N is the number of indi-viduals sampled in a population, implemented in GEN-CLONE. The probability of observing two identical MLGs in each population (PI) was calculated using the GENA-LEX software.
Genotypic linkage disequilibrium (LD) between loci was calculated on the G dataset to avoid its overesti-mation; the coefficients of correlation (r) between loci were calculated within the G dataset, each cultivar and the distinct population subsets. Testing for genotypic linkage disequilibrium (LD) using the log likelihood ratio statistic test (G-test) was performed with the software GENEPOP 4.2 [44,45], available on the web ( http://gen-epop.curtin.edu.au/genepop_op2.html). Exact P-values were estimated using the Markov Chain algorithm with 10,000 dememorization steps, 1000 batches and 10,000 iterations.
We conserved a single copy of each MLG (G data-set) to identify the numbers of different alleles be-tween each pair of compared MLGs in each cultivar. The histograms of pairwise comparisons were con-structed using simple matching of pairs of MLGs using Unweighted Arithmetic Average, implemented in the CLUSTERING CALCULATOR program
developed by J. Brzustowski ( http://www.biology.ual-berta.ca/jbrzusto/cluster.php).
Null alleles, hardy-Weinberg equilibrium
The existence and frequency of null alleles were tested (on the N dataset) using the Expectation Maximization (EM) algorithm [46] implemented in GENEPOP (http:// genepop.curtin.edu.au/genepop_op8.html). Deviations from Hardy-Weinberg equilibrium (HWE) were tested using both alternative hypotheses of a deficit or of an ex-cess of heterozygotes for each locus and across loci, at population and at cultivar levels using Fisher method implemented in GENEPOP ( http://genepop.curtin.e-du.au/genepop_op1.html). The Hardy-Weinberg Equilib-rium tests were calculated based on both N and G datasets.
Genetic diversity
Rarefied allelic richness and private allelic richness were computed on the N dataset using the rarefaction method implemented in ADZE 1.0 [47], with a mini-mum sample size of G = 15 genotypes. The small size of some samples when eliminating redundant MLGs from the populations limited the estimation of genetic diversity parameters. Genetic diversity was estimated, for each locus, at the population and cultivar levels. Values were estimated using the unbiased expected heterozygosity UHe = 2 N / (2 N-1)*He (where He = 1-Σpi2
, and pi is the frequency of the ith allele in the population) implemented in GENALEX, the ob-served heterozygosity Ho and the Wright’s fixation index (Fis = 1-Ho/He) [48], implemented in GENETIX 4.05.2 [49]. Differences in mean diversities for each parameter were compared between populations and between both cultivars using the Mann-Whitney U-test implemented in XLSTAT-Pro 7.5 (Addinsoft 1995–2015). The Fis over loci and populations were calculated using the N dataset to better describe the sampled data; we also calculated the Fis for popula-tions with sample size (≥15 individuals) after elimin-ation of the redundant genotypes (G datasets). Confidence intervals at 95% were calculated using 10,000 bootstraps (GENETIX software). Wilcoxon’s signed rank test, implemented in XLSTAT-Pro 7.5, was performed for comparisons of heterozygosity ex-pected under HWE and to test differences in Fis values based on N and G matrices between cultivars.
Population differentiation and organization of genetic diversity
The genetic differentiation among collected populations was calculated for the N dataset. Null alleles may lead to overestimate population genetic differentiations as mea-sured by Fst [50]. To calculate pairwise genetic distances
between each pair of populations we therefore used cor-rected Fst values using the ENA (excluding null alleles) method, and corrected values of the Cavalli-Sforza and Edwards [51] genetic distance (Dc) using the INA (in-cluding null alleles) method, implemented in FreeNA [50]. Geographic distances between populations were es-timated based on the populations coordinates using the following formula: Ln(1 + Geographic Distance) imple-mented in GENALEX. In order to test isolation by dis-tance (IBD) within each cultivar, Mantel tests [52] were conducted to measure Pearson’s correlation using the GENALEX software; significance at α = 0.05 was deter-mined using 1000 randomizations of the elements of the genetic distance (Dc) x geographic distance matrix.
Two different approaches were used to infer the popu-lation structure of the whole dataset. The first was a Bayesian clustering approach assuming Hardy-Weinberg and linkage equilibrium, as implemented in the STRUC-TURE 2.3.4 software [53]. This analysis benefited from the Montpellier Bioinformatics Biodiversity platform ser-vices ( http://mbb.univ-montp2.fr/MBB/subsection/onli-neTools.php?section=2). STRUCTURE was run on the whole data, using both the G and the N datasets, to infer population structure in K genetic clusters and assign in-dividuals to those clusters. Structure was run also on partitioned subsets, for each cultivar, in order to investi-gate lower levels of structure. Individuals were assigned by probability to a cluster, or jointly to two or more clusters if their genotypes indicated that they were admixed. Individuals for which more than 85% of alleles were assigned to a cluster were considered to belong to a single cluster. To infer posterior probabilities of K, we ran a series of independent runs with different user-defined values of K ranging from 1 to 10. The ana-lysis was run ten times for 107iterations of MCMC after a burn-in period of 106based on pre-defined population genetics admixture and no linkage models. To identify the number of K clusters explaining the observed genetic structure we used the statistic parameters defined by Evanno et al. [54] based on the rate of change in the log probability of data between successive K values, imple-mented in a web-based program, STRUCTURE HAR-VESTER 0.6.94 [55]. The CLUMPP [56] output served to DISTRUCT 1.1 software [57] to graphically represent the estimated population structure, according to the geographic proximity and ecological region of each culti-var. Each individual was represented by a thick line, which was partitioned into K colored segments, repre-senting the individual’s estimated membership fractions in the K clusters.
The population genetics model in STRUCTURE, relies on restrictive explicit assumptions (populations at Hardy-Weinberg equilibrium and linkage equilibrium) which are likely to be violated for cultivated species,
especially those exposed to clonal propagation. The presence of substantial null allele frequencies may also affect the estimation of the population differentiation [50]. Hence, we choose the discriminant analysis (DA) of principal components (DAPC; [58]) as a second ap-proach, as it is a non-model clustering method. DAPC was performed to identify and describe clusters of genet-ically related individuals from G dataset, using the Ade-genet 2.0.1 package [59] implemented in R software [60]. This multivariate analysis seeks linear combinations of the original variables (alleles), which maximize between-group variation and minimize within-group variation [58].
DAPC is a multivariate method that relies on data transformation using a principal component analysis as a prior step to the DA. This prior transformation ensures that variables subjected to the DA are uncor-related. The identification of genetic groups was achieved using K-means [61], a clustering algorithm which finds a given number (K) of groups maximizing the differentiation between groups. To identify the optimal number of groups, K-means was run sequen-tially with increasing values of K, in a loop of 20 rep-etitions, and the optimal number of K groups was identified by its lowest Bayesian Information Criterion (BIC) [58]. We executed the cross-validation to pro-vide an objective optimization procedure for identify-ing the number of PC axes to retain, since the number of PC axes can have a substantial impact on the results of the global DAPC analysis [58]. The cross-validation was carried out using the function xvalDapc with 100 repetitions. The cross-validation method was also used to provide individuals’ assign-ment to groups as well as a visual assessassign-ment of between-population differentiation and admixture. Based on the optimal number of clusters and the retained discriminant functions, the DAPC analysis was run and derived probabilities for each individual membership in each of the different groups. Admixed individuals were identified at a threshold of 85% of assignation to a group.
Results
Information related to SSR markers
The 15 SSR loci revealed a total number of 375 alleles, ranging from six alleles at the BPPCT036 locus to 41 at the CPDCT045 locus (see Additional file2: Table S1). All SSR markers, except BPPCT007, were in Hardy-Weinberg disequilibrium (Fis≠ 0) for N and G datasets. At the whole dataset level, four out of 15 loci were supposed to exhibit null alleles; the estimated frequency of these alleles ranged from 15% for UDP98–409 up to 27% for CPDCT045. Seven loci showed null alleles with frequencies over 10% for ‘Khachabi’; among them, two loci (UDP97–401 and
CPDCT045) exhibited also null alleles for ‘Halwani’ (see Additional file2: Table S1).
In all, 105 pairwise comparisons between loci were conducted over all datasets without redundant MLGs (see Additional file 3: Table S2). The coefficient of correlation was r = 0.75 for the whole dataset. At the cultivar level, significant genotypic LD (P < 0.05) was identified for ‘Khachabi’ r = 0.22 (and 95% of pair-wise comparisons were in LD) while for ‘Halwani’ r = 0.43 (and 74% of pairwise comparisons were in LD) (Tables 2; see Additional file 3: Table S2).
The 15 microsatellite loci allowed to distinguish 314 MLGs out of 331 individuals distributed over the 14 ‘Khachabi’ populations, whereas 195 distinct MLGs in a total of 284 sampled individuals were distributed over the 11 ‘Halwani’ populations (Table 2). Our results showed that the set of 15 SSR loci allowed an efficient estimation of the true num-ber of MLGs; the total numnum-ber of MLGs was reached for 14 loci for the whole dataset and already for 11 and 12 loci for ‘Khachabi’ and ‘Halwani’ re-spectively (see Additional file 4: Figure S2).
Table 2 Genetic and genotypic diversity measurements
Pop Genotypic Diversity % LD(G)
Genetic diversity
N G R PI (N) Ar+ Pa+ Ho (N) He (N) Fis (N) Fis (G)# Halwani 284 195 0.69 1.20E-13 95 4.80 (0.36) 2.01 (0.31) 0.67 (0.07) 0.66 (0.04) −0.03 0 HB_Bi 23 8 0.32 4.40E-11 42 3.60 (0.25) 0.02 (0.01) 0.70 (0.08) 0.62 (0.03) −0.12* – HB_Fe 33 14 0.41 7.60E-08 77 2.89 (0.20) 0.10 (0.07) 0.62 (0.12) 0.47 (0.06) −0.34* – HB_NA 30 19 0.62 2.20E-12 83 3.93 (0.25) 0.04 (0.02) 0.74 (0.08) 0.64 (0.05) −0.15 −0.08* HB_Ze 16 7 0.4 1.50E-06 14 2.12 (0.18) 0.00 (0.00) 0.54 (0.12) 0.42 (0.06) −0.28* – HM_Am 29 27 0.93 2.60E-08 20 2.86 (0.29) 0.12 (0.08) 0.63 (0.09) 0.49 (0.06) −0.33* −0.30* HM_Ma 30 21 0.69 6.10E-09 21 2.96 (0.24) 0.05 (0.03) 0.75 (0.09) 0.52 (0.05) −0.45* −0.39* HM_Je 30 29 0.97 1.60E-17 52 6.10 (0.40) 0.21 (0.06) 0.66 (0.04) 0.76 (0.03) 0.13* 0.14* HN_Bc 32 22 0.68 6.80E-11 70 3.65 (0.32) 0.03 (0.01) 0.75 (0.08) 0.59 (0.05) −0.28 −0.21* HN_Bt 23 23 1 7.70E-12 43 3.91 (0.51) 0.20 (0.09) 0.62 (0.08) 0.60 (0.07) −0.03 −0.03 HS_DQ 23 14 0.59 6.30E-08 50 2.93 (0.25) 0.02 (0.02) 0.73 (0.11) 0.48 (0.06) −0.56* – HS_T a 15 10 0.64 7.90E-09 18 3.10 (0.24) 0.07 (0.03) 0.52 (0.08) 0.51 (0.06) −0.06* – Khachabi 331 314 0.95 1.80E-25 74 8.28 (0.50) 5.48 (0.45) 0.68 (0.05) 0.86 (0.03) 0.20 0.20* KB_Ba 26 26 1 2.30E-21 3 7.23 (0.47) 0.23 (0.07) 0.64 (0.05) 0.84 (0.03) 0.24 0.24* KB_Bi 20 20 1 4.40E-16 21 6.08 (0.41) 0.29 (0.08) 0.70 (0.06) 0.74 (0.03) 0.05 0.05* KB_EM 30 30 1 2.80E-21 13 7.47 (0.49) 0.22 (0.06) 0.73 (0.05) 0.82 (0.03) 0.12 0.12* KB_Ir 15 15 1 3.70E-18 33 6.31 (0.47) 0.41 (0.14) 0.72 (0.06) 0.79 (0.04) 0.10* 0.10* KB_KL 30 29 0.97 1.50E-20 13 7.01 (0.46) 0.26 (0.07) 0.70 (0.05) 0.83 (0.02) 0.15 0.15* KB_Lu 30 30 1 1.10E-20 14 6.92 (0.43) 0.31 (0.06) 0.73 (0.05) 0.83 (0.03) 0.13 0.13* KB_Sh 18 18 1 1.40E-17 37 6.19 (0.37) 0.23 (0.11) 0.63 (0.06) 0.78 (0.04) 0.18 0.18* KN_As 16 16 1 3.10E-19 20 6.92 (0.53) 0.41 (0.12) 0.62 (0.07) 0.80 (0.04) 0.22 0.22* KN_EQ 16 16 1 8.20E-19 14 6.83 (0.52) 0.56 (0.13) 0.62 (0.06) 0.79 (0.05) 0.22* 0.22* KS_Ba 30 30 1 7.20E-21 22 7.20 (0.48) 0.32 (0.08) 0.71 (0.06) 0.82 (0.03) 0.12 0.12* KS_Bl 29 29 1 2.40E-19 18 6.71 (0.42) 0.18 (0.06) 0.67 (0.05) 0.80 (0.03) 0.16 0.16* KS_Ch 23 21 0.91 1.30E-20 25 7.14 (0.47) 0.37 (0.12) 0.71 (0.05) 0.83 (0.03) 0.14 0.15* KS_MJ 18 17 0.94 2.90E-17 19 5.91 (0.40) 0.12 (0.05) 0.71 (0.06) 0.77 (0.04) 0.08 0.07* KS_T a 30 18 0.59 1.80E-15 52 5.32 (0.30) 0.13 (0.04) 0.65 (0.08) 0.73 (0.03) 0.11* 0.15*
N, Number of samples; G, Number of distinct genotypes; R, Proportion of distinct genotypes = (G-1)/(N-1); PI, probability of identity of two genotypes; %LD: percentage of genotypic linkage disequilibrium based on a single MLG copy; Ar+
, average number of alleles per locus; Pa+
, mean number of private alleles per locus; Ho, observed heterozygosity; He, unbiased expected heterozygosity; Fis, inbreeding coefficient
+
Standardized population at G = 15 using rarefaction method #
Fis calculated for sample size over 15 individuals
*Significant departure from Hardy-Weinberg equilibrium (P≥ 0.05) X(N)Values calculated based on N matrix
X(G)Values calculated based on G matrix Standard errors are in brackets
Genotypic diversity
The mean genotypic diversity value for cultivar Khachabi was significantly higher than the value reported for culti-var Halwani (R Khachabi = 0. 95 and R Halwani = 0.69;
U-test, P = 0.000; α = 0.05). Populations from ‘Khachabi’ exhibited higher genotypic diversity levels than popula-tions from ‘Halwani’, except for the ‘Khachabi’ KS_Ta population, due to the presence of three farmer-selected clones (R = 0.59) (Table2).This indicates the presence of more redundant MLGs in ‘Halwani’ populations, as compared to ‘Khachabi’ populations. However, among ‘Halwani’ populations, HM_Am and HM_Je exhibited only two and one redundant MLGs respectively (corre-sponding R = 0.93 and 0.97, respectively) and no redun-dant MLGs were identified in the HN_Bt population (R = 1.00).
We computed the distribution of the number of allelic differences between individuals (N dataset) for each cul-tivar; individuals were plotted after suppression of the redundant MLGs. In‘Khachabi’, 48,798 pairwise compar-isons ranged from 11 to 45 allelic differences with a peak at 30 differences, while only 28 pairwise comparisons were differing by 1 to 10 alleles (Fig. 1a). Individuals from cultivar Halwani were plotted after elimination of individuals assigned by STRUCTURE (see below) to the cluster that mainly comprised ‘Khachabi’ individuals (Fig. 1b). 11,264 pairwise comparisons for the ‘Halwani’ MLGs (Fig. 1b) displayed a continuity of values ranging from 1 to 43 differences with a multimodal curve; two major peaks, at 21 and 27, were observed. In comparison to ‘Khachabi’ a total of 1542 pairwise comparisons dif-fered by up to 10 alleles.
Forty-two redundant MLGs were defined as clones; three were observed in the clonally propagated ‘Kha-chabi’ population KS_Ta (data not shown) while 36 were observed in 10 of the 11 ‘Halwani’ populations. Among these, 24 were private (associated to one population) and 12 clones were found across different populations. Some clones were shared among geographically distant popu-lations of ‘Halwani’.
Genetic diversity
To better describe the genetic diversity existing within each cultivar and population, we decided to conduct analyses using the N dataset. ‘Khachabi’ exhibited a lar-ger number of alleles than ‘Halwani’ with 361 and 221 alleles, respectively (Table2).
Genetic diversity parameters were calculated over loci and the values are presented with their standard errors (Table2). The mean rarefied allelic richness (Ar) and the private allelic richness (Pa) were significantly higher (U-test, P < 0.0001; α = 0.05) for ‘Khachabi’ (Ar = 8.28 ± 0.50 and Pa = 5.48 ± 0.45), as compared to‘Halwani’ (Ar = 4.80 ± 0.36 and Pa = 2.01 ± 0.31). The mean genetic
diversity was significantly higher for ‘Khachabi’ (He = 0.86 ± 0.03) than for‘Halwani’ (HE = 0.66 ± 0.04) (U-test, P = 0.002; α = 0.05). Cultivar Khachabi also displayed a significant deficit in heterozygosity (Fis = 0.20) while cul-tivar Halwani had no deficit in heterozygosity (Fis =− 0.03). The comparison of the fixation index (Fis) (N dataset) exhibited high differences between ‘Khachabi’ and‘Halwani’ (Wilcoxon’s test, P < 0.0001; α = 0.05). The confidence intervals of Fis values are presented in (Add-itional file5: Table S3).
Different genetic diversity levels were also observed among populations, the lowest number of alleles for the ‘Halwani’ populations being in HB_Ze (Ar = 2.12 ± 0.18) and the highest number in the HM_Je population (Ar = 6.10 ± 0.40) (Table2). The number of private alleles (Pa) ranged from 0 to 0.21. Ten out of eleven‘Halwani’ popula-tions exhibited an excess of heterozygotes with a signifi-cant departure from Hardy-Weinberg equilibrium (P≥ 0.05). The number of rarefied private alleles (Pa) ranged from 0.12 to 0.56. All‘Khachabi’ populations exhibited a high deficit in heterozygosity (P≤ 0.05) (Table2).
Population genetic structure
Genetic differentiation (Fst) varied from 0.03 to 0.12 among ‘Khachabi’ populations, and from 0.01 to 0.31 among ‘Halwani’ populations; the highest Fst observed among populations from both cultivars was 0.33 (be-tween HB_Ze and KB_Bi) (Fig.2). The pairwise estimate values of Dc varied from 0.37 to 0.62 among ‘Khachabi’ populations, and from 0.20 to 0.56 among ‘Halwani’ populations, and from 0.44 to 0.74 among populations from both cultivars (Fig.2). The Mantel test revealed a pattern of isolation-by-distance in ‘Khachabi’ (R2 = 0.20, P = 0.006) but not in ‘Halwani’ (R2 = 0.04, P = 0.124) (see Additional file6: Figure S3).
The STRUCTURE analysis on the overall G dataset re-vealed the highest ΔK for K = 2 (ΔK = 1640.26, H′ = 0.999); 92% of ‘Khachabi’ individuals were assigned to cluster 1 (in red) and 81% of ‘Halwani’ individuals were assigned to cluster 2 (in green) (Fig. 3a). Admixed indi-viduals among both clusters were observed in both culti-vars at a threshold of assignation of 85%. The lowest percentages of assignment to the cultivar Halwani were observed in HB_Bi, HB_NA and HM_Je populations with 57, 58 and 34% of individuals assigned to cluster 2, respectively. On the whole sample, the STRUCTURE analysis assigned 117‘Halwani’ individuals, belonging to 29 clones, to cluster 2. Fourteen individuals from HB_NA belonging to five clones and two individuals from the HB_Fe‘Halwani’ populations, belonging to one clone, were assigned to cluster 1. Eight individuals from HB_Bi belonging to two clones and three individuals from the HB_NA belonging to one clone were admixed among both clusters.
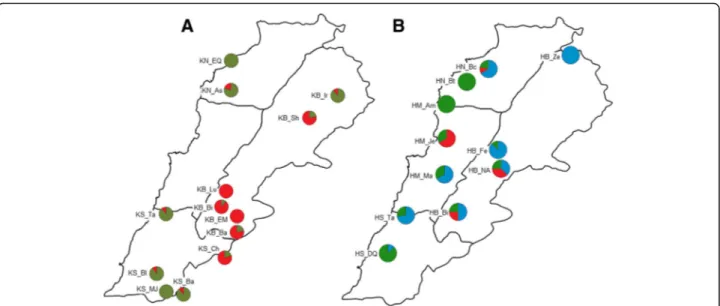
The STRUCTURE analysis of ‘Khachabi’ assigned its 314 MLGs into two clusters (K = 2,ΔK = 7024.5 and H’ = 0.999) (Fig. 3b). Populations belonging to these clus-ters were geographically differentiated (Fig.4a). The first cluster (C1.1, red) comprised the populations of the Bekaa region, except for the population KB_Ir; the nearby population from the South, KS_Ch, belonged also to this cluster. The second cluster (C1.2, olive green) was composed of populations from the South and North regions and the KB_Ir population from the Bekaa region. Some individuals were admixed among both clusters with percentages of assignation under 85%.
The STRUCTURE analysis of the populations named as ‘Halwani’ assigned the 195 MLGs of this cultivar into three clusters (K = 3,ΔK = 2251.1 and H’ = 0.999) (Fig.3c).
As expected, the first cluster (C2.1, red) included the indi-viduals which were re-assigned to‘Khachabi’ in the global analysis (C1, Fig.3a). The other individuals were assigned into two clusters (C2.2 in blue and C2.3 in green, Fig.3c). The geographic differentiation of populations was not as clear-cut as for ‘Khachabi’ populations (Fig.4b). Individ-uals from a same population were mainly assigned to the same cluster. Individuals from HN_Bt and HM_AM ex-hibited admixture between both clusters.
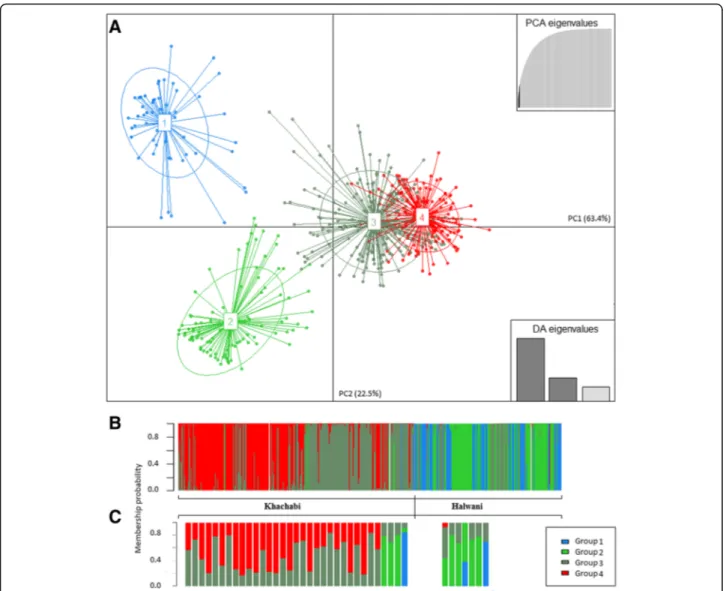
The likelihood-based analysis of population structure using DAPC split the 509 MLGs from the 25 popula-tions into four distinct groups (Fig.5aand b). The ‘Kha-chabi’ MLGs were assigned to P3 (150 MLGs) and to P4 (153 MLGs), except for four MLGs assigned to the P1 and seven to P2 groups (Table 3). At a threshold value Fig. 1 Distribution of the pairwise number of allele differences among MLGs. a Unimodal curve for‘Khachabi’ genotypes; 48,826 pairwise
comparisons, scale range from 0 to 6000 b) A bimodal shaped curve for‘Halwani’; 11,264 pairwise comparisons after elimination of the 33 individuals assigned at 85% to‘Khachabi’, Scale range from 0 to 800
of 85% of assignation, a small number of individuals showed a pattern of admixture: 10 among P3, 19 among P4, 4 among P1 and 5 among P2 (Fig.5c). The‘Halwani’ MLGs were assigned into two more differentiated DAPC groups (Table 3): P1 (63 MLGs) comprised mainly indi-viduals from the HM_Ma, HN_Bc and HB_Fe popula-tions; P2 included 94 MLGs from all populations except HB_Ze, 37 MLGs were assigned to P3 and one MLG to P4. With the threshold value of 85% of assignation, only two MLGs of the P1 and three of the P2 were admixed. Admixed individuals were identified within and among cultivars (Fig. 5c). Within cultivars, 29 ‘Khachabi’ indi-viduals were admixed between P3 and P4 groups while one ‘Halwani’ individual was admixed between P1 and P2 groups. Among cultivars, one ‘Khachabi’ individual was admixed among P1, P2 and P3, three MLGs were admixed between P2 and P3, one ‘Halwani’ MLG from HS_Ta was admixed between P1 and P3, another MLG
was admixed among P2, P3 and P4, and four other ‘Hal-wani’ MLGs were admixed between P2 and P3.
The results from both Bayesian and non-model based analyses were compared at a threshold of 85% of assignment, for the global dataset (both cultivars; Table 3). Among ‘Khachabi’ individuals, 78%were assigned to cluster C1 according to STRUCTURE and to the P3 and P4 DAPC groups. As for ‘Halwani’, 66.7% of individuals assigned to cluster C2 according to STRUCTURE were assigned to the P1 and P2 DAPC groups.
Considering cultivars separately, the ‘Khachabi’ C1.1 and C1.2 STRUCTURE clusters correspond to P3 and P4 DAPC groups, respectively. As to ‘Halwani’, individ-uals assigned to C2.1 by STRUCTURE were assigned to P3 by DAPC; individuals assigned to the C2.2 and C2.3 STRUCTURE clusters were mainly assigned to the P1 and P2 DAPC groups, respectively.
Fig. 2 Heat map for pairwise genetic distance between populations. Upper part: Fst; lower part: Dc (Cavalli-Sforza). Values were calculated with 1000 permutations. Values are significant at P > 0.001. Genetic differentiation is: Low to moderate 0.02 < x < 0.15 (in blue), high genetic
differentiation 0.15 < x < 0.25 (in green) and very high > 0.25 (in yellow). Genetic distance (Dc) is: Low to moderate 0.02 < x < 0.4 (white to yellow), high genetic distance 0.4 < x < 0.8 (red to black)
Discussion
Understanding how human practices affect the evolu-tionary dynamics of domesticated plant species is a key factor to improve the management of crop genetic diver-sity. It also helps understand how specific biological pa-rameters, like reproductive systems and gene flow, affect genetic diversity. The cultivated almond is intermediate between seed propagated and vegetatively propagated perennial species; it provides a good model to answer our inquiries on domestication and diversification of vegetatively reproduced plants cultivated for their fruits and particularly self-incompatible fruit trees. Indeed, al-mond has been domesticated through seed selection and reproduction [9]; grafting was developed only over the last centuries; and its self-incompatibility system inter-feres with its sexual reproduction, as well as with fruit production per se. We will discuss our results concern-ing: 1) the high genetic diversity level of ‘Khachabi’ and
its lower level in ‘Halawani’; 2) the deficit of heterozy-gosity in ‘Khachabi’ and its excess in ‘Halwani’; 3) the high genetic differentiation among ‘Halwani’ and ‘Kha-chabi’; 4) the high genetic differentiation between ‘Hal-wani’ groups; 5) the low genetic differentiation between both‘Khachabi’ groups.
Genetic diversity
As expected from the propagation mode of each cultivar and the outcrossing mating system of the species, the sexually propagated cultivar Khachabi exhibited much more genetic and genotypic diversity than the vegeta-tively propagated cultivar Halwani.
The level of genetic diversity observed within ‘Kha-chabi’ (He = 0.86) was as high as what was observed in national germplasm collections of different Mediterra-nean countries [19, 20, 22]. This genetic diversity could even be compared to the genetic diversity of Fig. 3 Genetic Structure of almond genotypes estimated by STRUCTURE. a DISTRUCT representation of 14‘Khachabi’ and 11 ‘Halwani’
populations (509 genotypes). K = 2,ΔK = 1640.26 and H′ = 0.998; b) DISTRUCT representation of 14 ‘Khachabi’ populations (314 genotypes); ΔK graph: K = 2,ΔK = 7024.5 and H’ = 0.999; c) DISTRUCT representation of 11‘Halwani’ populations (195 genotypes); K = 3, ΔK = 2251.1 and H’ = 0.999
spontaneous Prunus species, such as P. orientalis sam-pled from Lebanon, Syria and Turkey (He = 0.85) [26]. The comparison holds also at the population level. In-deed, in all seed-propagated‘Khachabi’ populations, gen-etic diversity ranged between 0.74 and 0.84. These values compare with those observed in 20 wild Chinese populations of P. sibirica L., another self-incompatible species, where He ranged from 0.66 to 0.80 [27]. In our sample, the genotypic diversity level was only reduced for the ‘Khachabi’ KS_Ta population (R = 0.59), where the farmer had selected, and graft-propagated, three trees selected for their fruits. Even so, this unusual situ-ation did not affect the level of allelic richness, as the se-lected individuals had retained a level of heterozygosity as high as for the seed-propagated ‘Khachabi’ populations.
‘Halwani’ exhibited a lower genetic diversity than ‘Kha-chabi’; which is due to the introduction of a limited number of individuals followed by clonal propagation. However, genetic diversity of ‘Halwani’ populations is still relatively high (He from 0.42 to 0.59), compared to cultivated self-pollinated Prunus species, as in the exam-ples of three genetic groups of commercial peach culti-vars collected from North America and Europe (He from 0.36 to 0.43) [38] and two genetic groups of sweet cherry cultivars collected from 16 countries and main-tained in France (He values of 0.27 and 0.30, respect-ively) [62]. We relate this relatively high diversity to self-incompatibility in cultivar Halwani. Indeed, if or-chards were constituted by a single self-incompatible genotype, flower fertilization would be hampered and commercial fruit production reduced. The only solutions are either to maintain pollen flow from external sources,
or to maintain a minimal diversity of self-incompatibility alleles within‘Halwani’ orchard. The first solution is ob-served when‘Khachabi’ or spontaneous almond trees are present in the close vicinity, so they can participate in pollination. The second one implies a conscious choice of genetically diverse grafting materials, to avoid mate limitations within ‘Halwani’ orchards. Indeed, all ‘Hal-wani’ populations presented a composite structure with different genotypes. These management practices are found in cultivars of other Prunus species. For example, similar traditional management has long been known in cultivated apricot, where much of the variability has been conserved using a mix between seed- and graft-propagation (e.g. Vesuvian, Roussillon, and Pelo-ponnese apricots) [63].
‘Khachabi’ exhibited a high heterozygosity deficit at both cultivar and population levels. These deficits can be explained in part by the presence of null alleles in seven loci, whose frequencies were significantly different from zero. Null alleles lead to underestimate the observed het-erozygosity within populations and overestimate the fix-ation index [64]. It is likely that, on the long term, some level of endogamy (continued crosses among trees within population) has also contributed to this deficit.
The heterozygote excesses observed in‘Halwani’ popu-lations were in accordance with expectations; as re-peated clonal propagation has preserved the initial heterozygosity of founder individuals. Similar results were observed for the perennial outcrossing crop cassava in Brazil [65], for improved apricot in Spain [66] and for Prunus avium in three French sites [8]. Over genera-tions, somatic mutations may also contribute to increase heterozygosity. Such mutations were evidenced in Fig. 4 Geographical distribution of STRUCTURE assignment, each population is represented in a pie chart. a K = 2 for‘Khachabi’ populations; b) K = 3 for‘Halwani’ populations. Full names of the abbreviations for the populations are shown in Table1
pairwise comparisons among collected individuals: some MLGs were differentiated from others at only one of the fifteen analyzed loci, and by slight inter-allelic variations (1 or 2 bp).
Genetic differentiation
The exploration of genetic structure by using both Bayesian and non-model methods has provided comple-mentary information, by identifying different levels of genetic structure within the overall dataset (Fig. 5, Tables3). The first, global, STRUCTURE analysis differ-entiated among cultivars while DAPC analysis detected structure among and within cultivars. The latter sub-structuring was also obtained when carrying out the STRUCTURE analysis for each cultivar separately. It is worth noting that the value of the statisticΔK for K = 2
was large enough to approve the robustness of these clusters, and exclude the effect of some departure from STRUCTURE model hypotheses that may lead to a diffi-cult estimation of the true number of clusters [67]. The assignment of individuals to DAPC groups was consist-ent with their assignmconsist-ent to the Structure clusters; we observed only a slightly lower consistency in the identifi-cation of admixed individuals between both methods.
Clustering results were in good accordance with culti-var denominations; the two major gene pools (STRUC-TURE clusters C1 and C2) correspond to the studied cultivars, and the assignation of individual trees to one of them mostly reflects their denomination by farmers. Nevertheless, history of orchard establishment and reju-venation has produced some discordance between farmers’ denominations and the genetic identity of some Fig. 5 Genetic structure of almond genotypes estimated by DAPC. a Scatterplot of 509 MLGs on the first two axes representing 63.4% (PC1) and 22.5% (PC2) of the variation. Individuals are represents as dots and the groups as inertia ellipses. b STRUCTURE-like plot of 509 MLGs; c) Admixed individuals having no more than 85% of probability of membership in a single group. Each line corresponds to a single individual; colors correspond to the group memberships
trees: 30 ‘Halwani’-named trees, from three different or-chards, are assigned to the ‘Khachabi’ (C1) gene pool. This could be due either to the presence of ‘Khachabi’ trees in the‘Halwani’ planting material coming from the nursery or to a failure of ‘Halwani’ grafting onto ‘Kha-chabi’ old trees when rejuvenating the orchard.
Dominant clonal propagation of cultivar Halwani has led to limited gene flow with‘Khachabi’. Only four ‘Kha-chabi’ and six ‘Halwani’ individuals were not assigned to any groups by DAPC, and the detection of admixture suggests that these 10 genotypes were produced by hybridization. This low level of admixture was the result of a combination of both sexual and clonal propagation practices: sowing spontaneous hybrids between both cul-tivars, followed by clonal propagation of selected hybrid
trees; this ensured bi-directional gene flow between cul-tivars. This effect of the propagation mode on the gen-etic differentiation was also documented for cultivated apricot: even though apricot in Tunisia has experienced a single introduction event from the Irano-Caucasian area, it has been subject to local diversification as a re-sult of different propagation practices that have led to the existence of two different gene pools, one propa-gated by seeds and the other one propapropa-gated by grafting [21].
Our results demonstrate also that ‘Khachabi’ is struc-tured into two relatively close gene pools (Fst = 0.033) separated geographically by the chain of Lebanese mountains; they correspond mainly to populations of the central plateau of the Bekaa region and its back mountains, for the first gene pool, and populations of the maritime range of coast and adjacent mountains, for the second gene pool. Admixed individuals were ob-served between these two gene pools. Farmers mainly established their ‘Khachabi’ orchards with seeds from nearby orchards or mountains (presumably ancient areas of cultivation). However, the presence of individuals from both gene pools, as well as admixed individuals, in the same orchards, attests for events of long distance seed migration among different geographic regions (Fig. 4a). Recurrent hybridizations between ‘Khachabi’ gene pools as shown by the sigmoidal shape of proportion of assignation among both ‘Khachabi’ clusters have weak-ened their differentiation. Likewise, seed migrations and hybridizations among individuals from nearby popula-tions have contributed to reduce the effects of isolation by distance among collected populations. The first ‘Kha-chabi’ gene pool (C1.1) had no admixed individuals with either of the ‘Halwani’ gene pools. The clonal propaga-tion of ‘Halwani’ and its recent introduction in the Bekaa region have prevented hybridizations. The second ‘Khachabi’ gene pool shares the same geographic range as the ‘Halwani’ cultivar, and longtime coexistence and sexual reproduction have resulted in admixture between cultivars.
As to cultivar Halwani, our results indicate that two different gene pools (Fst = 0.152) were introduced. This double origin was supported by the high values of Fst and Dc observed between some ‘Halwani’ populations. The first gene pool (C2.3) is mainly present in old or-chards (Table1). These orchards included more admixed individuals, confirming that propagation after theses early introductions has involved sexual recombination. The second gene pool (C2.2) is mainly present in the newest orchards (established in the 1980’s and 1990’s ac-cording to farmer interviews) where almond grafting was more intensively used. Therefore, it is not surprising that we observe only one admixture event between both gene pools, as time has been too short for consequent
Table 3 Assignment of 509 sampled individuals to STRUCRTURE’s clusters and DAPC’s groups
Structure C1 C2 Admixabetween C1 and C2 G
DAPC P3 P4 P1 P2 P1 P2 P3 P4 HB_Bi 3 1 3 7 HB_Fe 1 12 2 1(1)a 16 HB_NA 7 4 4 4(1)a 19 HB_Ze 7 7 HM_Am 24 3 27 HM_Ma 13(1)a 8 21 HM_Je 14 4 6 5 29 HN_Bc 2 13 6 1 22 HN_Bt 1(1)a 11 1 8(1)a 2 23 HS_DQ 1 2 11 14 HS_Ta 5 1 2 2(1)a 10 KB_Ba 8(3)a 18(4)a 26 KB_Bi 20 20 KB_EM 2 27(2)a 1 30 KB_Ir 11 4(1)a 15 KB_KL 1(1)a 27(1)a 28 KB_Lu 6(1)a 24(3)a 30 KB_Sh 3(1)a 13(3)a 1 1 18 KN_As 13(1)a 1 1 1 16 KN_EQ 13(1)a 1 2 16 KS_Ba 28(1)a 1 1 30 KS_Bl 18(1)a 2(2)a 8 1 29 KS_Ch 7 14(1)a 21 KS_MJ 6 3(2)a 8 17 KS_Ta 5 1(1)a 2(1)a 9 1(1)a 18 Total 145 152 62 75 5 26 42 2 509 a
< 85% of alleles were assigned to a cluster and/or group
x (y), x: number of assigned individuals; y: number of admixture within assigned individuals, resulting from DAPC analysis
hybridization, particularly as concomitant evolutions of farmer’s practices have more clearly favored vegetative propagation over sexual recombination in the C2.2 gene pool of this cultivar. However, some pairs of geographic-ally distant orchards, assigned to the same gene pool, ex-hibited low genetic distances, suggesting that a network of exchanges between farmers was effective on a large scale and/or that farmers have brought clonal plant ma-terial from a common source.
Evolution of cultivated almond
The genetic diversity of the almond cultivars collected from this center of diversification revealed patterns of evolution, genetic structure, and geographical and social factors that have affected the crop in its evolutionary dynamics.
Evolutionary dynamics of‘Khachabi’
In ‘Khachabi’, genetic structure patterns were similar to those observed for wild tree species. However, gene flow is not random among ‘Khachabi’ populations. Almond pollination is mainly carried out by bees. Although, in case of winter food scarcity, they can carry pollen be-tween trees at distances up to 5 km [68], such long dis-tance pollen exchanges are exceptional since this cultivar and other cultivated almond trees are present everywhere. Instead, local dispersal of seeds (by farmers or animals) and pollen explain the limited differentiation among neighboring populations and the correlation be-tween genetic and geographic distances that we have ob-served (see Additional file 6: Figure S3); this is particularly true among the populations of the western Bekaa and the nearby Chebaa in the South (KS_Ch, Figs. 2 and 4). A limited isolation-by-distance is also consistent with a low level of endogamy and the conse-quent deficit in heterozygosity.
Dynamics of the integration of‘Halwani’ grafted almond, and the adoption of grafting practices
‘Halwani’ was introduced from two different gene pools and propagated mainly in the coastal region. Both gene pools were introduced into the coastal regions by single or multiple introductions. The earliest one was concomi-tant with the incorporation of grafting practices for al-mond. Based on case studies from our data, we can envisage a consistent scenario explaining the evolution-ary dynamics of ‘Halwani’, and particularly its interac-tions with‘Khachabi’. When ‘Halwani’ was introduced in a given orchard, individuals of ‘Khachabi’ were pre-served, leading to hybridization between both cultivars and the advent of admixed MLGs. Indeed, non-admixed ‘Halwani’ material sampled in the oldest ‘Halwani’ or-chard (HM_Je) was only represented by three individual trees. As the subsequent phase of diffusion of ‘Halwani’
was based on locally collected materials, admixed mate-rials could be part of the process. Thus, in the HB_Bi or-chard, even though the farmer was sure to have ‘Halwani’ trees (having bought grafted trees at the local nursery), our genetic analysis identified trees with admixed MLGs resulting from hybridization between both cultivars. The presence of clones with admixed MLGs in the same geographic region further supports a scenario of propagation from nurseries. Another likely source of error in the diffusion of ‘Halwani’ was grafting failure, followed by ‘Kachabi’ rootstock suckering. This may be suspected for the HB_Na orchard; the farmer had bought his plants from a local nursery as ‘Halwani’, but the genetic analysis assigned many of them to ‘Khachabi’.
Later on, the grafting technique was better adopted. The success of grafting increased, explaining the marked predominance of clones in the C 2.2 gene pool that was more recently introduced to the Bekaa region (HB_Ze and HB_Fe orchards). The reduction of on-farm sexual propagation and the corollary appropriation of almond grafting practices led to a reduction of the genetic diver-sity of ‘Halwani’. Furthermore, farmers do not propagate all clones at the same rate, and in the long term, some clones will be lost.
In addition to the effect of farmers’ practices, networks of exchange have played an important role in structuring genetic diversity. Indeed, gene flow appeared to result from a network of exchanges of grafting material when establishing new orchards. The‘Halwani’ grafts may have been taken from nurseries and/or orchards. This history of introduction and the exchange network of both ‘Hal-wani’ gene pools deserves to be explored more in depth in order to better understand the impact of human prac-tices on the dynamics of this cultivar and its interactions with more ancient local germplasm.
Evolution of domesticated almond and propagation practices
Our comparative study of the two main Lebanese al-mond cultivars and their interactions provided us with the main elements of a model of evolution of self-incompatible perennial fruit crops under domestica-tion and tradidomestica-tional cultivadomestica-tion. Furthermore, the com-parison allowed us to describe the genetic effects of the concomitant introduction of a new cultivar and the cor-responding propagation techniques. Grafting techniques are recent in cultivated almond evolution, and the first phases of its domestication process only involved allog-amous sexual propagation; the late adoption of vegeta-tive propagation limits the interest of the parallels often established with the domestication of crops derived from wild relatives that propagate vegetatively, such as cactus pear, banana and pineapple.
As long as allogamous sexual propagation is exclusive, genotypes cannot be fixed, and the genetic structure of cultivated populations remain similar to that of the fruit crop wild relatives, showing high genetic diversity within populations, limited differentiation among populations, and isolation by distance and topography. Thus, the gen-etic parameters reflecting the gengen-etic organization of cultivar Khachabi populations in Lebanon compare ex-cellently with those of close wild relatives.
The introduction of clonal propagation through graft-ing techniques brgraft-ings the advantages of clonal propaga-tion, particularly the fixation of elite genotypes, as well as other genetic effects, and first the reduction of geno-typic diversity and a marked differentiation among pop-ulations. These effects are not as rapid and dramatic as could be expected, because of the long generation time that maintains old genetic patterns, and because farmers adapt their practices progressively, introducing vegeta-tive reproduction in sexually propagated cultivars, as well as sexual recombination in the new clonal cultivars, thus generating new genetic diversity. As the evolution of farmers’ practices gives more and more prevalence to vegetative reproduction, newly introduced populations of the clonal cultivar evolve differently, with a stronger loss of genetic diversity and less interactions with an-cient cultivars. The observed evolution of the cultivar Halwani follows clearly such a pattern.
The almond self-incompatibility system plays a par-ticular role in these developments, imposing outcrossing in traditional, sexually propagated, cultivars, favoring re-combination among ancient cultivars and new introduc-tions, but also imposing a threshold of minimal genetic diversity to avoid mate limitation and the attendant yield reductions. Beyond this threshold, the system would evolve towards the exclusive use of vegetative propaga-tion, as in western horticulture, implying the adoption of the complete technical package of modern horticulture (establishment of polyclonal orchards or use of special-ized pollinator cultivars, unless a truly self-compatible cultivar is developed), while resulting in a dramatic ero-sion of genetic diversity.
Conclusion
The population approach has allowed us to identify the effect of practices of farmers and nurserymen on the dy-namics of genetic diversity within and among cultivars. Our results have shown different patterns of genetic di-versity and population genetic structure for almond cul-tivars cultivated in Lebanon. Our study does not only contrast the effects of seed- and graft- propagation on genetic and genotypic diversity; it also shows that these propagation modes are not exclusive: farmers introduce clonal propagation in the seed-propagated cultivar while they maintain a diversity of genotypes within
populations that are mostly graft-propagated. In such a mixed system, genetic diversity is not negatively affected and orchard productivity is not limited by the availability of compatible pollinators.
Our study also detected long-distance exchanges of planting materials. Elucidating the social networks driv-ing them will lead to a better understanddriv-ing of the spatial and temporal dynamics of the genetic structure of the Lebanese almond and of the diversification pro-cesses at work. It will provide more in-depth informa-tion to develop a strategy for in situ conservainforma-tion of cultivars and to reduce gene flow from introduced ma-terial to ancient orchards, as well as to natural popula-tions of various Prunus species.
Additional files
Additional file 1: Figure S1. The geographic locations of the collected populations. A total of 14‘Khachabi’ and 11 ‘Halwani’ populations were sampled, covering the four major agro-climatic zones. (TIF 925 kb)
Additional file 2: Table S1. Statistics associated with microsatellite loci. Na, total number of alleles; PIC, polymorphic information content; Ho, observed heterozygosity; He, unbiased expected heterozygosity; Fis, inbreeding index calculated based on a matrix of N individuals or G genotypes; f (Null), estimation of significant frequency of null alleles. (a) Cipriani et al. 1999; (b) Testolin et al. 2000; (c) Sosinski et al. 2000; (d) Dirlewanger et al. 2002; (f) Aranzana et al. 2002. * HW significance with Bonferroni correction (P < 0.01). Fis(N)values were calculated with all
trees found including repeated clone genotype. Fis(G)values were
calculated with only one individual per multi locus genotype (MLG). (XLS 28 kb)
Additional file 3: Table S2. Genotypic linkage disequilibrium for pairwise comparisons between loci conducted over different data sets without redundant MLGs.– data not available; The coefficient of correlation is indicated for P > 0.05. (XLS 45 kb)
Additional file 4: Figure S2. Mean number of alleles per locus as a function of sample size. N, number of MLGs. Diamonds for global dataset, squares for‘Khachabi’, triangles for ‘Halwani’. (TIF 36 kb)
Additional file 5: Table S3. Confidence intervals for Fis values at 95%. Fis calculated for sample size over 15 individuals (N) or genotypes (G). (XLS 25 kb)
Additional file 6: Figure S3. Plot of genetic distance (Dc) and geographic distance for A) 14‘Khachabi’ populations; B) 11 ‘Halwani’ populations. Significance atα = 0.05. (TIF 23 kb)
Abbreviations
DAPC:Discriminant analysis of principal components; Dc: Genetic distance; ENA: Excluding null alleles; Fis: Wright’s fixation index; Fst: Genetic differentiation index; G: The number of distinct sampled genotypes; Ho: Observed heterozygosity; HWE: Hardy-weinberg equilibrium; IBD: Isolation by distance; INA: Including null alleles; K: Number of clusters; LD: Linkage disequilibrium; MCMC: Markov chain Monte Carlo; MLGs: Multi locus genptypes; N: The number of sampled individuals; PCR: Polymerase chain reaction; PI: Probability of identity; PIC: Polymorphic information content; R: Genotypic richness; SSR: Simple sequence repeat; UHe: Unbiased expected heterozygosity
Acknowledgements
The authors are indebted to all Lebanese farmers who contributed precious information on their germplasm and propagation practices. The authors are grateful to the CEFE“Service Commun de Marqueurs Génétiques en Ecologie” and the LabEx CeMEB “plate-forme séquencage-génotypage”, University of Montpellier II where genotyping was performed. The authors