HAL Id: hal-00608284
https://hal.archives-ouvertes.fr/hal-00608284
Submitted on 12 Jul 2011HAL is a multi-disciplinary open access archive for the deposit and dissemination of sci-entific research documents, whether they are pub-lished or not. The documents may come from teaching and research institutions in France or abroad, or from public or private research centers.
L’archive ouverte pluridisciplinaire HAL, est destinée au dépôt et à la diffusion de documents scientifiques de niveau recherche, publiés ou non, émanant des établissements d’enseignement et de recherche français ou étrangers, des laboratoires publics ou privés.
3D visualization and quantification of bone and teeth
mineralization for the study of osteo/dentinogenesis in
mice models
Arnaud Marchadier, Catherine Vidal, Sylvain Ordureau, Roger Lédée,
Christophe Léger, M. Young, M. E. Goldberg
To cite this version:
Arnaud Marchadier, Catherine Vidal, Sylvain Ordureau, Roger Lédée, Christophe Léger, et al.. 3D visualization and quantification of bone and teeth mineralization for the study of osteo/dentinogenesis in mice models. SPIE Medical Imaging 2011, Feb 2011, Orlando, United States. �hal-00608284�
3D visualization and quantification of bone and teeth mineralization
for the study of osteo/dentinogenesis in mice models
A. Marchadier
a, C. Vidal
b, S. Ordureau
c, R. Lédée
a, C. Léger
a, M. Young
d, M. Goldberg
ba
Institut PRISME, UPRES EA n°4229, 12 rue de Blois, 45067 Orléans, France
b
Institut Pasteur and INSERM U747, 45 rue des Saints Pères, 75006 Paris
c
UsefulProgress, 23 rue d’Anjou, 75008 Paris, France
dNIDCR, NIH Bethesda, MD USA
ABSTRACT
Research on bone and teeth mineralization in animal models is critical for understanding human pathologies. Genetically modified mice represent highly valuable models for the study of osteo/dentinogenesis defects and osteoporosis. Current investigations on mice dental and skeletal phenotype use destructive and time consuming methods such as histology and scanning microscopy. Micro-CT imaging is quicker and provides high resolution qualitative phenotypic description. However reliable quantification of mineralization processes in mouse bone and teeth are still lacking. We have established novel CT imaging-based software for accurate qualitative and quantitative analysis of mouse mandibular bone and molars.
Data were obtained from mandibles of mice lacking the Fibromodulin gene which is involved in mineralization processes. Mandibles were imaged with a micro-CT originally devoted to industrial applications (Viscom, X8060 NDT). 3D advanced visualization was performed using the VoxBox software (UsefulProgress) with ray casting algorithms. Comparison between control and defective mice mandibles was made by applying the same transfer function for each 3D data, thus allowing to detect shape, colour and density discrepencies. The 2D images of transverse slices of mandible and teeth were similar and even more accurate than those obtained with scanning electron microscopy. Image processing of the molars allowed the 3D reconstruction of the pulp chamber, providing a unique tool for the quantitative evaluation of dentinogenesis.
This new method is highly powerful for the study of oro-facial mineralizations defects in mice models, complementary and even competitive to current histological and scanning microscopy appoaches.
Keywords: Times Roman, image area, acronyms, references
1. INTRODUCTION
Research on bone and teeth mineralization in animal models is critical for understanding human pathologies. Genetically modified mice are highly valuable models for research on bone and tooth mineralization, and for better understanding of human bone and teeth pathologies [1]. Current investigations on mice dental and skeletal phenotype use destructive and time consuming methods such as histology and scanning microscopy. Micro-CT imaging is quicker and provides high resolution qualitative phenotypic description.
However reliable quantification of mineralization processes in mouse bone and teeth are still lacking. We have established novel CT imaging-based software for (i) acurate qualitative and quantitative analysis of mouse mandibular bone, (ii) 3D reconstruction of molar pulp chamber, providing a unique tool for the quantitative evaluation of dentinogenesis.
2. MATERIALS AND METHODS
2.1 Method overview
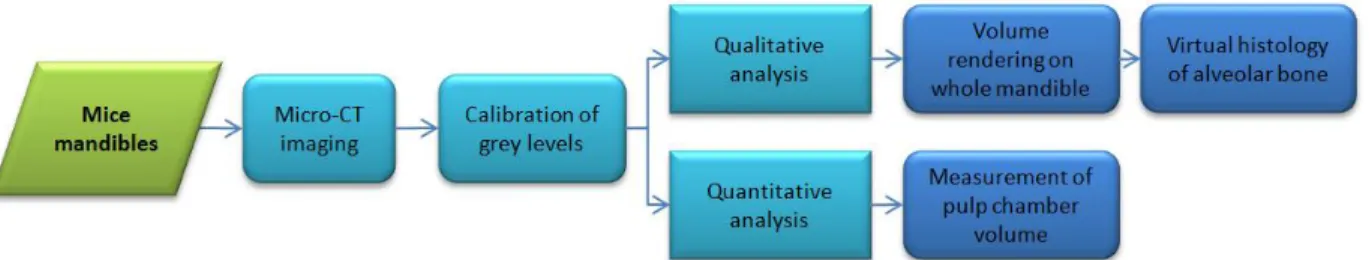
Using a micro-CT normally devoted to industrial applications, we obtained high resolution 3D images of mandibles. Before analysis of these data, we performed a histogram calibration in order to have the best correlation between grey levels and tissues mineralization. Qualitative and quantitative analysis were then computed allowing complex visualization and 3D measurements as described in Figure 1.
Figure 1: Method overview for qualitative and quantitative analysis of mandibles
2.2 Mandible samples
All experiments were performed under an institutionally approved protocol for the use of animals in research (#NIDCR-IRP-09-536). Data obtained from mandibles of 3 week- and 10 week-old Fmod-KO mice were compared with age matched wild type mice (WT) (16 mice/group).
Data were obtained from mandibles of mice lacking the Fibromodulin gene (KOFM mice), which is knowed to be involved in mineralization processes [2], and compared to wild type mice (16 mice/group).
2.3 Micro-CT imaging
For high-resolution 3D imaging of mandibles, we use a micro-CT originally devoted to industrial applications (Viscom, X8060 NDT). The X-Ray source, designed with a molybdenum target, was set up with a voltage of 60kV and a current of 200µA. The exposure time was 1sec per frame. Mandible 3D images had an isotropic resolution of 13µm and a dynamic range of 16 bits.
2.4 Calibration of grey levels
Contrasts in grey levels of CT images rely on differential attenuations of X-Rays through the material []. Theoretically, only monochromatic X-Ray beam, as reach in a synchrotron, can lead to a direct linear relation between grey level and density []. As a conventional X-Ray source, the micro-CT X-Ray beam is polychromatic and may give rise to artifactual variations of the grey scale. The principal artifact : beam hardening effect, leads to variations of grey level with the size of sample and need to be addressed carefully []. To eliminate this artifact, different method are available [] and in particular for scanning bone sample. Moreover, assuming a beam hardening correction, it has been previously reported that the relation between grey level and densities could be calibrated by a linear approximation [].
During the tomographic reconstruction process, we used an option of the dedicated software (Vol64, Viscom) that allowed beam hardening correction. In order to obtain an accurate comparison between the mandibles of the two groups of mice, we performed a systematic calibration of the CT images. Two references were used (i) the enamel at the tip of
the incisor, the density of which is constant in all mice, (ii) the background grey level. Histograms of 3D images were then corrected if necessary according to the defined references before proceeding to the 3D visualization. This correction protocol consisted on a shift and scale operation.
Figure 2 : Histograms of the whole mandible dataset before and after correction
2.5 Visualization with volume rendering
Volume rendering is a well known technique used to visualize 3D discretely sampled datasets []. This technique is particularly suitable to render images acquired by a CT, MRI, or MicroCT []. In contrast to surface rendering, that need first primitive extraction (as for example an isosurface), volume rendering allows direct voxels visualization with opacity and color.
Implementation of volume rendering with a ray casting method, available in the VoxBox software (UsefulProgress), was used for advanced visualization of mandibles. Comparison between control and defective mouse mandibles was made by applying the same transfer function for each 3D data, thus allowing to detect shape, colour and density discrepancies. We defined four transfer functions : one for opacity and three for color in a HSV space as illustrated in Figure 3 :
Figure 3 : Transfer functions for opacity and HSV used for volume rendering
Two different views were computed : a sagittal orientation of the whole mandible and a thick region of interest in a frontal orientation located between the first molar and the second molar (Figure 4).
Figure 4 : Sagittal view of a mandible (left) and junction between the first and the second molar (right)
2.6 Pulp chamber volume
The pulp chamber of the molar refers to the inner most portion of the tooth that contains the pulp. It constitutes a 3D closed region suitable for region growing method segmentation. We used the connected threshold image filter available in the Insight Toolkit [1] to extract the pulp chamber volume.
Grey level : good contrast air/dentin
Three parameters were set as input: two thresholds of grey level and a 3D seed point.
Fig 5: Region growing segmentation of the pulp chamber of the second molar
3. RESULTS
3.1 Qualitative results
Based on the volume rendering visualization, our first result was to identify three distinct parts forming the mandible as described in Figure 6. The distal or rostral part differed from the central part and represents the most mineralized module. The central part was subdivided into an upper zone containing the three molars implanted in an alveolar bone, whereas in the lower part the basal bone encircled the incisor. The proximal part included endochondral-derived domains: the angular, condylar and coronoid processes. The dark brown color indicates that this area is thinner and consequently less mineralized than the rest of the mandible.
Figure 6 : Volume rendering visualization showing the different regions of a mandible
With this qualitative analysis of the mineralization distributions, we globally conclude that a severe hypomineralization was induced in KOFM mice. An example of this qualitative difference is shown in Figure 7 :
Fig 7: Volume rendering visualization of the mandibles of a KOFM (left) and a control mouse (right). The KOFM mandible showed reduced mineralization in the condyl (posterior) part of the mandible,
alveolar bone area (around the roots of the molars) and in the basal bone around the incisor
In details, the main target for genetic deficiency was the proximal part of the mandible including condylar, coronoïd and angular processes, which was less dense KOFM compared with the WT. This was also detectable in the alveolar bone (upper middle) but became undetectable in the basal and rostral parts of the mandible.
Volume rendering of the whole mandible in a sagittal orientation bring principally two results : i) that the mandible is a mosaic formed by different domains with an unequally distributed thickness and mineralization pattern and ii) the proximal and alveolar parts of the mandible constitute the specific targets in KOFM mice.
Moreover, transverse virtual slices across the mandible allowed to analyze the inner structure of the alveolar bone surrounding the molar roots. The virtual slices, through the junction of the first and second molars, were similar and even more accurate than those obtained with scanning electron microscopy, e.g. revealing the detailed range of mineralization defects of the alveolar bone owing to the color code as illustrated in Figure 8.
Fig 8: Comparison of 2D slices across the mandible using scanning microscopy (left) and micro-CT (right). Micro-CT images allowed precise visualization of hypomineralized areas in KOFM slices, rivalizing
with scanning microscopy
The marrow spaces of the medulla (trabecular zone) were larger in the KOFM mice compared with the WT. No difference was noted for the cortices. Therefore, bone hypomineralization was associated with the enlargement of endosteous spaces. There was no spontaneous repair or rescue of this phenotype during the aging process, at least for the period of time studied.
3.2 Quantitative results on molars
The segmentation method allowed the 3D reconstruction and quantification of the entire pulp chamber volume of molars. As described in Figure 9, KOFM mice showed a statistically significant larger volume in as compared to control mice thus revealing for the first time a defect in dentinogenesis. Moreover, several morphological changes, as for example the length of the roots, were reported but were not quantified (Figure 9 on right).
Fig 9: Statistical results of pulp chamber volumes comparison (left) and 3D reconstruction (right) of pulp chamber volumes of KOFM (grey) and control mice (yellow)
4. CONCLUSIONS
This new method is highly powerful for the study of oro-facial mineralization defects in mice models, complementary and even competitive to current histological and scanning microscopy approaches.
This methodolgy constitutes a new tool for the study of mineralization defects in genetically modified mice, providing rapid and high resolution imaging and quantitative correlates of the phenotypic alterations and comparison with wild type control mice.
ACKNOWLEDGEMENTS
This research was supported by the IRP Program of the NIDCR/NIH and by the Fondation de l’Avenir, Etude N° ETO-576.
REFERENCES
[1] L. Ameye, M.F. Young, "Mice deficient in small leucine-rich proteoglycans: novel in vivo models for osteoporosis, osteoarthritis, Ehlers-Danlos syndrome, muscular dystrophy, and corneal diseases", Glycobiology 12, 107–116 (2002)
[2] M. Goldberg, D. Septier, A. Oldberg, M.F. Young, L.G. Ameye, "Fibromodulin-deficient mice display impaired collagen fibrillogenesis in predentin as well as altered dentin mineralization and enamel formation", Journal of Histochem Cytochem 54, 525-537, (2006)
[3] M. Ito, "Assessment of bone quality using computed tomography (CT) and synchrotron micro-CT", Journal of Bone and Mineral Metabolism 23, 115-121 (2005)
[4] B. Koller, A. Laib, "Calibration of micro-CT data for quantifying bone mineral and biomaterial density and microarchitecture", Advanced Bioimaging Technologies in Assessment of the Quality of Bone and Scaffold Materials, Part I, I-1, 79-84 (2007)
[5] R. A. Drebin, L. Carpenter, P. Hanrahan, "Volume rendering", SIGGRAPH Comput. Graph. 22, 4 (June 1988), 65-74. DOI=10.1145/378456.378484 http://doi.acm.org/10.1145/378456.378484
[6] ITK, Insight Toolkit, www.itk.org
[7] J. A. Meganck, K. M. Kozloff, M. M. Thornton, S. M. Broski, S. A. Goldstein, "Beam Hardening Artifacts in Micro-Computed Tomography Scanning can be Reduced by X-ray Beam Filtration and the Resulting Images can be used to Accurately Measure BMD", Bone 45(6), 1104–1116 (2009)