ISSH
2 ‘2017
*Corresponding author email:
[email protected]CFD Study of Methane-Hydrogen Behavior in a Non-Premixed Combustion
Chamber
M. E. H. Attia1*, A. Boukhari2, F. Bouras1 and Z. Driss3
1* Department of Physics, Faculty of Science, University of El Oued, 39000 El Oued, Algeria.
2 Department of Mechanical Engineering, Faculty of Technology, University of El-Oued, 39000 El-Oued, Algeria. 3
Laboratory of Electro-Mechanic Systems (LASEM), ENIS, University of Sfax, Tunisia.
Abstract—In this paper, the numerical results of the study of a turbulent flame of methane-hydrogen/air generated by a cylindrical burner are presented. The numerical simulations are carried out using the CFD code "FLUENT" and "Gambit" for the meshing process. The finite volume method was used to solve the Navier-Stokes equations governing the flow. The coupling of the LES/PDF models is used to model the turbulence/chemistry interaction in the system's transport equations. The results of the calculations are expressed and analyzed in terms of axial velocity, temperature and mass fraction of carbon monoxide CO. The results of the numerical calculations are compared and validated against experimental data. In addition, the same parameters considered above are used in the study of the combustion behavior of CH4/H2 fuels. The obtained results
confirm the fact of considering hydrogen as a clean non-polluting fuel compared to methane, since it has no carbon monoxide emissions in combustion products. Besides this fact, the hydrogen gas velocity in the flame is significantly higher by comparing it to the methane gas velocity.
Key words— Non-Premixed Combustion; Turbulence; Hydrogen; Methane; CFD Simulation.
I. INTRODUCTION
Today, with increasing concerns about the reduction of energy production and protection of the environment, research on alternative fuels has been widely studied in recent years by a large number of researchers. In addition, the increasingly rigorous regulation of CO2 emissions on
the one hand and the depletion of fossil fuel reserves on the other have prompted the scientific community to find alternatives to these fuels. Indeed, the increase in the car fleet has led to an increase in the consumption of conventional fuels, which are responsible for the continuous increase in emissions of pollutants. Research in the fields of fuel quality and combustion will lead to a gradual reduction of pollutant emissions, increased environmental protection and improved living conditions. The addition of hydrogen to methane has an effect on reducing the ignition time of the mixture and increasing the ignition advance and reducing pollution [1].
In this context, natural gas offers many economic and environmental benefits. It is mainly made up of methane, natural gas at lower levels of pollutant emissions compared to other fossil fuels. With regard to carbon dioxide, the combustion of natural gas generates respectively 30 to 40% less than oil and coal with the same amount of energy consumed. However, emissions of
pollutants from natural gas combustion can be reduced. An interesting alternative is to substitute hydrogen for part of the natural gas, creating a less polluting hybrid fuel. This solution is a first step towards a hydrogen economy in order to gradually adapt infrastructures, standards and regulations as well as inform and prepare the public [2]. Evatt et al. [3] used the Direct Numerical Simulation to study the effects of H2 enrichment on lean
premixed methane–air flames. They found that lower CO emissions per unit fuel consumption are observed for the enriched flame, consistently with experimental data [3]. In their experimental work, Akansu et al. [4] considered to control the effect of a spark ignition engine of mixtures of hydrogen and methane. Although, they obtained the test results for a four-cylinder engine with mixtures of hydrogen in methane of 0, 10, 20 and 30% by volume. Showing that NO emissions increase, HC, CO and CO2
emission amounts decrease with increasing hydrogen percentage.
The main objective was the numerical simulation of non-premixed turbulent combustion in a cylindrical combustion chamber supplied by methane-hydrogen/air. We used the commercial CFD code FLUENT. Three parameters are considered: the average axial velocity, the temperature and the mass fraction of the carbon monoxide CO. In the first step, we validate the coupling of the large eddy simulation (LES) models and the probability density function (PDF) approach [5,6] with the experimental data in the same stations and the same conditions. The results show that the select models give a satisfactory agreement with all the regions considered. In the second step, the same parameters considered previously are used in the study of the combustion behavior of methane-hydrogen fuels. The two CH4-H2 fuels are compared to choose the
least carried out on the environment.
II. BURNER CONFIGURATION
The configuration which confines the combustion chamber is given in figure 1. The cylindrical combustion chamber, presenting a radius R4=61.15 mm and a length L=1 m, is supplied by two coaxial jets CH4
or H2/air. The central jet presents an internal radius equal
to R1=31.57 mm and an outer radius R2=031.75 mm, in order to inject methane or hydrogen with an inlet mass flow rate Q1=7.2 g/s at a temperature T1=300 K. The annular jet has an internal radius equal to R3=46.85 mm, which injects air with an inlet mass flow equal to Q2=137
ISSH
2 ‘2017
*Corresponding author email:
[email protected]g/s and a preheated temperature T2=750 K. The chamber of combustion is pressurized by a value equal to p=3.8 atm and to a constant temperature wall equal to T=500 K [5,6]. In the aim to present and compare our results we have carried out the simulations based on the normalization of length (x-position) and velocity using characteristic values, i.e. injector radius (R≡R3) and inlet air velocity (U ≡V2).
Fig. 1 Schematic presentation of the burner III. GOVERNING EQUATIONS
In this paper, we studied the behavior of non-premixed turbulent combustion in three dimensions using numerical simulation. The governing equations for the compressible flow can be written in Cartesian coordinates as summarized in Table 1.
Table 1: Governing equations.
In these equations, the unresolved Reynolds stresses )
~ ~
(uiuj uiuj require a subgrid scale turbulence model. The unresolved species fluxes (uiYf u~iY~f) and the enthalpy fluxes (uihu~ih~) require a probability density function (PDF) approach. The filtered chemical reaction rate is characterized by f .
The LES models and the PDF approach explained and detailed in previous work [5,6].
IV. RESULTS AND DISCUSION
Firstly, we have validated our trend to couple the LES models and the PDF approaches against the experimental data [6] at same stations and for same conditions. Secondly, we have exploited the same parameters considered previously to study the combustion behaviour of methane-hydrogen fuels.
1. Numerical Validation 1.1 Axial Velocity
Comparison of the predicted radial profiles of the mean axial velocity with the experimental data in the stations x/R=0.14 and x/R=4.67 are presented in figure 2. In fact, the numerical and experimental profiles have almost the same tendency. Thus, the mean relative gap between the numerical calculations and the experimental reference data [6] is about 7%, which is almost acceptable in combustion applications. The high values of the axial velocity are located in the center of the burner presented by the peaks in the x/R=0.14 and x/R=4.67 stations. In the last station x/R=4.67, the difference between the numerical profile and the experimental profile may be due to the fact that the fully developed methane and air intake conditions were assumed in the simulations. However, in the experiment, the inlet flow devices were located only a short distance upstream of the burner. In the two recirculation regions shown in schematic presentation of the burner (figure 1), the negative axial velocity values are observed due to turbulence. The first region located at the fuel jet is due to the delay of the generated flow. However, for the second region it is caused by the sudden change between the conditions of entry of coaxial jets (CH4/Air). 0,0 0,2 0,4 0,6 0,8 1,0 1,2 1,4 -0,2 0,0 0,2 0,4 0,6 0,8 1,0 1,2 r/R u / U (a) x/R=0.14 0,0 0,2 0,4 0,6 0,8 1,0 1,2 1,4 0,0 0,2 0,4 0,6 0,8 1,0 1,2 r/R u / U (b) x/R=4.67
Fig. 2 Radial profiles of average axial velocity, ___ Simulation, • Experiment [6] 1.2 Temperature
Figure 3 shows the comparison of the radial profiles of the mean temperature obtained by the numerical simulation of the coupled LES/PDF models and the experimental data considered in reference [6], for the same stations defined by x/R=1.57 and x/R=4.52. Numerical and experimental profiles have almost the same tendency. The mean relative gap between the numerical calculations and the experimental data is about 10% which concedes satisfactory agreement between
Description Equation Continuity ( ~)0 i i u x t Momentum i ij j j i j i i j i i i x x p u u u u x u u x t u )] ~ ~ ( [ ) ~ ~ ( ~ Energy ij j i i i i i i u x t p h u h u x h u x h t )] ~ ~ ( [ ) ~ ~ ( ~ Species f f i f i i f i i f uY uY x Y u x Y t )] ~ ~ ( [ ) ~ ( ~ Thermo-dynamic state T R p m~
ISSH
2 ‘2017
*Corresponding author email:
[email protected]simulations and experiments. The high temperature values are located around the flame zone and begin to decrease with the radial distance to reach the temperature of the cooling isothermal wall at T=500 K. The shear layers which are in the same zone where fuel and air meet. The shear zone is created to improve the mixing of the two coaxial jet streams (CH4/Air) to supply the combustion
chamber with a rich mixture. Furthermore, the apex based on the temperature profiles is attenuated downstream of the burner. As a result, this disagreement is due to regions with high temperature fluctuations and to the difficulty of perfectly ensuring the conditions of experience of the walls. 0,0 0,2 0,4 0,6 0,8 1,0 1,2 1,4 400 600 800 1000 1200 1400 1600 1800 2000 r/R T (K) (a) x/R=1.57 0,0 0,2 0,4 0,6 0,8 1,0 1,2 1,4 600 800 1000 1200 1400 1600 1800 2000 2200 2400 r/R T(K) (b) x/R=4.52
Fig. 3 Radial profiles of average temperature, ___ Simulation, • Experiment [6] 1.3 Mass Fraction of Carbon Monoxide CO
Figure 4 illustrates the comparison of the numerical and experimental radial profiles of the mass fraction of carbon monoxide CO for different stations of the burner defined by x/R=0.21 and x/R=3.84. In fact, the numerical calculations of the CO mass fraction significantly present a good agreement with the experimental data [6]. The gap between the numerical results and the experimental data is about 5%. The high values of the CO mass fraction located in the center of the combustion chamber decrease as they move away from the burner center. The radial profiles of the mass fraction of CO have the same tendency with the radial temperature profiles which explain the high CO values in the reaction zone (the flame zone). This zone is rich and reactive and produces monoxide of carbon CO. In the first station x/R=0.21, the CO values are low compared to the second station x/R=3.84. Turbulence is caused by the mixing effect of fuel and air, which allows their mixing and combustion to produce CO with high values.
0,0 0,2 0,4 0,6 0,8 1,0 1,2 1,4 -0,02 0,00 0,02 0,04 0,06 0,08 0,10 r/R YCO (a) x/R=0.21 0.0 0.2 0.4 0.6 0.8 1.0 1.2 1.4 -0.02 0.00 0.02 0.04 0.06 0.08 0.10 0.12 0.14 0.16 0.18 0.20 r/R YCO (b) x/R=3.84
Fig. 4 Radial profiles of average CO mass fraction, ___ Simulation, • Experiment [6]
2. Comparison of H2 and CH4 Fuels
2.1 Axial Velocity
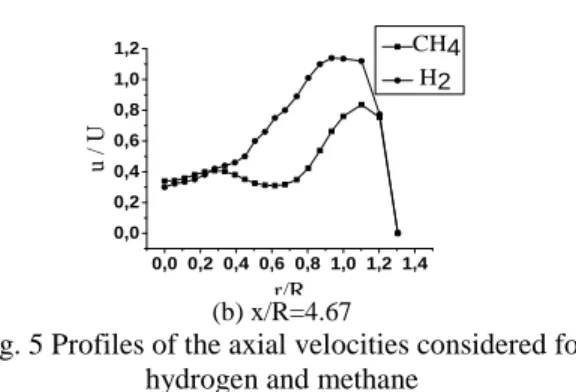
Figure 5 illustrates the comparison between the mean axial velocity of H2 and CH4 in different stations, defined
by x/R=0.14 and x/R=4.67, in a three-dimensional combustion chamber. These profiles are characterized by peaks in the stations. The numerical profiles of H2 and
CH4 have almost the same tendency especially in the first
station, and the values of axial velocity of hydrogen elevated with respect to the methane velocity especially in the last station. The values of rate of hydrogen velocity are greater than 1. In these conditions, the values of the velocity of the H2 are high in the middle of the
combustion chamber compared with the speed of CH4.
Thus, we can also see the H2 speed profiles completely
applicable on the profiles of the CH4 near the burner walls
in both stations. Indeed, it has been observed that the velocity of hydrogen is greater than the speed of methane almost the molar mass of hydrogen is less than the molar mass of methane. 0,0 0,2 0,4 0,6 0,8 1,0 1,2 1,4 -0,2 0,0 0,2 0,4 0,6 0,8 1,0 1,2 u / U r/R CH4 H2 (a) x/R=0.14
ISSH
2 ‘2017
*Corresponding author email:
[email protected] 0,0 0,2 0,4 0,6 0,8 1,0 1,2 1,4 0,0 0,2 0,4 0,6 0,8 1,0 1,2 u / U r/R CH4 H2 (b) x/R=4.67Fig. 5 Profiles of the axial velocities considered for hydrogen and methane
2.2 Temperature
Figure 6 shows the distribution of the average temperature of hydrogen and methane. The radial temperature profiles for the two fuels have the same tendency, are presented by the peaks in the stations defined by x/R=1.57 and x/R=4.52. The temperature high values are in the flame zone for both H2 and CH4 fuels, as
this area is the same area of chemical reactions. The positions of the peaks in all stations move at the jet of air for the case of hydrogen, with a slight increase compared to the values of the temperature of the methane. In the middle of the combustion chamber, the values of the temperature of the methane is equal to T=1200 K and decreases at the value of the hydrogen temperature until T=600 K, in both stations. The observed shift of CH4 and
H2 temperatures obtained by calculations is owed to the
molar masses difference between theses fuels, since the chemical composition is the key parameter in rising combustion temperatures. 0,0 0,2 0,4 0,6 0,8 1,0 1,2 1,4 200 400 600 800 1000 1200 1400 1600 1800 2000 2200 T (K) r/R CH4 H2 (a) x/R=1.57 0,0 0,2 0,4 0,6 0,8 1,0 1,2 1,4 200 400 600 800 1000 1200 1400 1600 1800 2000 2200 2400 T (K) r/R CH4 H2 (b) x/R=4.52
Fig. 6 Profiles of the temperatures considered for hydrogen and methane
2.3 Mass Fraction of Carbon Monoxide CO
The curve of the numerical calculation of the CO mass fraction of methane is presented in figure 4. The curve of the hydrogen profiles is a straight line of the form yco=0
applicable to the x-axis. The results clearly illustrate that the fuel CO values of hydrogen are zero and are quite
important for methane fuel. Whereas in the center of the combustion chamber, the values of the mass fraction of CO are high for the fuel CH4, equal to yco=0.06 for the
first station x/R=0.21. Indeed, it is observed that the quantity of carbon monoxide is double for the second station x/R=3.84 and is characterized by yco=0.12. The
CO mass fraction values decrease with the radial distance.
V. CONCLUSION
In this paper, we have presented the results obtained by numerical simulations using CFD code FLUENT tools in non-premixed turbulent combustion fueled by two methane-hydrogen/air fuels. The main results obtained in this study:
- The results give a satisfactory agreement between the numerical calculations of the coupled LES/PDF models and the experimental data.
- The emission of carbon monoxide is non-existent for combustion of hydrogen in the combustion chamber at all monitoring stations but exists for methane.
- Generally, a certain temperature discrepancy between the studied fuels was observed in different stations, which can be owed to the molar masse role played in combustion flame temperatures.
- The hydrogen velocity is faster than that of methane since the molar mass of hydrogen is smaller than methane.
With these results, we can confirm the fact that hydrogen is better than methane when used as fuel, because it is cleaner and less harmful to the environment. REFERENCES
[1] A. Mameri. “Etude numérique De la combustion turbulente du prémélange pauvre méthane/air enrichi a l'hydrogène,” Ph.D. dissertation, Univ., Orléans, France 2009.
[2] A. Rakib. “Valorisation du méthane en hydrogène par reformage catalytique,” Ph.D. dissertation, Univ., Littoral Cȏte d'Opale, France 2012.
[3] Evatt R. Hawkes and Jacqueline H. Chen. “Direct numerical simulation of hydrogen-enriched lean premixed methane– air flames,” Combustion and
Flame, vol. 138, pp. 242–258, 2004.
[4] S. Orhan Akansu, N. Kahraman, and B. Çeper. “Experimental study on a spark ignition engine fuelled by methane–hydrogen mixtures,” Int Journal
of Hydrogen Energy, vol. 32, pp. 4279 – 4284, 2007.
[5] F. Bouras, M.E.H. Attia, F. Khaldi and M. SI-AMEUR. “Control of the Methane Flame Behavior by the Hydrogen Fuel Addition: Application to Power Plant Combustion Chamber,” Int Journal of
Hydrogen energy, vol. 42, pp. 8932- 8939, 2017.
[6] C.D. Pierce and P. Moin, “Progress-variable approach for large-eddy simulation of non-premixed turbulent combustion,” Journal of Fluid Mechanics, vol. 504, pp. 73-97, 2004.
![Figure 3 shows the comparison of the radial profiles of the mean temperature obtained by the numerical simulation of the coupled LES/PDF models and the experimental data considered in reference [6], for the same stations defined](https://thumb-eu.123doks.com/thumbv2/123doknet/7834891.262124/2.918.558.770.538.866/comparison-profiles-temperature-numerical-simulation-experimental-considered-reference.webp)
![Fig. 4 Radial profiles of average CO mass fraction, ___ Simulation, • Experiment [6]](https://thumb-eu.123doks.com/thumbv2/123doknet/7834891.262124/3.918.557.755.849.1002/fig-radial-profiles-average-mass-fraction-simulation-experiment.webp)
![[PDF] Télécharger guide installation Windows 2008 Serveur PDF](data:image/gif;base64,R0lGODlhAQABAIAAAP///wAAACH5BAEAAAAALAAAAAABAAEAAAICRAEAOw==)