https://doi.org/10.4224/17506218
READ THESE TERMS AND CONDITIONS CAREFULLY BEFORE USING THIS WEBSITE.
https://nrc-publications.canada.ca/eng/copyright
Vous avez des questions? Nous pouvons vous aider. Pour communiquer directement avec un auteur, consultez la
première page de la revue dans laquelle son article a été publié afin de trouver ses coordonnées. Si vous n’arrivez pas à les repérer, communiquez avec nous à PublicationsArchive-ArchivesPublications@nrc-cnrc.gc.ca.
Questions? Contact the NRC Publications Archive team at
PublicationsArchive-ArchivesPublications@nrc-cnrc.gc.ca. If you wish to email the authors directly, please see the first page of the publication for their contact information.
Archives des publications du CNRC
For the publisher’s version, please access the DOI link below./ Pour consulter la version de l’éditeur, utilisez le lien DOI ci-dessous.
Access and use of this website and the material on it are subject to the Terms and Conditions set forth at Development and Implementation of autoMOTAN: Installations on the CCGS Henry Larsen and M/T Véga Desgagnés
Johnston, M.
https://publications-cnrc.canada.ca/fra/droits
L’accès à ce site Web et l’utilisation de son contenu sont assujettis aux conditions présentées dans le site LISEZ CES CONDITIONS ATTENTIVEMENT AVANT D’UTILISER CE SITE WEB.
NRC Publications Record / Notice d'Archives des publications de CNRC: https://nrc-publications.canada.ca/eng/view/object/?id=043b5b73-03fc-4a51-a7ac-79ef0a6651c9 https://publications-cnrc.canada.ca/fra/voir/objet/?id=043b5b73-03fc-4a51-a7ac-79ef0a6651c9
TP 14386E
Development and Implementation of autoMOTAN:
Installations on the CCGS Henry Larsen
and M/T Véga Desgagnés
M. Johnston
Technical Report, CHC-TR-069
March 2005
TP 14386E
Development and Implementation of autoMOTAN:
Installations on the CCGS HENRY LARSEN
and M/T Véga Desgagnés
M. Johnston
Canadian Hydraulics Centre National Research Council of Canada
Montreal Road Ottawa, Ontario K1A 0R6
Prepared for: Transport Canada 11th Fl. Place de Ville, Tower C
330 Sparks Street Ottawa, Ontario K1A 0N8
Technical Report, CHC-TR-069
Abstract
MOTAN, an inertial motion measurement system developed by the National Research Council’s Canadian Hydraulics Centre, has been used to measure ice-induced global impact forces on ships since the year 2000. Past measurements have shown that MOTAN measures whole-ship motions reliably, and that those motions can be used to determine global impact forces on ships with reasonable accuracy. This report documents more recent efforts to develop an autonomous MOTAN (autoMOTAN), i.e. a system that operates unattended during a ship’s entire operating season. The installation of the autoMOTAN on the CCGS Henry Larsen and M/T Véga
Desgagnés is described. Analysis of the data measured by the autoMOTAN, in terms of the
global loads, is currently underway. Those data will be included in subsequent report to provide statistical information about the magnitude and frequency of the global loads experienced by a ship during its operating season.
Table of Contents Abstract ... i List of Figures ... v List of Tables ... v 1.0 Introduction... 1 2.0 Background ... 1 3.0 MOTAN: Description ... 2 3.1 MOTAN Sensor ... 3
3.2 Ship Motion Software: MOTAN10 ... 3
3.3 Global Impact Force Software: EFM... 3
4.0 AutoMOTAN: Rationale for its Development ... 5
5.0 AutoMOTAN: Development and Implementation ... 5
6.0 CCGS Henry Larsen: First Installation of AutoMOTAN ... 7
6.1 Catching up with the CCGS Henry Larsen... 9
6.2 Installing the autoMOTAN on ‘Henry Larsen’ ... 10
6.3 Ice Conditions Encountered during the Trials ... 12
6.4 First Week of March: Signature Event ... 14
6.5 Continuing Observations in Support of autoMOTAN... 14
6.6 Experience Gained from First Installation of autoMOTAN ... 15
7.0 M/T Véga Desgagnés: Second Installation of AutoMOTAN... 15
7.1 Rigel Shipping’s M/T Emerald Star?... 16
7.2 Desgagnés Group’s M/T Véga Desgagnés ... 16
8.0 Recommendations... 19
9.0 Conclusions... 19
10.0 Acknowledgments... 20
11.0 References... 20 Appendix A: Henry Larsen Impact Events Logged by Coast Guard ... A-1
List of Figures
Figure 1 Schematic of MOTAN ... 2
Figure 2 Approaches used to calculate resultant forces at... 4
Figure 3 Autonomous MOTAN system... 6
Figure 4 CCGS Henry Larsen alongside a multi-year floe in the high Arctic ... 8
Figure 5 Study area along the Northeast Coast of Newfoundland, 3 to 7 March 2004... 10
Figure 6 AutoMOTAN system on Henry Larsen ... 11
Figure 7 Location of MOTAN on Henry Larsen... 11
Figure 8 Typical ice conditions encountered by Henry Larsen from 4 to 6 March 2004 ... 13
Figure 9 Floe impacted on 6 March 09:05 hours... 14
Figure 10 M/T Véga Desgagnés ... 17
Figure 11 AutoMOTAN on the M/T Véga Desgagnés... 17
Figure 12 Routes taken by Véga Desgagnés from 8 February to 16 March 200... 18
List of Tables
Table 1 Details of CCGS Henry Larsen ... 8Development and Implementation of autoMOTAN:
Installations on the CCGS Henry Larsen
and M/T Véga Desgagnés
1.0
Introduction
This report describes the development and implementation of the autonomous MOTAN system. MOTAN is an inertial measurement system that has been used to determine ice-induced global forces on three Coast Guard icebreaking ships. During those three field installations, personnel on the bridge used a hand-held trigger to start logging data from MOTAN when the ship entered ice conditions that would likely produce an ice impact “event”.
Over the past two years, efforts have focused upon developing a MOTAN system that could operate unattended. This report describes the basic principles of the newly developed autonomous MOTAN (autoMOTAN) system. The autoMOTAN is capable of measuring the ship motions during an entire operating season, yet provides the ability to efficiently process the large volume of data that is recorded by the system. Details of the first and second installations of the autoMOTAN system, on the CCGS Henry Larsen and the M/T Véga Desgagnés respectively, are provided. Analysis of the data measured by the autoMOTAN, in terms of the global ice impact forces, is currently underway. Those data will be included in subsequent report.
2.0
Background
MOTAN is an inertial measurement system that measures the whole-ship motions of a ship in six degrees of freedom. Those measured ship motions can be used to calculate global impact forces using specially developed software. Since 2000, MOTAN has been installed on a number of rigid icebreaking vessels. The first full-scale installation of the system was on USCGC Healy, in April 2000 (Johnston et al., 2001-a). In October 2000, MOTAN was installed on CCGS Louis S.
St-Laurent (Johnston et al., 2001-b; 2003), and in June 2001 the system was installed on CCGS Terry Fox (Johnston et al, 2004). Results from those three installations were used to examine the
viability of using MOTAN for measuring global impact forces, and to obtain detailed information about the ice conditions that caused an “event’.
The first three MOTAN deployments provided a level of detail that allowed global loads on ships to be examined on a case-by-case basis. However, it is also of interest to have information
about the global loads that a ship can expect during an operating season. That requires having a larger volume of data, from which to obtain statistical information about the global impact loads, and the frequency with which they occur. Using the current MOTAN system to acquire such a large volume of data has two limitations: (a) personnel could not be devoted to the MOTAN system for an entire operating season and (b) it would not be feasible to examine such a large amount of data on a case-by-case basis. A new MOTAN system needed to be developed, if the intention was to obtain statistical information about ice impact loads – a system that was capable of operating autonomously.
3.0
MOTAN: Description
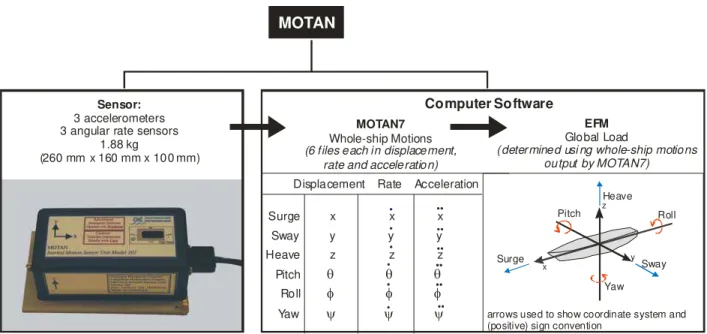
MOTAN (for MOTion ANalysis) is an inertial measurement system that was developed by the Canadian Hydraulics Centre (CHC) of the National Research Council of Canada (Miles, 1986). The MOTAN inertial measurement system was designed to measure the motions of ships and floating structures in a wave basin or towing tank, however the system has undergone extensive modifications since its conception. In 2000, the first full-scale deployment of MOTAN was made, with the intention of using the measured ship motions to calculate ice-induced global impact forces. Since that time, CHC has devoted considerable effort to establishing the system as a viable means of measuring global loads on ships, and making modifications to the system, when required. Figure 1 shows the updated components of MOTAN. The system is a two part package that includes (i) a portable, lightweight instrument to measure ship motions in six degrees of freedom and (ii) computer software to process the measured ship motions.
MOTAN
Rate Acceleration Sensor:
3 accelerometers 3 angular rate sensors
1.88 kg (260 mm x 160 mm x 100 mm) Computer Software Displacement Surge x x x Sway y y y Heave z z z Pitch θ θ θ Roll φ φ φ Yaw ψ ψ ψ x y zHeave Pitch Roll Yaw Sway Surge
arrows used to show coordinate system and (positive) sign convention
MOTAN7 Whole-ship Motions
(6 files each in displacement, rate and acceleration)
EFM Global Load
(determined usi ng whole-ship motions output by MOTAN7)
3.1 MOTAN Sensor
The MOTAN sensor is a small, lightweight unit (Figure 1) that can be either clamped or bolted to any conveniently located structural support on the ship. Its three accelerometers and three rate sensors measure respectively the ship’s total acceleration, including earth’s gravity component, and its three-dimensional angular rotational rate. Six analog voltage signals from MOTAN are recorded by a standard data acquisition system, each of which is resolved along the instantaneous positions of the X, Y and Z body-axes of the ship. MOTAN is equipped with a low-pass hardware filter to remove vibrations higher than 5 Hz, since those frequencies are not characteristic of the ship’s global response to impacts.
3.2 Ship Motion Software: MOTAN10
A number of changes have been made to the motion software MOTAN6 since it was developed to calculate the motions of model-scale ships. In the year 2000, MOTAN7 was developed to analyze measurements from USCGC Healy, which was the first full-scale installation of the MOTAN system (Johnston et al., 2001-a). Since then, MOTAN7A has been developed and has been used to calculate the transient ship motions of CCGS Louis S. St-Laurent (Johnston et al., 2003) and CCGS Terry Fox (Johnston et al., 2004). More recently, MOTAN9 and MOTAN10 were developed to eliminate the spurious oscillations in the coupled motions caused by impact-generated changes in ship speed. MOTAN9 is used to calculate whole-ship motions for short impact records (less than about 30 seconds) and MOTAN10 is appropriate for longer records such as those recorded by the autonomous MOTAN.
The MOTAN software can be used to compute whole-ship motions at any point on the ship, regardless of where the sensor has been installed, provided the ship behaves as a rigid body. To do this, the ship must qualify as a rigid body. Johnston et al. (2004) used data from two MOTAN sensors on the CCGS Terry Fox to show that rotational rates and global accelerations in the bow of the Terry Fox were comparable to those near the centre of gravity. It was concluded that since icebreakers satisfy the rigid body requirement, MOTAN can be used to reliably determine ship motions at points other than where the instrument was installed. It also raised the question of whether MOTAN could be used to reliably calculate global forces on less rigid ships such as petroleum tankers. The installation of autoMOTAN on the M/T Véga
Desgagnés (described later) sought to address this question.
3.3 Global Impact Force Software: EFM
In the year 2000, the software called HPF (for Heave, Pitch Force) was developed, as a first approach, to calculate vertical impact forces on the USCGC Healy using only the heave and pitch motions output by MOTAN7 (Johnston et al., 2000). The HPF software was feasible for calculating global forces from symmetrical impacts, but it was not able to calculate impact forces from oblique collisions (where sway, roll and yaw motions are important). In 2002, software called EFM (for Exciting Forces and Moments) was developed to compute global impact forces from the entire suite of whole-ship motions that were output from MOTAN7A (Figure 1). As such, EFM is appropriate for both symmetrical and oblique impacts.
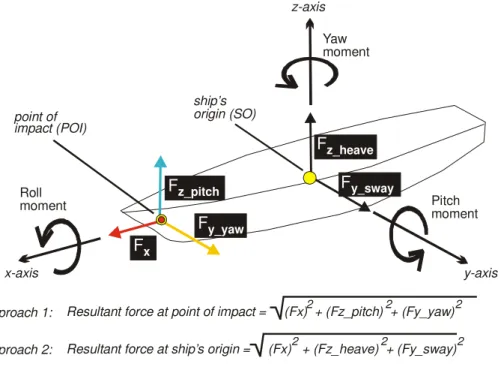
The EFM software uses the six linear coupled differential equations included in Salvesen et al. (1970) and McTaggert (1997) to calculate three global exciting forces and three global exciting moments at the ship’s origin. EFM can be used to calculate the resultant impact force using the two different approaches shown in Figure 2. Approach 1 is used to calculate the impact force at the point of impact, using the component forces F_x, F_z_pitch and F_y_yaw. The longitudinal impact force (F_x) is calculated from the surge acceleration only, and is the same everywhere along the longitudinal axis of the ship. The vertical force (F_z_pitch) and lateral (F_y_yaw) force are calculated by dividing the pitch and yaw moments respectively by the moment arm (the longitudinal distance from the ship’s origin to the point of impact). Approach 2 is used to calculate impact forces at the ship’s origin, using F_x, F_z_heave and F_y_sway. Unlike the first approach, the second approach does not require information about the impact location.
x-axis ship’s origin (SO) y-axis z-axis Fz_heave Fz_pitch Fy_yaw Fy_sway Pitch moment Roll moment Yaw moment point of impact (POI) Approach 1: Approach 2: Fx 2 2 2
Resultant force at ship’s origin = (Fx) + (Fz_heave) + (Fy_sway)
2 2 2
Resultant force at point of impact = (Fx) + (Fz_pitch) + (Fy_yaw)
Figure 2 Approaches used to calculate resultant forces at (a) point of impact and (b) ship’s origin
Calculating exciting forces and moments with the EFM software requires having information about the ship’s characteristics, hydrodynamic coefficients and hydrostatic coefficients. McTaggert (1997) describes those coefficients in greater detail. The coefficients, which depend upon ship speed and ship motion frequency, have been determined for a wide range of frequencies, at operational speeds from 1 to 12 kn (0.5 to 6.2 m/s). To date, the hydrodynamic coefficients have been developed for USCGC Healy and CCGS Louis S. St-Laurent.
4.0
AutoMOTAN: Rationale for its Development
The MOTAN system functioned very well on Healy, Louis and Terry Fox, however each of those installations required that the data acquisition system for MOTAN be activated remotely from the bridge using a hand-held trigger, when conditions warranted. As the ship entered ice that was likely to cause a loading “event”, personnel on the bridge sent a signal to the data acquisition system to begin logging data. Events noted from the bridge had supporting observations about the ice conditions that caused the event and a description of how the ship responded to the impact. Thus, the advantage to that approach was that it provided the full compliment of information for the analysis procedure. The disadvantage to that approach is that it is not always possible, or convenient, to have personnel on the bridge attending to the MOTAN system; a limitation that became apparent when the intent was to use MOTAN to measure global loads during an operating season.
Clearly, a MOTAN system that operated autonomously was needed. The so-called ‘autonomous MOTAN’ would record data throughout a ship’s entire operating season, to gather statistical information about the ice-induced global impact forces on ships. It was recognized that examining events on a case-by-case basis would not be a feasible approach for obtaining statistical information about ice loads because it would be extremely labor intensive.
If MOTAN was to be used to record data for an extended period, it would require modification. The basic principles of the MOTAN system would remain the same (it would function as an inertial measurement system), but its data acquisition system would need to be upgraded. Since the system would operate continuously for several months at a time, it would require the capacity to store large volumes of data. In addition, because there would not be personnel to check on the system, the autonomous MOTAN would need to restart automatically, should power to the unit fail at any time.
5.0
AutoMOTAN: Development and Implementation
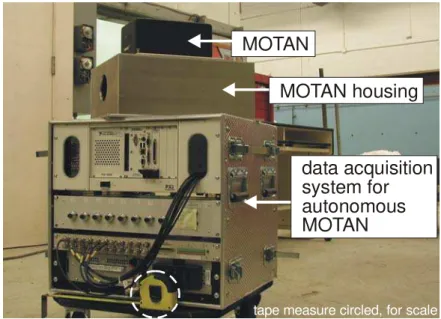
The past two years of work have focused upon developing and implementing a new MOTAN system that functions autonomously. The autonomous system would need to record ship motions for the duration of the transit – from the time that it is installed, to when it is removed. Figure 3 shows the self-contained autonomous MOTAN system that was developed in 2003. For illustrative purposes, the MOTAN sensor and its aluminum housing have been placed on top of the data acquisition system. Normally, the MOTAN sensor is installed at a suitably stiff location (typically at the centre of gravity) at some distance from the data acquisition system.
MOTAN
tape measure circled, for scale
MOTAN housing
data acquisition system for autonomous MOTAN
Figure 3 Autonomous MOTAN system
Developing an autonomous MOTAN required making a number of changes to the existing system.
• the data acquisition system was upgraded to allow data to be collected continuously for
several months
• the large volume of data was stored on both a hard drive and an external back-up system
• the autonomous MOTAN could restart automatically, should power to the unit fail at any
time
• the data acquisition system components needed to be housed in a self-contained unit that
could be easily installed at a convenient location on a ship.
The MOTAN software would also require modification. Because the autonomous MOTAN would collect reams of data, identifying impact events on a case-by-case basis would no longer be possible. Software would need to be developed to process a large volume of data efficiently. In February 2005, CHC developed a “peak detection routine” for incorporation into the MOTAN software package (M. Miles, personal communication). The routine was written to scan the raw data collected by the autonomous MOTAN system, and to identify possible ice impact events of interest. Four records from the Louis S. St-Laurent Trials (October 2000) were used to develop the event detection routine. Data from the Louis were selected for developing the peak detection routine because they provided a record of when events should be detected (backing and ramming operations in second-year and multi-year ice), as opposed to conditions that should not result in ice impact loads (open water and young first-year ice). In addition, all of the events logged on the Louis had supplementary information about the ice conditions, ship speed and qualitative information about how the ship responded to the impact (Johnston et al., 2001-b).
The peak detection routine facilitates event identification because it ‘flags’ each time a specific threshold is exceeded. The routine is based upon a nondimensional resultant ship acceleration function (a weighted average of the surge, roll, pitch and yaw accelerations). The routine depends upon only the raw body-axes sensor signals measured by the MOTAN senor unit; processing of the raw ship motions using MOTAN10 is not required to run the peak detection routine.
A considerable amount of data logged during the ship’s operating season would not be of interest. Since MOTAN is not appropriate for calculating wave-induced global forces, “events” in open water could be eliminated. Similarly, vibrations created by the ship backing in ice-covered waters sometimes produces spurious “events”. Work is currently underway to develop a procedure to help differentiate ‘authentic’ ice impact loads, from artifacts produced by ship operations in open water and/or ship maneuvering in ice/water.
To date, the autonomous MOTAN has been installed on two ships: CCGS Henry Larsen and the M/T Véga Desgagnés. Following is a description of those two installations. Since analysis of data from the autonomous MOTAN is still a ‘work-in-progress’, global impact forces for those two ships will be presented in a future report.
6.0
CCGS Henry Larsen: First Installation of AutoMOTAN
The newly developed autoMOTAN was tested in the winter/spring of 2004. The objective of the 2004 field season was to install the autoMOTAN on a ship, allow it to run continuously for a period of about one week, and then remove it. Personnel stationed on the bridge would be able to indicate when an ice impact “event” occurred, by pressing a button on a hand-held unit and sending a signal (or event marker) to the data acquisition system. The purpose of an event marker was to use it to validate impacts identified by the “peak detection routine” that was described previously.
The ship selected for the 2004 field trials would need to be accessed easily, and should have a number of places at which to disembark from the ship. In March 2003, personnel from CHC had spent time on CTMA Group’s Voyageur (Frederking and Kubat, 2003) documenting the ice regimes encountered by the ship as it transited waters near the Magdalen Islands, Quebec. It was thought that the autoMOTAN could be installed on the Voyageur in the winter of 2004, however that was not possible because of scheduling problems.
Having eliminated the option of installing the autoMOTAN on a ship that operated in ice-covered waters close to CHC’s office in Ottawa, it was decided to contact Canadian Coast Guard about installing the autoMOTAN on one of their icebreaking ships, recognizing that the Coast Guard has been instrumental in past MOTAN work. Consultation with the Regional Operations Centre of the Canadian Coast Guard (Newfoundland Region) led to the CCGS Henry Larsen (Figure 4) being selected for the first installation of the autoMOTAN. Table 1 lists some of the particulars of the Henry Larsen. She is a 99.8 m long, Arctic Class 4 ship, and has a displacement of 7508 t. The Henry Larsen operates off the east and west coasts of Newfoundland from about December to June, at which time she is fitted for Arctic operations. Her icebreaking duties include (primarily) keeping various bays ice-free/navigable, conducting
search and rescue operations, assisting boats and ships in distress, and supporting science projects. Since assisting science was part of their mandate, the Canadian Coast Guard was very agreeable to providing the Larsen as a platform on which to operate the autoMOTAN.
Table 1 Details of CCGS Henry Larsen
Design Particularsa
Ice Class Arctic Class 4
Length overall 99.8 m Breadth 19.6 m Tonnage, gross 6166.5 t Tonnage, net 1756.6 t Draft 7.6 m Freeboard 3.8 m Power (kW) 12174 Particulars on 03 March 2004b: Displacement 7508 t Draft 6.74 m LCG,
longitudinal centre of gravity, aft of amidships
1.11 m VCG,
vertical center of gravity, above keel
6.36 m
a design particulars obtained from http://www.ccg-gcc.ca/vessels-navires-dimensions
b stability data provided by Chief Engineer of Henry Larsen
6.1 Catching up with the CCGS Henry Larsen
Having received approval to install the autMOTAN on Henry Larsen, it was necessary to determine a period during which the author and a fellow colleague could board the Larsen to install the system, ensure that it functioned properly, and note when significant impacts occurred. Observations from the bridge enabled the peak detection routine to be evaluated in terms of how often it correctly identified ice impacts. The test period was selected by taking three factors into account (a) the work should inconvenience the Coast Guard as little as possible, (b) the work should involve a considerable amount of icebreaking activity, and (c) the ice conditions for that area should be at their “worst”, ideally. Based upon those requirements, the beginning of March was selected for the implementation phase of the autoMOTAN.
According to the Coast Guard schedule, personnel from CHC could board the Henry Larsen on 3 March, and disembark from the ship four days later, on 7 March. The Coast Guard could provide a general idea of where the ship could be boarded, for planning purposes, but they would not be able specify the exact location until 1 March (two days before the ship was to be boarded). Such is the nature of icebreaking operations: the ship goes where, and when, it is needed.
On 1 March, the Coast Guard informed CHC that the Henry Larsen could be boarded in North Sydney, Nova Scotia on 3 March. Airline tickets were purchased from Ottawa to Sydney for 2 March. The field party from CHC arrived at the Sydney airport on the afternoon of 2 March. Before making the short trip from Sydney to North Sydney (where the ship was to be docked), a phone call was placed to Coast Guard office in St. John’s. “There had been a change in plans”: the ship was no longer in North Sydney, but was instead headed back to St John’s, Newfoundland! The field party could meet the Henry Larsen the following morning, 3 March, after she docked in St. John’s. Thankfully, the call had been placed before leaving the airport – there was still time to catch the last flight of the day from Sydney, Nova Scotia to St. John’s, Newfoundland.
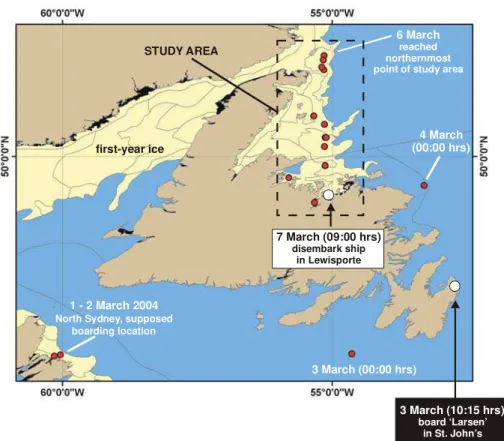
The Henry Larsen docked in St. John’s at 09:50 hours on 3 March. Realizing that she could be called away again, at any time, the field party was there to board the ship as soon she docked. That afternoon, the ship departed for Notre Dame Bay, where she was needed to clear first-year ice. Figure 5 shows the location of the ship, as it traveled from North Sydney, to St John’s. The ship’s location was obtained from coordinates in the ship’s log (at 00:00 hours each day), as well as the sporadic notes that were made by personnel from CHC1.
1
A continuous record of the ship’s track and its speed was not available during the Henry Larsen trials, since a global positioning system had not been installed on the bridge as part of the program. That was rectified when the autoMOTAN was installed on the Véga Desgagnés.
1 - 2 March 2004 North Sydney, supposed
boarding location STUDY AREA first-year ice 3 March (00:00 hrs) 4 March (00:00 hrs) 6 March reached northernmost point of study area
3 March (10:15 hrs) board ‘Larsen’ in St. John’s 7 March (09:00 hrs) disembark ship in Lewisporte
Figure 5 Study area along the Northeast Coast of Newfoundland, 3 to 7 March 2004
6.2 Installing the autoMOTAN on ‘Henry Larsen’
Typically, the MOTAN sensor unit is installed at some convenient location, as close to the ship’s centre of gravity as possible. MOTAN software calculates the rigid body motions of the ship at its centre of gravity. The so-called ship’s origin (intersecting planes through the longitudinal centre of gravity and ship’s waterplane) is also the reference point for the global exciting forces and moments output by the software.
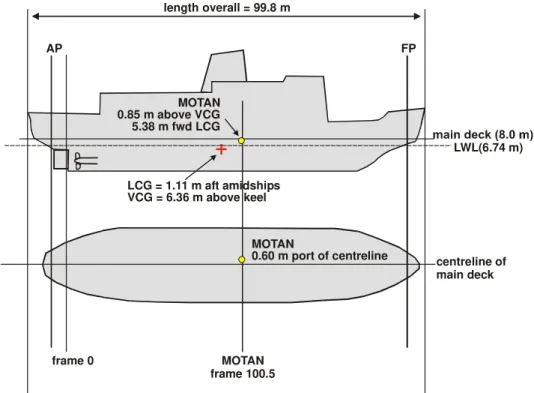
Consultations with Commanding Officer Vanthiel and his Chief Engineer indicated that, given those requirements, the most suitable place for the MOTAN would be in the engine casing area of the ship, between frames 100 and 101. Its data acquisition system could be installed in a nearby work area, room 249B. Figure 6 shows the MOTAN (clamped to an I-beam in the engine casing area) and the data acquisition system (in an adjacent room). Figure 7 shows the approximate location of the MOTAN, which was 0.85 m above the vertical centre of gravity, 5.38 m forward of the longitudinal centre of gravity and 0.60 m port of the ship’s centreline.
MOTAN clamped to I-beam in engine casing area,
below main deck
Data acquisition system for autoMOTAN , installed in a nearby work area
(a) MOTAN (b) data acquisition system
Figure 6 AutoMOTAN system on Henry Larsen
LWL(6.74 m) centreline of main deck MOTAN frame 100.5 MOTAN 0.60 m port of centreline MOTAN 0.85 m above VCG 5.38 m fwd LCG LCG = 1.11 m aft amidships VCG = 6.36 m above keel frame 0 AP FP length overall = 99.8 m
6.3 Ice Conditions Encountered during the Trials
The objective of the field trials was to measure ship motions in different ice conditions. Continuously logging data would provide the information needed to determine how well the autoMOTAN system registered impact forces in different scenarios, and how well the peak detection routine identified those impacts. Having discussed the objectives of the research program with Commanding Officer Vanthiel, it was suggested that the ship travel along the northeast coast of Newfoundland in search of various ice types: level first-year ice in Notre Dame Bay and/or White Bay, brash and pancake ice, loosely consolidated pack ice, and closely-spaced deformed ice. It is interesting to note that icebreaking operations off the coast of Newfoundland and Labrador can be considerably more difficult, and challenging, than operating in the high Arctic (Captain Broderick, personal communication).
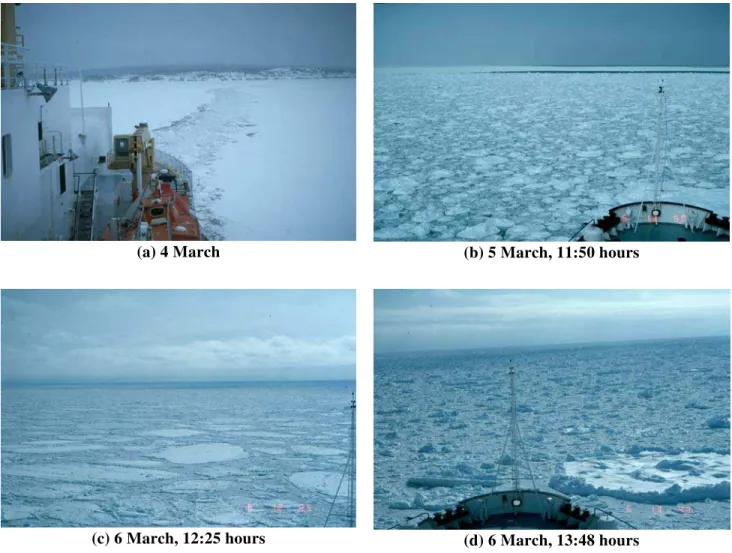
Data from the autoMOTAN were logged continuously from March until May, as the ship transited the ice-covered waters off Newfoundland and the Gulf of St. Lawrence. Figure 8 shows representative photographs of some of the ice conditions encountered during that first week of March. The photos give some indication of the ice conditions observed in early March, but they do not completely convey the spatial and temporal non-uniformity of the ice that was transited – ice conditions along the northeast coast of Newfoundland changed frequently. Nor do the photographs in Figure 8 show the multitude of bergy bits and icebergs often seen in the ice matrix.
In general, the Larsen experienced minimal ship motions as it cleared the thin first-year ice from Notre Dame Bay on 4 March (Figure 8-a). The ice was too thin to produce considerable ship response. As the ship traveled further north, on 5 March, the ship passed through an ice cover that consisted of brash ice and small pancake floes (Figure 8-b). In the early morning hours of 6 March, the ship reached the northernmost extent of its search and rescue area, just south of Belle Island, and shut down until daybreak (Figure 5).
As the ship traveled south on 6 March, it passed through a relatively small area of large, level floes at 12:25 hours (Figure 8-c). Minutes later (12:30 hours), the ship was again surrounded by heavily deformed thick first-year ice floes. On occasion, the Larsen encountered floes that had a substantial amount of freeboard, such as the one shown to the right of the ship in Figure 8-d. That particular floe was likely a piece of multi-year ice from floe that had fragmented previously. Figure 8-e shows that, by the late afternoon of 6 March, the Larsen was again traveling through loosely consolidated first-year ice floes.
At 08:00 hours on 7 March, the ship docked at Lewisporte, Nfld. where there was only a limited amount of thin first-year ice. The field party was instructed to disembark from the ship as quickly as possible, since the Henry Larsen could be called away at any time. Departing from the ship was not straightforward. No taxis were operating in Lewisporte, because a blizzard was raging. Walking to the hotel was not possible because it was several kilometres away from where the ship was docked. Thankfully, one of the crew members of the Larsen had “connections” in Lewisporte – arranging for the author and her colleague to be picked up as soon as they departed from the ship, and taken to their hotel.
(a) 4 March (b) 5 March, 11:50 hours
(c) 6 March, 12:25 hours (d) 6 March, 13:48 hours
(e) 6 March, 17:51 hours
6.4 First Week of March: Signature Event
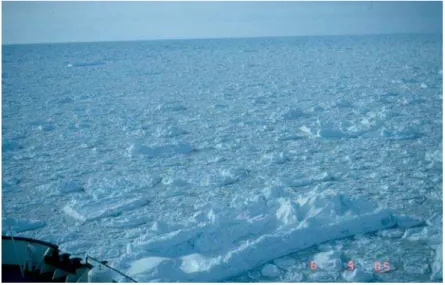
On 6 March at 09:05 hours, a substantial impact was felt on the bridge on the starboard side of the ship. Judging from the sound that the impact produced, the ship contacted the floe about mid-way along its starboard side. Figure 9 shows the elongated floe of thick first-year ice just before it was impacted. The floe was about 25 m long, and heavily deformed. Unfortunately, information about the ship speed is not available before, or during the impact. The closest observation of ship speed was made at 09:16 hours, at which time the Henry Larsen was transiting at 9.5 kn. This should prove to be one of the signature ‘events’ of the ice impact analysis.
Figure 9 Floe impacted on 6 March 09:05 hours
6.5 Canadian Coast Guard: Continuing Observations in Support of autoMOTAN
The CHC field party departed the Henry Larsen on 7 March. It was decided to continue logging data from the autoMOTAN until she docked in St. John’s in mid-May. Since personnel from CHC would not be on the bridge to document the events, Captain Vanthiel was approached about the possibility of having one of the crew members use the hand-held trigger to signal “significant” impacts. When Captain Vanthiel asked if that was all that was needed, it was suggested that having information about the date, time, ship speed and ice type would also be useful. Captain Vanthiel was willing to have one of his crew members do this, whenever possible – and he would pass the request on to Captain Broderick when the crews changed partway through the operating season. Thanks to the efforts of the CCGS Henry Larsen crew, a total of 49 events were documented from 8 March to 6 May, the details of which are included in Appendix A. Most of those events were logged in medium to thick first-year ice, some of which was rafted, at ship speeds from 9 to 15 kn.
6.6 Experience Gained from First Installation of autoMOTAN
The autonomous MOTAN functioned well from March to May 2004, continuously measuring the ship motions for 1796 hours. Global ice impact forces from the trials have yet to be processed. Presently, the hydrodynamic coefficients for the CCGS Henry Larsen and the M/T
Véga Desgagnés (described next) are being developed. These coefficients are required to
calculate global exciting forces and moments for the two ships. To date, the coefficients have only been developed for the USCGS Healy, the CCGS Louis S. St-Laurent and the CCGS Terry
Fox.
Experience showed that the autoMOTAN system would benefit from having a global positioning system. First, GPS data could be used to determine the ship speed, which is required for calculating global impact forces. Second, the information could be used to superimpose the ship’s track on the Canadian Ice Service’s Ice Charts, thereby providing basic information about (a) when the ship was in ice vs. open water and (b) the type of ice. Coast Guard personnel noted the ice conditions and ship speed for a number of impact events, but that information is not available for the hundreds of other impacts that occurred in the spring of 2004.
7.0
M/T Véga Desgagnés: Second Installation of AutoMOTAN
MOTAN has proven viable for measuring global forces on rigid ships such as icebreakers, but could the system also be used for less rigid, ice-strengthened commercial ships? The second phase of the autoMOTAN implementation was designed to answer that question.
The search for an appropriate commercial ice-strengthened ship on which to install autoMOTAN made use of contacts established while presenting MOTAN data at a conference in Montreal, in 2003. At the time, Mr. C. King, the Director of Operations for Petro-Nav Inc., had been enthusiastic about using MOTAN to measure impact forces on less rigid ships. In December 2004, Mr. King was contacted about the possibility of installing autoMOTAN on one of its chartered strengthened, double-hulled tankers. Petro-Nav, Inc. sub-charters three ice-classed, double-hulled chemical/oil tankers from Rigel Shipping Canada (Halifax), and four other tankers owned by Groupe Desgagnes (Quebec). Petro-Nav was amenable to the MOTAN project, with the corollary that specifics of the installation must be discussed and approval from all parties obtained. Mr. King would speak to Rigel Shipping and the Desgagnés Group.
Having installed MOTAN on icebreakers in the past, CHC had little information about what would be required to install the system on a petroleum products tanker. It soon became apparent that installing the system on a tanker would require considerably more work than any of the previous four installations on Coast Guard ships. A number of challenges had to be addressed before the autoMOTAN could be installed on a petroleum products tanker. First, the system needed to be installed on a ship that transited ice-covered waters. Second, since there would not be room for CHC personnel onboard the ship, the autoMOTAN would need to be installed while the ship was docked at a convenient location. Installing the autoMOTAN on the CCGS Henry
Larsen had provided a taste of how difficult it could be to catch-up with a ship – the Petro-Nav
Inc. tankers would prove to be even more elusive. The system would need to be installed when the ship docked in Montreal, since that port was only two hour’s drive from Ottawa, and could be accessed on short notice.
The greatest challenge, by far, was finding an area on the petroleum products tanker where autoMOTAN could be safely installed and operated. Finding a location for autoMOTAN was not straightforward because much of the ship is zoned as intrinsically safe. While MOTAN is not likely to generate sparks, neither is the system certified as intrinsically safe (certification would be a costly procedure).
7.1 Rigel Shipping’s M/T Emerald Star?
Initially, it was thought that the Rigel Shipping’s M/T Emerald Star would be a suitable ship on which to install autoMOTAN. For several weeks, Rigel Shipping and CHC corresponded about where autoMOTAN could be installed on the M/T Emerald Star. Eventually, CHC was informed that MOTAN could not be installed anywhere near the ship’s bow because it was designated as an intrinsically safe area. The ship’s stern was the only place on the M/T Emerald
Star where the autoMOTAN could be installed, since it was one of the few areas not designated
as intrinsically safe. The ship’s stern was not a very attractive place to install autoMOTAN because the 10,000 t tanker would be transiting first-year ice, which likely would produce marginal ship motions in the stern (at best). It should be noted that Rigel Shipping’s hesitance at installing autoMOTAN anywhere other than the ship’s stern was completely understandable, given that the MOTAN had not been certified as intrinsically safe.
7.2 Desgagnés Group’s M/T Véga Desgagnés
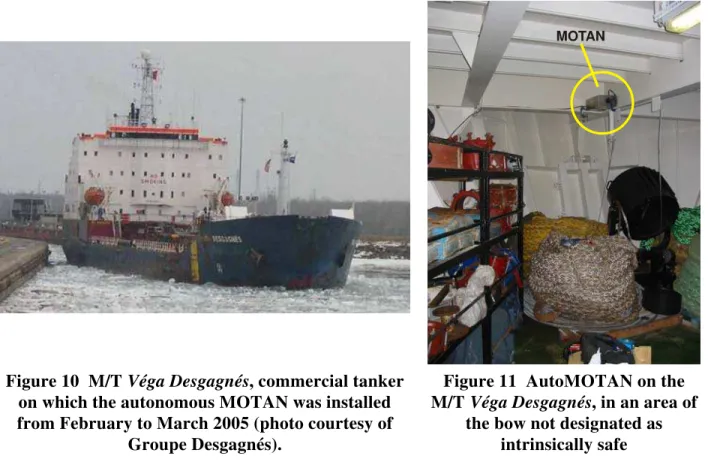
The M/T Véga Desgagnés (11,299 t) was the other petroleum products tanker that was explored for Phase II of the autoMOTAN implementation process. The 140.8 m long ice-strengthened ship is considerably less rigid than the four icebreakers on which MOTAN has been previously installed. With Petro-Nav Inc.’s assistance, it was decided that the M/T Véga Desgagnés (Figure 10) would be the most suitable ship for autoMOTAN, since it was scheduled to make a number of transits through the Gulf of St. Lawrence that season.
Initially, it was suggested that autoMOTAN be installed in the ship’s stern (since that area was not designated as intrinsically safe). That was not an optimal location because motions there would have been severely attenuated, as mentioned previously. Fortunately, one area in the bow of the M/T Véga Desgagnés (below the forecastle deck) was also outside the intrinsically safe area. After consultation with Petro-Nav, Groupe Desgagnés and Transport Canada, it was agreed that autoMOTAN could be safely installed and operated in that area of the bow.
The idea of installing two MOTAN sensors on the M/T Véga Desgagnés was also explored, since that would provide a measure of the ship’s rigidity (as was done on the CCGS Terry Fox). That was not be possible, since two MOTAN sensors would require running cables topside, through intrinsically safe areas.
Due to the limited space and time available, the autonomous MOTAN would need to be installed on the ship quickly, while she was docked in Montreal or Québec City and before she transited the Gulf of St. Lawrence. The autonomous MOTAN was installed on the M/T Véga Desgagnés on 8 February 2005, when she docked in Montreal for the day. Since the absence of GPS data
was found to be an issue during the 2004 CCGS Henry Larsen installation, the autoMOTAN was equipped with an independently operated GPS system in preparation for the M/T Véga
Desgagnés installation. Figure 11 shows autoMOTAN perched at the junction of two I-beams in
an area of the bow of the M/T Véga Desgagnés that was not designated as intrinsically safe. The autoMOTAN system was removed from the M/T Véga Desgagnés on 19 March 2005, after the ship docked in Québec City. A total of 929 hours of data on the ship’s motions and position were collected as the M/T Véga Desgagnés transited between Québec, Newfoundland and Nova Scotia. Figure 12 shows the GPS recorded ship’s track from 8 February to 16 March 2005. The ship routing is superimposed on modified Regional (weekly) Ice Charts to provide an indication of when the ship was in ice, and when it was in open water. In the absence of bridge observations, Ice Charts provide the best information about the ice conditions through which the ship navigated. However, the most valuable information with which to corroborate MOTAN data came from a discussion with Captain Dionne of the M/T Véga Desgagnés. For instance, Captain Dionne described the difficult ice conditions the ship encountered from rafted first-year ice north of Anticosti Island (on 24/25 February, Leg 2) and as the ship passed through ice south of Anticosti Island (on 13/14 March, Leg 6).
MOTAN
Figure 10 M/T Véga Desgagnés, commercial tanker on which the autonomous MOTAN was installed from February to March 2005 (photo courtesy of
Groupe Desgagnés).
Figure 11 AutoMOTAN on the M/T Véga Desgagnés, in an area of
the bow not designated as intrinsically safe
Figure 12 Routes taken by Véga Desgagnés from 8 February to 16 March 2005, overlain on modified Regional (weekly) Ice Charts.
8.0
Recommendations
It is recommended that, whenever possible, future installations of autoMOTAN include a GPS feed that is hardwired directly into its data acquisition system, thereby avoiding the difficulty of synchronizing files with (independent) time-stamps. It is realized that equipping the autoMOTAN with its own GPS system is extremely difficult, since running an antenna outside the ship to where the MOTAN is installed near the centre of gravity is extremely difficult, particularly for temporary installations. Installations of autoMOTAN on Coast Guard vessels are beneficial in this respect, because the ship’s GPS can be hardwired directly into the MOTAN system.
It would also be of interest to explore the option of using a forward-looking camera, mounted above the bridge, to take photographs as needed. The benefit here, is that the photographs can be used to validate the peak detection routine and to document the type of ice features that cause the most significant ice impact events. This would require the camera to be ‘triggered’ to take a short video or picture each time MOTAN logged a significant impact. Analysis of the data sets from the CCGS Henry Larsen and the M/T Véga Desgagnés should be concluded before further modifications to MOTAN are made.
9.0
Conclusions
The installation of the autoMOTAN on the CCGS Henry Larsen and M/T Véga Desgagnés showed that the system functioned well, continuously logging ship motions and writing them to individual, hour-long data files. Future work will involve continued efforts to validate MOTAN using data from independent load measurement systems. Work will continue in the area of using the autonomous MOTAN to provide statistical information about the global loads likely to be experienced by a ship during an operating season. That work has been underway for the past two years, as the autonomous MOTAN has been installed on the CCGS Henry Larsen and the M/T Véga Desgagnés. Should the analysis show that MOTAN is appropriate for measuring impact forces on ice-strengthened commercial ships (as has been shown for Coast Guard icebreakers), the MOTAN system would have a much broader application.
10.0 Acknowledgments
Sincere appreciation is extended to V. Santos-Pedro of Transport Canada for his interest and support in developing and implementing MOTAN for the past six years. The success of the field measurements would not have been possible without the cooperation of the Canadian Coast Guard, and their willingness to have MOTAN installed on three of their icebreakers. A warm thanks for the interest, enthusiasm and participation of the Captains & Crew of the CCGS Henry
Larsen. Genuine thanks to C. King of Petro-Nav Inc., Groupe Desgagnés, Captain Dionne &
Crew of the M/T Véga Desgagnés for their willingness, flexibility and cooperation in allowing the autonomous MOTAN to function (unattended) on their ship. Tremendous thanks to NRC-CHC’s Mr. Daniel Pelletier’s for his assistance in developing and testing autoMOTAN. He has offered his expertise for many years. The assistance of NRC-CHC’s Mr. Chad Green is much appreciated during the voyage of the CCGS Henry Larsen. M. Miles has been instrumental in helping develop software and hardware for MOTAN for a number of years.
11.0 References
Johnston, M., Frederking, R. and G. Timco (2000) Whole-ship Motions of the USCGC Healy 2 April to 15 May 2000, NRC-CHC Technical Report HYD-TR-060, December 2000, 58 p. Johnston, M., Timco, G., Frederking, R. and M. Miles (2001-a) Whole-Ship Motions of USCGC
Healy as Applied to Global Ice Impact Forces. Proceedings 16th International Conference on Port and Ocean Engineering under Arctic Conditions, POAC’01, pp 955-964, Ottawa, Canada.
Johnston, M., Frederking, R. and Timco, G.W. (2001-b). Whole-Ship Motions and Accelerations at the Stern of the CCGS Louis S. St. Laurent, October 2000 Ice Trials. NRC Report HYD-TR-062, July, 2001,Ottawa, Ont., Canada, 25 p.
Johnston, M., Frederking, R., Timco, G.W. and Miles, M. (2003) MOTAN: A Novel Approach for determining Ice-Induced Global Loads on Ships. Proceedings MARI-TECH 2003, Montreal, QC, Canada.
Johnston, M., Frederking, R., Timco G. and Miles, M. (2004) Using MOTAN to Measure Global Accelerations of the CCGS TERRY FOX During Bergy Bit Trials. Proceedings 23rd International Conference on Offshore Mechanics and Arctic Engineering, OMAE’04, Vancouver, Canada, Paper OMAE2004-51239.
McTaggart, K. (1997) An Improved Strip Theory Program for Ship Motions and Sea Loads in Waves. 4th Canadian Marine Hydromechanics and Structures Conference (SNAME), Ottawa, June, 1997.
Miles, M. (1986) Measurement of Six Degrees of Freedom Model Motions using Strapdown Accelerometers. Proceedings of the 21st American Towing Tank Conference, Washington, D.C., Aug. 1986. pp. 369 - 375.
Salvesen, N., Tuck, E.O., and Faltinsen, O. (1970) Ship Motions and Sea Loads. Transactions, Society of Naval Architects and Marine Engineers, Vol. 78, pp. 250-287.
Event no. Date Time (local) Speed (kts) Ice Description Pan Size (m) 1 8-Mar-04 1108 15 Tk FYI 10 2 8-Mar-04 1817 10 Tk FYI 8 3 11-Mar-04 2109 12 Tk FYI 10 4 12-Mar-04 2227 11.5 Tk FYI 10 5 12-Mar-04 108 12.6 Tk FYI 8 6 12-Mar-04 120 11.5 Tk FYI 6 7 16-Mar-04 150 12 Tk FYI 6 8 19-Mar-04 200 12 Tk FYI 6 9 23-Mar-04 2102 13 Tk FYI 10 10 24-Mar-04 1755 9 Tk FYI 20 11 24-Mar-04 1910 Md FYI 10 - 20 12 24-Mar-04 1128 15 Tk FYI 10 13 25-Mar-04 842 13 Tk FYI 20 14 29-Apr-04 1425 15 Tk FYI 10 15 29-Apr-04 1620 12 Tk FYI 10 16 29-Apr-04 1227 16 Tk FYI 20 17 30-Apr-04 1908 9 Tk FYI 15 - 20
18 30-Apr-04 1914 9 Tk FYI, rafted 25 - 30
19 30-Apr-04 1918 10 Tk FYI, rafted 20 - 30
20 30-Apr-04 1949 8 Tk FYI 25
21 30-Apr-04 923 15 Md FYI, rafted 15
22 30-Apr-04 925 14 Tk FYI 25
23 30-Apr-04 1022 15 Md FYI 20
24 30-Apr-04 1033 15 Tk FYI 30
25 30-Apr-04 1100 15 Tk FYI, rafted 30 - 40
26 30-Apr-04 1107 14 Tk FYI, rafted 75 - 100
27 30-Apr-04 1107 8 Tk FYI, rafted 25-35
28 30-Apr-04 1110 10 Tk FYI, rafted 50-75
29 30-Apr-04 1120 14 Tk FYI 30-40
30 30-Apr-04 1953 14 Tk FYI 25
31 1-May-04 2013 10 Tk FYI, rafted 25-35
32 1-May-04 1225 10 Tk FYI 75-100
33 1-May-04 1228 10 Tk FYI 25-35
34 2-May-04 1545 15 Tk FYI 25-30
35 2-May-04 420 9 Tk FYI 20
36 2-May-04 728 9 Tk FYI 25-30
37 2-May-04 803 11 Tk FYI, rafted 25-30
38 2-May-04 832 14 Tk FYI 20-25
39 2-May-04 1300 10 Tk FYI 20
40 2-May-04 1305 10 Tk FYI 20
41 2-May-04 1310 11.5 Tk FYI 20
42 4-May-04 1520 15 Tk FYI 20-30
43 5-May-04 1615 16 Tk FYI 20-Oct
44 6-May-04 947 13 Tk FYI, rafted 30
45 6-May-04 950 15 Tk FYI, rafted 20-30
46 6-May-04 1345 10 Tk FYI 25-30
47 6-May-04 1400 13 Tk FYI 20-30
48 6-May-04 1410 12 Tk FYI 125-20