HAL Id: hal-02533605
https://hal.archives-ouvertes.fr/hal-02533605
Preprint submitted on 6 Apr 2020
HAL is a multi-disciplinary open access
archive for the deposit and dissemination of
sci-entific research documents, whether they are
pub-lished or not. The documents may come from
teaching and research institutions in France or
abroad, or from public or private research centers.
L’archive ouverte pluridisciplinaire HAL, est
destinée au dépôt et à la diffusion de documents
scientifiques de niveau recherche, publiés ou non,
émanant des établissements d’enseignement et de
recherche français ou étrangers, des laboratoires
publics ou privés.
Deep Learning on Chest X-ray Images to Detect and
Evaluate Pneumonia Cases at the Era of COVID-19
Karim Hammoudi, Halim Benhabiles, Mahmoud Melkemi, Fadi Dornaika,
Ignacio Arganda-Carreras, Dominique Collard, Arnaud Scherpereel
To cite this version:
Karim Hammoudi, Halim Benhabiles, Mahmoud Melkemi, Fadi Dornaika, Ignacio Arganda-Carreras,
et al.. Deep Learning on Chest X-ray Images to Detect and Evaluate Pneumonia Cases at the Era of
COVID-19. 2020. �hal-02533605�
Deep Learning on Chest X-ray Images
to Detect and Evaluate Pneumonia Cases
at the Era of COVID-19
Karim Hammoudi
1,2,∗1Universit´e de Haute-Alsace
Department of Computer Science, IRIMAS F-68100 Mulhouse, France
2Universit´e de Strasbourg ∗Corresponding author
karim.hammoudi@uha.fr
Halim Benhabiles
33UMR-8520–IEMN, Univ. Lille
CNRS, YNCREA-ISEN Lille F-59000, France halim.benhabiles@yncrea.fr
Mahmoud Melkemi
1,21Universit´e de Haute-Alsace
Department of Computer Science, IRIMAS F-68100 Mulhouse, France
2Universit´e de Strasbourg
mahmoud.melkemi@uha.fr
Fadi Dornaika
4,5, Ignacio Arganda-Carreras
4,54University of the Basque Country
Department of Computer Science & Artificial Intelligence 20018 San Sebasti´an, Spain
5IKERBASQUE, Basque Foundation for Science
48011 Bilbao, Spain
fadi.dornaika@ehu.eus, ignacio.arganda@ehu.eus
Dominique Collard
6,76LIMMS/CNRS-IIS UMI 2820
Institute of Industrial Science The University of Tokyo 4-6-1 Komaba Meguro Ku
Tokyo 153-8505, Japan
7CNRS/IIS/COL/Lille 1 SMMiL-E project
CNRS D´el´egation Nord-Pas de Calais et Picardie 2 rue des Canonniers Lille, Cedex 59046, France dominique.collard@yncrea.fr
Arnaud Scherpereel
88University of Lille
CHU Lille, Inserm U1189 - ONCO-THAI
F-59000 Lille, France arnaud.scherpereel@chru-lille.fr
Abstract—Coronavirus disease 2019 (COVID-19) is an infec-tious disease with first symptoms similar to the flu. COVID-19 appeared first in China and very quickly spreads to the rest of the world, causing then the 2019-20 coronavirus pandemic. In many cases, this disease causes pneumonia. Since pulmonary infections can be observed through radiography images, this paper inves-tigates deep learning methods for automatically analyzing query chest X-ray images with the hope to bring precision tools to health professionals towards screening the COVID-19 and diagnosing confirmed patients. In this context, training datasets, deep learn-ing architectures and analysis strategies have been experimented from publicly open sets of chest X-ray images. Tailored deep learning models are proposed to detect pneumonia infection cases, notably viral cases. It is assumed that viral pneumonia cases detected during an epidemic COVID-19 context have a high probability to presume COVID-19 infections. Moreover, easy-to-apply health indicators are proposed for estimating infection status and predicting patient status from the detected pneumonia cases. Experimental results show possibilities of training deep learning models over publicly open sets of chest X-ray images towards screening viral pneumonia. Chest X-ray test images of COVID-19 infected patients are successfully diagnosed through detection models retained for their performances. The efficiency of proposed health indicators is highlighted through simulated scenarios of patients presenting infections and health problems by combining real and synthetic health data.
Index Terms—image detection, radiology, X-ray, COVID-19.
I. INTRODUCTION
COVID-19, initially named 2019-nCoV, appeared first in China and very quickly spreads to the rest of the world causing then the 2019-20 coronavirus pandemic. To date (April 5th 2020), there have been 82,602 highly controversial confirmed cases in China, more than 500,000 confirmed cases in Europe and 1,226,644 confirmed cases all around the world1.
1Online map of COVID-19 Global Cases by the CSSE center at Johns
Hopkins University: https://coronavirus.jhu.edu/map.html
In many cases, this disease causes pneumonia. Character-istics of such an infection can be observed by radiologists. Also, deep learning methods can be helpful for operating deep analysis on query radiography images. Thanks to artificial intelligence, early stage and precision diagnosis can be done. In this pandemic, the effective screening of COVID-19 is an arduous task in practice. Standard screening test kits called Reverse Transcription-Polymerase Chain Reaction (RT-PCR) are often unavailable. Moreover, the RT-PCR test is highly sensitive. It was found that deep-based Computed Tomography (CT) images analysis could be more reliable than RT-PCR test in early-stage diagnostic [1]–[3]. Notably, where RT-PCR test can turn out negative, deep CT image analysis can already predict true positives in certain cases. False negatives to RT-PCR test can lead to non-negligible propagation of this disease. At this time, American College of Radiology recommenda-tions for the use of chest radiography and CT for Suspected COVID-19 infection [4] point that generally, the findings on chest imaging in COVID-19 are not specific, and overlap with other infections, including influenza, H1N1, SARS and MERS. Notably, being in the midst of the current flu season with a much higher prevalence of influenza in the U.S. than COVID-19, further limits the specificity of CT. Besides, the use of radiography equipment requires high disinfection needs after each use which can make massive tests laborious and time-consuming. In practice, for hygienic reasons, chest X-rays are often frontally taken with patients on a stretcher or bed, lying down or at best sitting. Such constraints often conduct to chest X-rays with poor quality and real issues in term of analysis.
Nevertheless, CT images of lung and chest X-ray images offer additional data for screening COVID-19. Notably, AI technology is already deployed in China for radiography examination and radiomics-like analysis from CT images [5]. AI technology can also facilitate remote operations and help to face the lack of expert radiologists. At this date, many AI tools and radiography image datasets are private resources. The access to publicly open COVID-19-related sets of lung CT images towards conducting deep learning experiments is relatively limited. Some open access X-ray image sets of chest are publicly available.
The goal of this paper is twofold: i) to present deep learning models tailored for detecting pneumonia infection cases such as viral cases towards screening COVID-19, ii) to propose easy-to-apply health indicators for evaluating detected pneumonia infection cases with an estimator of infection and predictions of patient status. This case study is presented with the aim of supporting radiologists and other clinicians. In no case this preliminary study could be substituted to a medical advice.
The remaining of the paper is organized as follows. The next section gives an overview of related works. Section 3 presents some investigated deep learning based image detec-tion architectures and analysis strategies. Secdetec-tion 4 shows a set of experiments to evaluate the performance of the considered architectures and section 5 concludes the paper.
II. RELATED WORK
Image analysis and machine learning techniques already have extensive applications in precision health. Currently, mul-tiple and varied COVID-19-related studies are conducted in order to highlight proof of concepts and scientific truths about this misunderstood disease. Some image detection, evaluation and making-decision techniques related to COVID-19 and radiography examinations are described hereafter.
In [2], Xu et al. present a case study that deals with the COVID-19 screening from CT images. They mention that the COVID-19 manifests its own characteristics that differ from other types of viral pneumonia, such as Influenza-A viral pneumonia. The study aims to establish an early screening model for COVID-19 by automatically analyzing collected pulmonary CT images of COVID-19, Influenza-A viral pneumonia and healthy cases (618 transverse-section CT samples before data augmentation). The overall accuracy of the deep learning models were 86.7% for these three groups. First CT images were preprocessed for extracting effective pul-monary regions. Second, a 3D Convolutional Neural Network (CNN) model was used to segment multiple candidate regions (patches). In particular, the VNET [6] based segmentation model VNET-IR-RPN [7] trained for pulmonary tuberculosis purpose was used to separate candidate patches from viral pneumonia. Third, a classification model (e.g. based on ResNet [8]) categorizes each patch amongst three types: COVID-19, Influenza-A-viral-pneumonia, and irrelevant-to-infection; and assign an infection probability. The overall analysis report for
one CT sample was calculated using the Noisy-or Bayesian function.
In [9], Shan et al. present a method to automatically segment and quantify infection in CT scans of COVID-19 patients. The collected dataset was composed of 549 CT images. To accelerate the manual delineation of CT images for training, a Human-In-The-Loop (HITL) strategy is adopted. A manual delineation step is operated by a medical staff for delimiting infected regions on original COVID-19 chest CT images. This permits to generate and to enrich a training set that is given as input to an artificial intelligence engine which operates to an automatic segmentation step over the COVID-19 infected region. The process loops these steps from this auto-contoured regions to assist radiologists for their annotation refinements. The proposed system yielded Dice similarity coefficients of approximately 91.6% between automatic and manual segmentations, and a mean Percentage Of Infection (POI) estimation error of 0.3% for the whole lung on the validation dataset. Moreover, compared with the cases of fully manual delineation that often requires 1 to 5 hours, the HITL strategy drastically reduces the delineation time to 4 minutes after 3 iterations of model updating.
The pulmonary infections can be more directly visible in CT images than in chest X-Ray images [10]. Nevertheless, detection of COVID-19 from chest X-ray images is also investigated since they represent widespread resources that are often analyzed upstream of CT scans.
In [11], a deep learning architecture named COVID-Net is proposed for the detection of COVID-19 cases from chest radiography images. The authors notably exploits the Chest X-Ray Images (Pneumonia)open dataset1 and the COVID-19
Image Data Collection open dataset [12]. Their derived chest radiography dataset named COVIDx is composed of 5941 posteroanterior chest radiography across 2839 patient cases. Their study targets the prediction of 4 image classes, namely normal, bacterial infection, non-COVID viral infection, and COVID-19 viral infection. In this sense, their dataset contains 1203 patient cases as normal, 931 patient cases with bacte-rial pneumonia, 660 patient cases with non-COVID-19 viral pneumonia and only 68 radiography images collected from 45 COVID-19 patient cases. The distribution of inter-class images amongst their training sets and amongst their test sets are highly unbalanced in view of the quantity of collected COVID-19 images. The authors exploit residual architecture design principles [13] pointing that they show time and again to enable reliable neural network architectures that are easier to train to high performance. They leverage generative synthesis [14] as the machine-driven design exploration strategy for gen-erating the final COVID-Net network architecture that obtains a global test accuracy of 83.5%. However, this accuracy has been obtained including a small data sample corresponding to only 10 COVID-19 cases.
1Chest X-Ray Images (Pneumonia) dataset:
https://www.kaggle.com/paultimothymooney/chest-xray-pneumonia
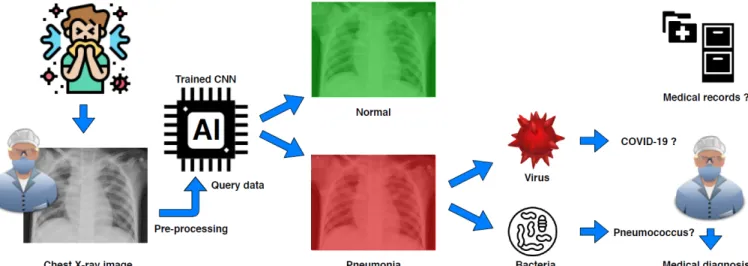
Fig. 1: Global workflow using deep learning for automatic detection of infection towards supporting COVID-19 screening from chest X-ray images. In a COVID-19 epidemic context, a detected viral pneumonia can particularly presume a COVID-19 infection.
III. PROPOSED APPROACH FOR PNEUMONIA ANALYSIS
A. CNN-based detection and evaluation of infected patients In [15] [16], authors emphasized that the COVID-19 is a viral disease and not a bacterial one. Respectively, an efficient classifier is designed to automatically detect if a query chest X-ray image is Normal, Bacterial or Viral by assuming that a COVID-19 infected patient, tested during an epidemic period, has a high probability to be a true positive when the classification output is Virus (see Fig. 1). Nethertheless, it is worth mentioning that a severe viral respiratory infection can lead to a secondary pneumonia of bacterial nature [17]. For this reason, our classifier aims to be useful at early stage of COVID-19 pulmonary symptoms.
1) Tailored CNN models: A set of tailored models based on CNNs have been designed to take three set of image categories (e.g.; normal case, viral pneumonia case and bacterial case) as input and output the predicted probability for each of the categories. The trained models exploit the CNN backbones ResNet34, ResNet50 and DenseNet169 through the fastai library and a fully connected head, with a single hidden layer, as a classifier.
Besides, a trained model exploits the CNN reference back-bone VGG-19. In addition, a dual use model (Inception ResNetV2 - RNN) is prepared for i) characterizing categories of input split images by getting a hidden layer output of a fin-tuned Inception ResNetV2 architecture, ii) predicting final categories of split images (image blocks) using a bidirectional Long Short-Term Memory (RNN-LSTM) architecture. For these last ones, a Keras and TensorFlow workflow is used.
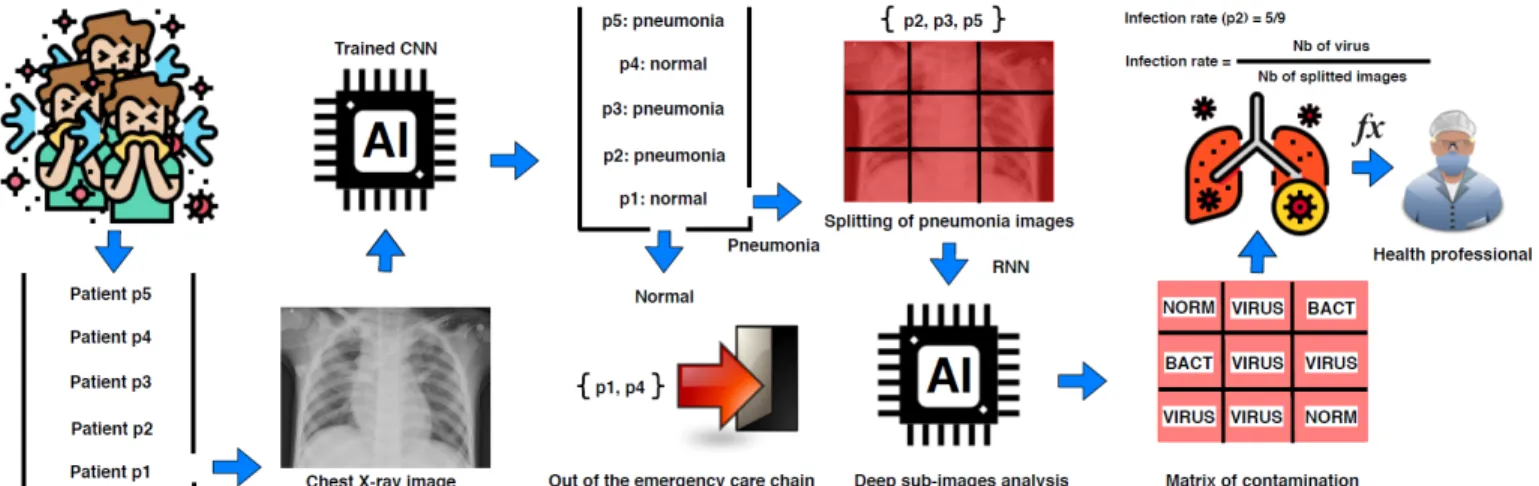
Specifically, the prediction stage of the dual-use model operates at a second level analysis of the data. A sequence of sub-images is first generated while entirely covering the images by directly positioning a regular grid onto the original query chest X-ray images. Precisely, the image is split into a set of image blocks that correspond to grid cells (see Fig. 2). This operation enhances the size of the training
set while limiting the loss of image details. This loss often occurs when the original images are resized for fitting inputs of standard deep learning architectures. Then, each image block is given as input to the RNN for providing a set of local predictions (matrix of contamination) towards estimating health indicators such as a CNN-based infection ratio (a use is described in section III-B). The grid discretization should be tuned according to the obtained predictive performance of the considered architecture.
(a) Normal. (b) Bacteria. (c) Virus. (d) COVID-19.
Fig. 3: Chest X-ray samples from the test datasets. 2) Data preparation and model inputs: For our experi-ments, we exploited Chest ray images from the Chest X-Ray Images (Pneumonia) dataset1. This dataset is related to the paper [18] on the identification of medical diagnoses and treatable diseases by image-based deep learning. This dataset contains 5,863 children X-Ray images divided in two categories, namely Normal and Pneumonia. The Pneumonia category is composed of pneumonia images that are labeled either bacterial or viral (see illustrations in Fig. 6 of [18]).
The Chest X-Ray Images (Pneumonia) dataset is reorganized into three classes; into normal, bacterial pneumonia and viral pneumonia (see samples in Fig 3a, Fig. 3b and Fig. 3c, respectively). Each training set contains 1345 images and each test set contains 148 images. Since this dataset was composed of pulmonary images having heterogeneous and large sizes; and to deal with reasonable computational times during the CNN training experiments, all the images were resized to a unique dimension and rescaled into smaller images (e.g.; size
Fig. 2: Global workflow using deep learning based for automatic estimation of a CNN-based infection rate indicator from chest X-ray images.
310 × 310) to fit with standard inputs of tailored architectures. For the last tailored model using RNN, a preliminary split of the original image precedes the resizing step.
Regarding the tests, we added a test set (blind test) that is composed of a single class containing 145 chest X-ray images of COVID-19 infected patients (see sample in Fig. 3d). This test set has been constituted by filtering the heterogeneous COVID-19 Image Data Collectiondataset [12]; folder contain-ing a mix of CT and X-ray images with a variety of infection types. At this time, we consider that this quantity of available COVID-19 is still too limited for building a reliable detector that can discern between Non-COVID-19 viral pneumonia and COVID-19 viral pneumonia. The 145 chest X-ray images are specifically used as a test set towards ideally detecting them as viral pneumonia. As previously mentioned, we assume that a COVID-19 infected patient, tested during an epidemic period, has a high probability to be a true positive when the classification output is viral pneumonia (Fig. 1).
B. Estimation of CNN-based health indicators
Based on statistical tools (logistic regression and statistical tests) and realistic data, studies on COVID-19-related death risk factor have been proposed in [19], [20]. In this paper, we sketch a simple measure to provide to health professionals an estimator for evaluating the chance of a patient to survive COVID-19 considering risk factors; namely age, comorbidity and the infection rate indicator (Fig.2). For each risk factor, we associate a score which represents a penalty (a large value decreases the chance of a patient to escape fatality). The proposed measure F is the addition of scores divided by a critical threshold T . Beyond T , there is no chance to be recovered. Formally, F is expressed as follows:
F = (S1+ S2+ S3)/T
where S1 measures the risk due to the patient’s age, S2 measures
the risk related to the CNN-derived infection rate measured from the X-ray chest image of a patient, S3measures the risk associated with
comorbidities (additional diseases) of a patient that can lead to the development of complications.
TABLE I: Scores related to age. The source of the “Fatality risk ratio” is [21].
Age Fatality risk ratio (Hubei, China) Associated score (S1)
≥ 80 18% 100 70-79 9.8% 54.4 60-69 4.6% 25.5 50-59 1.3% 7.2 40-49 0.4% 2.2 30-39 0.18% 1 20-29 0.09% 0.5 10-19 0.02% 0.1 0-9 0.01 0.05
More precisely, let us give an example to concretely com-pute the measure F . First, we point out that the scoring system used hereafter must be adjusted by health professionals to match with reality.
In this example, we use the values of fatality risk-ratio dur-ing COVID-19 epidemic in Hubei, China [21]. Proportionally to these values, we define penalty scores (S1), see Table I.
Then, we define the scores (S2) related to the infection rate
of X-ray image. S2 can be the probability of the concerned
class that is directly provided by the used CNN. A more refined formulation of S2 is proposed to scrutinize the
X-ray image. Each image is divided in n sub-images where n = 9 (value for which our RNN effectively performs). After analysis, each sub-image will be in status virus, bacteria or normal (see Fig.2). A score equal to 100 is assigned to the X-ray image when the n sub-images are infected by a virus. Proportionally, the infection rate of the image is:
S2 = (100/n) × N , where N is the number of the virus
infected sub-images.
The third risk factor (S3) is related to diseases of a patient in
addition to COVID-19. We associate a penalty 100 to serious diseases, as complicated hypertension, coronary artery disease, heart surgery, chronic renal failure on dialysis, cancer on treat-ment. The health professional can define a list of moderated diseases which may complicate the patient’s recovering. He may assign to a moderated disease score a penalty value proportional to the score of serious diseases. In this article, we attribute the value 10 to one moderated disease. In this example, we set the critical threshold T to 200, then beyond
this limit, one cannot escape fatality. The measure F can be used as follows. If F ≥ 1 then the hope to escape fatality is null. Varying F from 0 to 1, the patient gradually moves away from the hope of recovering.
The value 200 assigned to T is obtained by taking reference a patient having a serious additional disease and aged over 80 years. We assume that such a patient cannot fight against COVID-19. Therefore, a person having COVID-19 which reaches the score 200 cumulates too many factors to overcome the illness.
Finally, we point out that the measure F can also be extended by slightly modifying the term S2 for taking into
account time factor. Indeed, a serie of X-ray images is ob-served for each COVID-19 inpatient pointed in [10] [22] [23]. Accordingly, S2 can be measure at two timely spaced X-rays
t1 and t2 to take into account the time kinetics of symptom
onset and disease progression for the infected patient. For this latter case, the infection rate can be redefined as follows: S2= f (t2) + malus, if f (t2) > f (t1) + δ (aggravation) f (t2), if |f (t2) − f (t1)| ≤ δ (stability)
f (t2) + bonus, otherwise (remission)
where f (t) = (100/n)×N (t) is the infection rate of the chest X-ray image captured at a moment t, N (t) is the number of detected viral sub-images at a moment t, t1 is inferior to t2, δ is threshold fixed
to 20, bonus and malus are a gain and a penalty fixed to (−20 × f (t2))/100 and (20 × f (t2))/100, respectively.
IV. EXPERIMENTAL STUDY
A. Performance of tailored CNN models TABLE IV: Confusion matrix. hhh
hhhhhh h
Actual
Predicted Bacteria Normal Virus
Bacteria 145 1 2
Normal 0 137 11
Virus 4 1 143
Table II presents performance for classification of normal and infection cases by using tailored CNN-based architectures. The DenseNet169 architecture has reached best performance with an average classification accuracy of 95.72% from the Chest X-Ray Images (Pneumonia) dataset1. The classification
accuracies are 97.97%, 96.62% and 92.57% for the class bacterial, virus and normal, respectively (see Table III). The associated confusion matrix is shown in Table IV. The per-formance of our DenseNet model is competitive with perfor-mances obtained by [18] in average classification accuracy of bacterial and viral cases 90.7%.
However, our RNN-based architecture is particularly sensi-tive to pneumonia cases with the blind COVID-19 test set since it detects pneumonia for 99.3% using default setting. Also, it promisingly detects viral infection for 60.64% considering majority voting in sequences. We stress the fact that the 145 COVID-19 images which have been extracted from [12] are highly heterogeneous. Notably, these extracted images come from at least 24 different hospitals over the world. The RNN
output results show a particularly robust pneumonia detection of COVID-infected patients and satisfying viral detection in view of the diversity of exploited radiography sources.
In [12], a histogram shows that significant image quantity has been acquired during the first week of the start of symp-toms or hospitalization. Since the quasi-totality of pneumonia are detected, our models should be able to operate at an early detection stage.
Also, a histogram shows a significant image distribution in term of age in between 20 and 80 years old. Since the Chest X-Ray Images (Pneumonia) dataset1 is principally collected from children (5,232 chest X-ray images) and since the quasi-totality of pneumonia are detected, models trained on children chest X-ray image database may be relevant for detecting pneumonia from adult chest X-ray images.
B. Projection with the CNN-based health indicators
Table V shows the RNN-derived infection rates S2estimated
from real pairs of successive X-ray images for 5 COVID-19 infected patients. Table VI details examples of F calculated for 9 patients from synthetic data.
V. CONCLUSION
A bench of deep learning tailored models have shown promising performances. Indeed, they have all exceeded 84% of average accuracy on pneumonia detection cases for the Pneumonia reorganized dataset1. Hence, a patient that has a pneumonia during the epidemic context has a high probability to be detected by these models. In particular, the Inception-ResNetV2 model has detected the minimum of false negatives to the pneumonia on the blind test set (0.7%). Moreover, we have shown in our experiments that the transfer of knowledge from pediatric chest X-ray training towards infection screening of adults can be efficient. Additionally, an attempt based on realistic scenarios is done to provide easy-to-apply health indicators for evaluating infection rate and aggravation risk to the COVID-19 pneumonia. Future works may exploit our models to discern between COVID-19 viral and non-COVID-19 viral pneumonia once chest X-ray images of COVID-non-COVID-19 will be accessible in sufficient quantity. This should permit to specifically identify COVID-19 infected patients even in a non-epidemic context. Furthermore, reliability of proposed models must be cross-checked by RT-PCR tests and clinical tests before deployment.
REFERENCES
[1] X. Xie, Z. Zhong, W. Zhao, C. Zheng, F. Wang, and J. Liu, “Chest ct for typical 2019-ncov pneumonia: Relationship to negative rt-pcr testing,” Radiology, vol. 0, no. 0, p. 200343, 0, pMID: 32049601. https://doi.org/10.1148/radiol.2020200343
[2] X. Xu, X. Jiang, C. Ma, P. Du, X. Li, S. Lv, L. Yu, Y. Chen, J. Su, G. Lang, Y. Li, H. Zhao, K. Xu, L. Ruan, and W. Wu, “Deep learning system to screen coronavirus disease 2019 pneumonia,” https://arxiv.org/ abs/2002.09334, 2020.
[3] “How does covid-19 appear in the lungs?” March 2020. https: //www.itnonline.com/content/how-does-covid-19-appear-lungs [4] “Acr recommendations for the use of chest radiography and
computed tomography (ct) for suspected covid-19 infection,” March 2020. https://www.acr.org/Advocacy-and-Economics/ACR-Position- Statements/Recommendations-for-Chest-Radiography-and-CT-for-Suspected-COVID19-Infection
[5] “Artificial intelligence assisted radiology technologies aid covid-19 fight in china,” March 2020. https://www.itnonline.com/article/artificial-intelligence-assisted-radiology-technologies-aid-covid-19-fight-china
TABLE II: Comparison of average accuracies obtained on classification using some tailored CNN-based architectures.
Average accuracy (%)
```` ```
`
Data Network ResNet34 ResNet50 DenseNet169 VGG-19 Inception ResNetV2 & RNN Image size (310x310),(310x273) (310x310),(310x273) (310x310),(310x273) (224x224) (300x300)
Raw resizing 93.69 93.47 91.89 82.66
-Original ratio with padding 90.54 93.92 95.72 -
-Split in 9 & raw resizing - - - 80.40
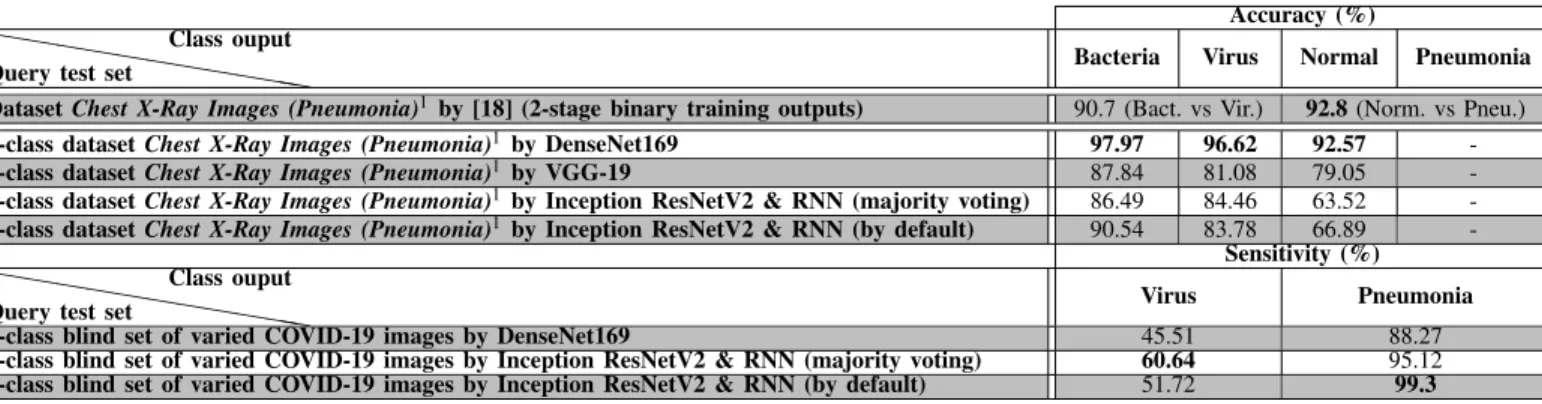
TABLE III: Classification performance obtained by testing our best trained architectures with two query image sets. The first row reflects classification results of [18].
Accuracy (%)
hhh
hhhhhh hhh
Query test set
Class ouput
Bacteria Virus Normal Pneumonia Dataset Chest X-Ray Images (Pneumonia)1by [18] (2-stage binary training outputs) 90.7 (Bact. vs Vir.) 92.8 (Norm. vs Pneu.)
3-class dataset Chest X-Ray Images (Pneumonia)1 by DenseNet169 97.97 96.62 92.57 -3-class dataset Chest X-Ray Images (Pneumonia)1 by VGG-19 87.84 81.08 79.05
-3-class dataset Chest X-Ray Images (Pneumonia)1 by Inception ResNetV2 & RNN (majority voting) 86.49 84.46 63.52
-3-class dataset Chest X-Ray Images (Pneumonia)1 by Inception ResNetV2 & RNN (by default) 90.54 83.78 66.89
-Sensitivity (%)
hhh
hhhhhh hhh
Query test set
Class ouput
Virus Pneumonia 1-class blind set of varied COVID-19 images by DenseNet169 45.51 88.27 1-class blind set of varied COVID-19 images by Inception ResNetV2 & RNN (majority voting) 60.64 95.12 1-class blind set of varied COVID-19 images by Inception ResNetV2 & RNN (by default) 51.72 99.3
TABLE V: CNN-derived infection rates S2 estimated from
real pairs of successive X-ray images for 5 COVID-19 infected patients.
Image pairs f (t1) Elapsed days f (t2) Observations S2 (t2 − t1)
(1,3), Fig. 5 of [10] 9/9 7 9/9 elderly man f (t2)
“improvements”
(1,2), Fig. 1 of [22] 1/9 5 2/9 67-y-old woman f (t2) “wires,
attenuation”
(1,3), Fig. 2 of [22] 5/9 8 5/9 36-y-old man f (t2) “death”
(1,2), case 1, Fig. 5
of [23] 6/9 1 9/9 “worse status” f (t2)+malus
(1,2), case 2, Fig. 5
of [23] 7/9 4 8/9 “worse status” f (t2)
TABLE VI: Examples of F values for 9 patients from synthetic data.
Patients Aggravation factors: values S1 S2 S3 F Patient 1 age: 82 100 nb. of infected sub-image: 3/9 33.33 0.7166 (71.66%) nb. of serious illness: 0 0 nb. of moderated illness: 1 10 Patient 2 age: 50-59 7.2 nb. of infected sub-image: 4/9 44.44 0.4582 (45.82 %) nb. of serious illness: 0 0 nb. of moderated illness: 4 40 Patient 3 age: 70-79 54.4 nb. of infected sub-image: 1/9 11.11 0.8275 (82.75%) nb. of serious illness: 1 100 nb. of moderated illness: 0 0 Patient 4 age: 82 100 nb. of infected sub-image: 1/9 11.11 1.05 (> 100%) nb. of serious illness: 1 100 nb. of moderated illness: 0 0 Patient 5 age: 30-39 1 nb. of infected sub-image: 5/9 55.55 0.7827 (78.27%) nb. of serious illness: 1 100 nb. of moderated illness: 0 0 Patient 6 age: 10-19 0.1 nb. of infected sub-image: 7/9 77.77 0.8893 (88.93%) nb. of serious illness: 1 100 nb. of moderated illness: 0 0 Patient 7 age: 10-19 0.1 nb. of infected sub-image: 4/9 44.44 0.2227 (22.27%) nb. of serious illness:0 0 nb. of moderated illness: 0 0 Patient 8 age: 50-59 7.2 nb. of infected sub-image: 2/9 22.22 0.3471 (34.71%) serious illness: 0 0 nb. of moderated illness: 4 40 Patient 9 age: 40-49 2.2 nb. of infected sub-image: 3/9 33.33 0.2276 (22.76%) nb. of serious illness: 0 0 nb. of moderated illness: 1 10
[6] F. Milletari, N. Navab, and S. Ahmadi, “V-net: Fully convolutional neural networks for volumetric medical image segmentation,” CoRR, vol. abs/1606.04797, 2016. http://arxiv.org/abs/1606.04797
[7] W. Wu, X. Li, P. Du, G. Lang, M. Xu, K. Xu, and L. Li, “A deep learning system that generates quantitative ct reports for diagnosing pulmonary tuberculosis,” 2019. https://arxiv.org/abs/1910.02285 [8] K. He, X. Zhang, S. Ren, and J. Sun, “Deep residual learning
for image recognition,” CoRR, vol. abs/1512.03385, 2015. http: //arxiv.org/abs/1512.03385
[9] F. Shan, Y. Gao, J. Wang, W. Shi, N. Shi, M. Han, Z. Xue, and Y. Shi, “Lung infection quantification of covid-19 in ct images with deep learning,” 2020. https://arxiv.org/abs/2003.04655
[10] M.-Y. Ng, E. Y. Lee, J. Yang, F. Yang, X. Li, H. Wang, M. M.-s. Lui, C. S.-Y. Lo, B. Leung, P.-L. Khong, C. K.-M. Hui, K.-y. Yuen, and M. D. Kuo, “Imaging profile of the covid-19 infection: Radiologic findings and literature review,” Radiology: Cardiothoracic Imaging, vol. 2, no. 1, p. e200034, 2020. https://doi.org/10.1148/ryct.2020200034 [11] L. Wang and A. Wong, “Covid-net: A tailored deep convolutional neural network design for detection of covid-19 cases from chest radiography images,” 2020. https://arxiv.org/abs/2003.09871v1 [12] J. P. Cohen, P. Morrison, and L. Dao, “Covid-19 image data collection,”
2020. https://arxiv.org/abs/2003.11597
[13] K. He, X. Zhang, S. Ren, and J. Sun, “Deep residual learning for image recognition,” in 2016 IEEE Conference on Computer Vision and Pattern Recognition (CVPR), 2016, pp. 770–778. https: //doi.org/10.1109/CVPR.2016.90
[14] A. Wong, M. J. Shafiee, B. Chwyl, and F. Li, “Ferminets: Learning generative machines to generate efficient neural networks via generative synthesis,” CoRR, vol. abs/1809.05989, 2018. http: //arxiv.org/abs/1809.05989
[15] “Treatment for coronavirus disease (covid-19),” March 2020. https: //www.healthline.com/health/coronavirus-treatment#available-treatment [16] “Covid-19: What we know so far about the 2019 novel coronavirus,” March 2020. https://www.uchicagomedicine.org/forefront/prevention-and-screening-articles/wuhan-coronavirus
[17] P. Hunter, “The spread of the covid-19 coronavirus,” EMBO reports, vol. n/a, no. n/a, p. e50334. https://doi.org/10.15252/embr.202050334 [18] D. Kermany, M. Goldbaum, W. Cai, C. Valentim, H.-Y. Liang, S. Baxter,
A. McKeown, G. Yang, X. Wu, F. Yan, J. Dong, M. Prasadha, J. Pei, M. Ting, J. Zhu, C. Li, S. Hewett, J. Dong, I. Ziyar, and K. Zhang, “Identifying medical diagnoses and treatable diseases by image-based deep learning,” Cell, vol. 172, pp. 1122–1131.e9, 02 2018. https://doi.org/10.1016/j.cell.2018.02.010
[19] F. Zhou, T. Yu, R. Du, G. Fan, Y. Liu, Z. Liu, J. Xiang, Y. Wang, B. Song, X. Gu, L. Guan, Y. Wei, H. Li, X. Wu, J. Xu, S. Tu, Y. Zhang, H. Chen, and B. Cao, “Clinical course and risk factors for mortality of adult inpatients with covid-19 in wuhan, china: a retrospective cohort study,” The Lancet, vol. 395, pp. 1054–1062, 3 2020. https://doi.org/10.1016/S0140-6736(20)30566-3
[20] B. O. F. Caramelo, N. Ferreira, “Estimation of risk factors for covid-19 mortality - preliminary results,” MedRxiv, 2020. doi:https://doi.org/10.1101/2020.02.24.20027268
[21] J. Riou, A. Hauser, M. J. Counotte, and C. L. Althaus, “Adjusted age-specific case fatality ratio during the covid-19 epidemic in hubei, china, january and february 2020,” medRxiv, 2020. https: //www.medrxiv.org/content/early/2020/03/06/2020.03.04.20031104 [22] J.-j. Zhang, X. Dong, Y.-y. Cao, Y.-d. Yuan, Y.-b. Yang, Y.-q. Yan,
C. A. Akdis, and Y.-d. Gao, “Clinical characteristics of 140 patients infected with sars-cov-2 in wuhan, china,” Allergy, vol. n/a, no. n/a. https://doi.org/10.1111/all.14238
[23] N. Chen, M. Zhou, X. Dong, J. Qu, F. Gong, Y. Han, Y. Qiu, J. Wang, Y. Liu, Y. Wei, J. Xia, T. Yu, X. Zhang, and L. Zhang, “Epidemiological and clinical characteristics of 99 cases of 2019 novel coronavirus pneumonia in wuhan, china: a descriptive study,” The Lancet, vol. 395, 01 2020. https://doi.org/10.1016/S0140-6736(20)30211-7