Physical activity of adults aged 50 years and older in Switzerland
Submitted: 28 September 2004Accepted: 18 March 2005
Published Online First: 21 July 2005
1Swiss Health Observatory, Neuchâtel, Switzerland
2Institute of Sports Sociology, Sports University, Cologne, Germany 3Lamprecht and Stamm, Social Science and Counceling, Zürich, Switzerland
Soz.- Präventivmed. 50 ( 2005) 218 – 229 0303-8408/05/040218–12 Summary
Objective: This study explores the prevalence of
guideline-com-pliant physical activity (PA) behavior based on socio-demo-graphic, health-related and environmental variables.
Methods: Cross-sectional data of the Swiss Health Survey
2002 were used in a Swiss population segment aged 50+. Four categories of PA were created with respect to Swiss and US guidelines: “moderate sports/exercise”, ”vigorous sports/exer-cise”, ”habitual PA”, and ”optimal PA” (i. e. combined variable used when both “vigorous sports/exercise” and ”habitual PA” apply). Sedentary lifestyle was a fifth category.
Results: In the total sample considered for analysis (N = 8 405)
the prevalence of guideline-compliant PA was: 9.1 % moderate sports/exercise; 18.2 % vigorous sports/exercise; 45 % habitual PA; 8.7 % optimal PA. Almost 50 % of the age groups 65–79 and 80+ were involved in habitual PA. Higher socio-economic status was associated with involvement in moderate sports/exercise, vigorous sports/exercise, or optimal PA. In contrast, lower socio-economic status was associated with habitual PA. While living in an urban or rural environment had no differentiating effect on sports/exercise, living in rural areas was associated with a sedentary lifestyle and little involvement in habitual PA and/or optimal PA. Self-reported good health and/or health orienta-tion were associated with vigorous sports/exercise, habitual PA and optimal PA, regardless of whether the person had chronic health problems or not.
Conclusion: Habitual PA seems to have the greatest potential
for increasing overall guideline-compliant activity levels. A be-havioral/cognitive and political/environmental approach to improving PA is suggested.
Keywords: Guideline-compliant physical activity – Aging – Habitual physical activity – Strategies for promoting physical activity.
Keeping aging populations independent and free from dis-ability is a major challenge in developed countries. Being a highly developed and economically stable country, Switzer-land has one of the highest life expectancy rates in the world. However, there is generally a 6.5-year gap between “life expectancy”, which is based on mortality statistics, and “healthy life expectancy”.
Population models suggest that by focusing greater attention on reducing morbidity rather than mortality rates, it is pos-sible to increase “healthy life expectancy” and reduce the period of disability in the latter years of life (Crimmins et al. 1994). Physical activity (PA) has been proven effective at reducing both morbidity and disability and at compensating for dysfunction among the chronically ill. PA is therefore considered a main factor in predicting whether a person will be free of disability in the latter years of his/her life (Vita et al. 1998).
Describing current PA behavior is a vital step towards promoting good exercise habits in an aging population. Em-pirical studies and theoretical models have shown that PA behavior patterns throughout one’s life are influenced by various factors: physical and mental health status (Abu-Omar et al. 2004a), perceived health (Abu-(Abu-Omar et al. 2004b; Meyer et al. 2004), health orientation (Stewart et al. 1977) and mastery in a sense of self-efficacy (Booth et al. 2000) as well as social status, expressed e. g. by education and income, respectively (Lamprecht & Stamm 2000). More-over, physical environments play a large role in a person’s choice to be physically active (Cunningham & Michael 2004). These factors may also be associated with involve-ment in different modes and types of physical activity.
Soz.- Präventivmed. 50 ( 2005) 218 – 229
Therefore, in order to adequately describe a population’s PA behavior patterns, a distinction must be drawn between habitual physical activity (e. g. walking, cycling, household chores, etc.) and sports/exercise (e. g. aerobics workout, resistance training, swimming, etc.).
The purpose of this explorative study is to describe the prevalence of PA for more than 9 000 Swiss citizens aged 50–80+. Self-reported PA behavior was used to create cate-gories based on Swiss and US guidelines on exercise to im-prove fitness and health (American College of Sports Medi-cine 2000; Pate et al. 1995; Swiss Federal Office of Sports et al. 2000). Prevalence of guideline-compliant PA was deter-mined for three age groups (50–64; 65–79, and + 80 years). Moreover, the relationship between PA behavior and such factors as socio-demographic characteristics, economic con-ditions and health-related variables were also examined so as to further efforts to promote physical activity.
Methods
Survey
The present cross-sectional study is based on data from the Swiss Health Survey 2002 performed by the Swiss Federal Statistical Office (Swiss Federal Statistical Office 2003b). This population-based survey runs every five years. The Swiss Health Survey assesses self-reported socio-demo-graphic features, physical/mental health status, disability and social consequences, use of the public health system, lifestyle and health-relevant behavior, living conditions, and health promotion aspects, among other things.
Study population
The sample was randomly selected from the Swiss permanent resident population aged 15 and older living in private resi-dences connected to the telephone network. Data for the pre-sent study was taken from a survey conducted in 2002. The representative sample consisted of N = 9 171 (N = 5 323 males and N = 3 848 females) aged 50+, which corresponds to 46.5% of the total sample of 19 706 respondents (43.2% male and 49.3% females) surveyed in 2002. Initially, we sorted through the N = 9 171 sample to make sure that all of the members of the population sample fell into either one of the four physical activity categories or the fifth “sedentary lifestyle” category. This gave us the final population sample of N = 8 405 for further analysis (see “Assessment of physical activity”). Data collection
Data were collected using computer-assisted telephone inter-views (CATI, PROXY) and a written questionnaire.
When-ever a respondent aged = 75 could not or would not reply by CATI, a computer-assisted personal interview (CAPI) was arranged (N = 205). Proxy interviews (PROXY) were used with close friends or relatives of respondents when the respondents themselves refused to answer questions, were unable to answer them because of a speech impediment, or were unavailable for a period of 4+ weeks due to hospital stay, physical and/or mental incapacity (N = 403). 83 % of those interviewed by CATI or CAPI returned the written questionnaire. Data were collected consistently throughout the year (four rounds of data collection, each lasting three months) to prevent seasonal effects from having an impact on the assessed variables.
Assessment of physical activity
Sports/exercise: To establish the sports/exercise variable ac-cording to PA guidelines we considered three questions of the Swiss Health Survey. In terms of “intensity” subjects could choose between five levels of perceived exertion as indicated in the questionnaire. In terms of “duration” the subjects reported a number of minutes and/or hours per week they spent on sports/exercise. The variable sports/ exercise was based on information regarding the type of ac-tivity (i. e. calisthenics, fitness or sports), duration (hours per week) and perceived exertion. Calisthenics, fitness or sports activities at a perceived exertion of moderate and/or low for
≥180 min per week were coded as “moderate
sports/exer-cise”. Moderate sports/exercise conforms to both CDC guidelines (Pate et al. 1995) and Swiss guidelines (Swiss Federal Office of Sports et al. 2000) (= 150 min and > 180 min per week, respectively, broken down into one 30 min session repeated five or more times per week).
Calisthenics, fitness or sports activities at a perceived exer-tion of quite strong or strong for ≥ 60 min per week were coded as “vigorous sports/exercise”. Vigorous sports/exer-cise conforms to ACSM guidelines (= 60 min per week, broken down into 20 min/day sessions three or more times per week) (American College of Sports Medicine 2000). The categories “moderate sports/exercise” and “vigorous sport/ exercise” were mutually exclusive but each of them could overlap with the category “habitual PA (9.9 % of the habi-tually active subjects did also perform moderate sports/exer-cise, and 18.8 % vigorous sports/exercise).
Habitual PA: This variable was established using informa-tion on usual daily walking and/or cycling assessed by two questions. If a subject did answer to walk and/or cycle habit-ually it was ask on how many minutes and/or hours per day. Moderate walking or cycling for 30 min per day was coded as “habitual PA”. This activity category conforms to the PA
recommendation made by the Swiss Federal Office of Sports (30 min per day ≥ 5 times weekly) (Swiss Federal Office of Sports et al. 2000).
Optimal PA: This is a combined variable used when both vigorous sport/exercise and habitual PA apply. It corre-sponds to ≥ 210 min of sports/exercise per week, which con-forms to another Swiss recommendation (Swiss Federal Office of Sports et al. 2000).
No PA: This category refers to individuals who did no sports (be it moderate or vigorous) and additionally whose habitual PA was deemed insufficient (< 30 min/day). Groups that did sports/exercise below the intensities recom-mended in the guidelines (N = 766) were not considered in the following analysis.
Socio-demographic variables
The following variables and categories were used: Males and females; age groups (50–64, 65–79 and 80+); education (primary, secondary, tertiary); size of household (one-person household, two and more person household); residence (urban: cities with > 100 000 inhabitants or agglomerations with > 20 000 inhabitants; rural); income in CHF (US$): < 3 000 CHF (2 400 US$), 3 000–4 500 (2 400–3 600), > 4 500–6 000 (3 600–4 800), > 6 000 (> 4 800)); language region (German-speaking, French-speaking, Italian-speak-ing part of Switzerland); socio-professional status (corporate manager; highly qualified non-manual worker; office clerk/ non-manual worker; small entrepreneur, self-employed; qualified manual worker; unqualified manual worker). Self-reported health indicators (defined categories for analysis in parenthesis)
Body mass index: BMI (< 25; 25–30; > 30). Health status variables were assessed with the questions as follows: per-ceived health status: “How is your health right now?”(very good/good; moderate; poor/very poor); perceived mental state: “How well-balanced is your state of mental health?” (not at all/not very; moderate; very/extremely); existence and/or absence of health problems/diseases in general and specifically: “Have you had any health problems/diseases in the past 12 months?” (yes/no); “Have you had any pain in the joints in the past four weeks?” (yes/no); “Have you under-gone medical treatment for diabetes, hypertension and/or heart attack in the past 12 months?” (yes/no for each illness). Health orientation was assessed on the basis of two mutually exclusive items: unconcerned (“I live my life without worrying so much about my health”) versus health-oriented (“thoughts about maintaining my health influence my
lifestyle and health considerations have a major impact on the way I live”). Mastery in a sense of self-efficacy (variables used: unsolvable problems; carried by destiny; little control over circumstances; given up in the face of problems); parameter value: low; medium; high. Social support: mem-bership in clubs (yes, no). The variables were chosen on an empirical and theoretical basis (see introduction).
Statistical analysis
Analysis was conducted using the SPSS program (Version 11). As a first step, socio-demographical variables and health-related variables were distributed for the defined PA categories. Prevalence of both “no PA” and “PA” categories was calculated at five-year age group intervals. The pre-valence of physical activity for 50–64, 65–79 and 80+ age groups was also determined.
Using logistic regression analysis, the adjusted odds ratios and 95 % confidence intervals (OR and 95 % CI) were calculated separately for the “no PA” category and the four “PA” categories (moderate sports/exercise, vigorous sports/ exercise, habitual PA, optimal PA), which were used as de-pendent variables. For socio-demographic variables, adjust-ment included all of the aforeadjust-mentioned variables plus socio-professional status. Health-related variables were ad-justed for variables chosen on the basis of its empirical asso-ciation to PA (see Tab. 3 and 4).
The data were weighted to get a sample matching the Swiss population in terms of important socio-demographic vari-ables. Different weightings were used for data obtained from the telephone or written surveys. P value of 0.05 was considered significant.
Results
Physical inactivity according to five-year-age groups in an aging Swiss population
More than one-third of the population assessed reported that they did neither sports/exercise nor sufficient habitual PA. With increasing age, the prevalence of physical inactiv-ity takes on a U-form. Considered for five-year-age groups, sedentary lifestyle was most prevalent in individuals aged
≥80 (39.3 %) and lowest in the 65–69 age group (27.4 %)
(Fig. 1). In all of the age groups, women had a lower pre-valence of physical inactivity (range 23.9 %–39.3 %) than men (range 31.1 %–46.3 %) (Fig. 1; Tab. 1).
Guideline-compliant physical activity
Prevalence of guideline-compliant PA for the four cate-gories assessed is presented in Fig. 2. Prevalence of moderate
Soz.- Präventivmed. 50 ( 2005) 218 – 229
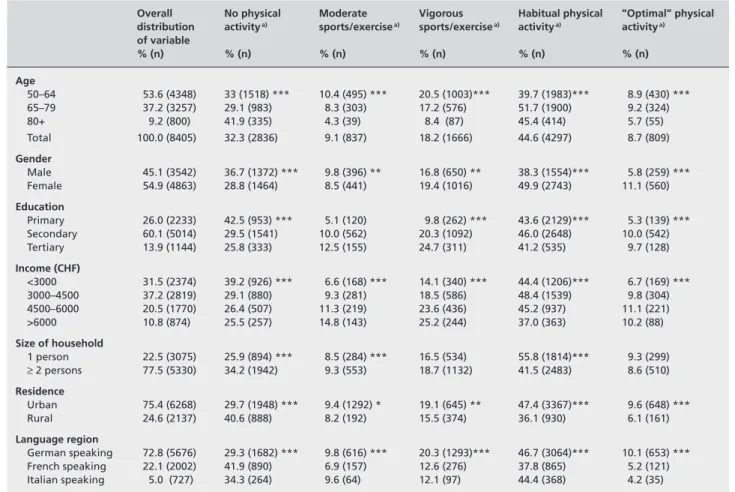
Table 1 Percent meeting physical activity guidelines to improve physical fitness according to selected socio-demographic variables (Swiss Health
Survey 2002)
Overall No physical Moderate Vigorous Habitual physical ”Optimal” physical distribution activitya) sports/exercisea) sports/exercisea) activitya) activitya) of variable % (n) % (n) % (n) % (n) % (n) % (n) Age 50–64 53.6 (4348) 33 (1518) *** 10.4 (495) *** 20.5 (1003)*** 39.7 (1983)*** 8.9 (430) *** 65–79 37.2 (3257) 29.1 (983) 8.3 (303) 17.2 (576) 51.7 (1900) 9.2 (324) 80+ 9.2 (800) 41.9 (335) 4.3 (39) 8.4 (87) 45.4 (414) 5.7 (55) Total 100.0 (8405) 32.3 (2836) 9.1 (837) 18.2 (1666) 44.6 (4297) 8.7 (809) Gender Male 45.1 (3542) 36.7 (1372) *** 9.8 (396) ** 16.8 (650) ** 38.3 (1554)*** 5.8 (259) *** Female 54.9 (4863) 28.8 (1464) 8.5 (441) 19.4 (1016) 49.9 (2743) 11.1 (560) Education Primary 26.0 (2233) 42.5 (953) *** 5.1 (120) 9.8 (262) *** 43.6 (2129)*** 5.3 (139) *** Secondary 60.1 (5014) 29.5 (1541) 10.0 (562) 20.3 (1092) 46.0 (2648) 10.0 (542) Tertiary 13.9 (1144) 25.8 (333) 12.5 (155) 24.7 (311) 41.2 (535) 9.7 (128) Income (CHF) <3000 31.5 (2374) 39.2 (926) *** 6.6 (168) *** 14.1 (340) *** 44.4 (1206)*** 6.7 (169) *** 3000–4500 37.2 (2819) 29.1 (880) 9.3 (281) 18.5 (586) 48.4 (1539) 9.8 (304) 4500–6000 20.5 (1770) 26.4 (507) 11.3 (219) 23.6 (436) 45.2 (937) 11.1 (221) >6000 10.8 (874) 25.5 (257) 14.8 (143) 25.2 (244) 37.0 (363) 10.2 (88) Size of household 1 person 22.5 (3075) 25.9 (894) *** 8.5 (284) *** 16.5 (534) 55.8 (1814)*** 9.3 (299) ≥2 persons 77.5 (5330) 34.2 (1942) 9.3 (553) 18.7 (1132) 41.5 (2483) 8.6 (510) Residence Urban 75.4 (6268) 29.7 (1948) *** 9.4 (1292) * 19.1 (645) ** 47.4 (3367)*** 9.6 (648) *** Rural 24.6 (2137) 40.6 (888) 8.2 (192) 15.5 (374) 36.1 (930) 6.1 (161) Language region German speaking 72.8 (5676) 29.3 (1682) *** 9.8 (616) *** 20.3 (1293)*** 46.7 (3064)*** 10.1 (653) *** French speaking 22.1 (2002) 41.9 (890) 6.9 (157) 12.6 (276) 37.8 (865) 5.2 (121) Italian speaking 5.0 (727) 34.3 (264) 9.6 (64) 12.1 (97) 44.4 (368) 4.2 (35)
p < * 0.01; ** 0.001; *** 0.0001; a) as defined in the text
Figure 1 Physical inactivity by 5 yr group in N = 9 171, permanent
resi-dent population in Switzerland
Figure 2 Prevalence of guideline-compliant physical activity by age
group for each of the four categories
and vigorous sports/exercise and optimal PA decreased in direct proportion to increasing age. For habitual PA, the youngest age group (50–64 years) had the lowest prevalence, the oldest age group (age ≥ 80) was in the middle and the 65–79 age group had the highest prevalence. With exception
of moderate sports/exercise, more females did every single category of guideline-compliant PA than males. The pvalence of sports/exercise and habitual and optimal PA, re-spectively, according to socio-demographic, economic and health-related factors assessed are shown in Tab. 1 and 2.
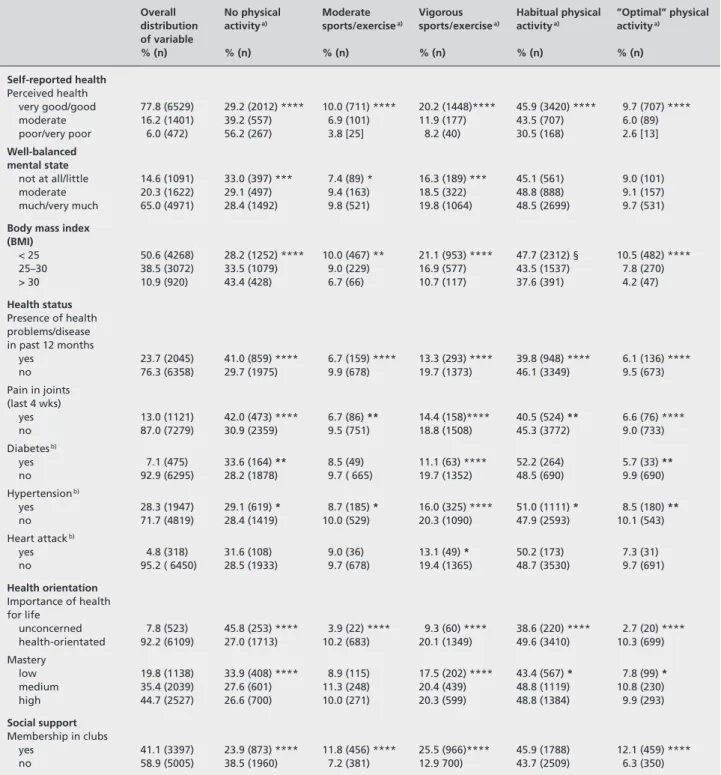
Table 2 Percent meeting physical activity guideline to improve physical fitness according to selected health variables (Swiss Health Survey 2002)
Overall No physical Moderate Vigorous Habitual physical ”Optimal” physical distribution activitya) sports/exercisea) sports/exercisea) activitya) activitya) of variable % (n) % (n) % (n) % (n) % (n) % (n) Self-reported health Perceived health very good/good 77.8 (6529) 29.2 (2012) **** 10.0 (711) **** 20.2 (1448)**** 45.9 (3420) **** 9.7 (707) **** moderate 16.2 (1401) 39.2 (557) 6.9 (101) 11.9 (177) 43.5 (707) 6.0 (89) poor/very poor 6.0 (472) 56.2 (267) 3.8 [25] 8.2 (40) 30.5 (168) 2.6 [13] Well-balanced mental state not at all/little 14.6 (1091) 33.0 (397) *** 7.4 (89) * 16.3 (189) *** 45.1 (561) 9.0 (101) moderate 20.3 (1622) 29.1 (497) 9.4 (163) 18.5 (322) 48.8 (888) 9.1 (157) much/very much 65.0 (4971) 28.4 (1492) 9.8 (521) 19.8 (1064) 48.5 (2699) 9.7 (531)
Body mass index (BMI) < 25 50.6 (4268) 28.2 (1252) **** 10.0 (467) ** 21.1 (953) **** 47.7 (2312) § 10.5 (482) **** 25–30 38.5 (3072) 33.5 (1079) 9.0 (229) 16.9 (577) 43.5 (1537) 7.8 (270) > 30 10.9 (920) 43.4 (428) 6.7 (66) 10.7 (117) 37.6 (391) 4.2 (47) Health status Presence of health problems/disease in past 12 months yes 23.7 (2045) 41.0 (859) **** 6.7 (159) **** 13.3 (293) **** 39.8 (948) **** 6.1 (136) **** no 76.3 (6358) 29.7 (1975) 9.9 (678) 19.7 (1373) 46.1 (3349) 9.5 (673) Pain in joints (last 4 wks) yes 13.0 (1121) 42.0 (473) **** 6.7 (86) ** 14.4 (158)**** 40.5 (524) ** 6.6 (76) **** no 87.0 (7279) 30.9 (2359) 9.5 (751) 18.8 (1508) 45.3 (3772) 9.0 (733) Diabetesb) yes 7.1 (475) 33.6 (164) ** 8.5 (49) 11.1 (63) **** 52.2 (264) 5.7 (33) ** no 92.9 (6295) 28.2 (1878) 9.7 ( 665) 19.7 (1352) 48.5 (690) 9.9 (690) Hypertensionb) yes 28.3 (1947) 29.1 (619) * 8.7 (185) * 16.0 (325) **** 51.0 (1111) * 8.5 (180) ** no 71.7 (4819) 28.4 (1419) 10.0 (529) 20.3 (1090) 47.9 (2593) 10.1 (543) Heart attackb) yes 4.8 (318) 31.6 (108) 9.0 (36) 13.1 (49) * 50.2 (173) 7.3 (31) no 95.2 ( 6450) 28.5 (1933) 9.7 (678) 19.4 (1365) 48.7 (3530) 9.7 (691) Health orientation Importance of health for life unconcerned 7.8 (523) 45.8 (253) **** 3.9 (22) **** 9.3 (60) **** 38.6 (220) **** 2.7 (20) **** health-orientated 92.2 (6109) 27.0 (1713) 10.2 (683) 20.1 (1349) 49.6 (3410) 10.3 (699) Mastery low 19.8 (1138) 33.9 (408) **** 8.9 (115) 17.5 (202) **** 43.4 (567) * 7.8 (99) * medium 35.4 (2039) 27.6 (601) 11.3 (248) 20.4 (439) 48.8 (1119) 10.8 (230) high 44.7 (2527) 26.6 (700) 10.0 (271) 20.3 (599) 48.8 (1384) 9.9 (293) Social support Membership in clubs yes 41.1 (3397) 23.9 (873) **** 11.8 (456) **** 25.5 (966)**** 45.9 (1788) 12.1 (459) **** no 58.9 (5005) 38.5 (1960) 7.2 (381) 12.9 700) 43.7 (2509) 6.3 (350) p < * 0.05; ** 0.01; *** 0.001; **** 0.0001
a) As defined in the text
b)Underwent medial treatment in the past 12 months
Soz.- Präventivmed. 50 ( 2005) 218 – 229
Relationship between guideline-compliant physical activity and socio-demographic variables (Tab. 3)
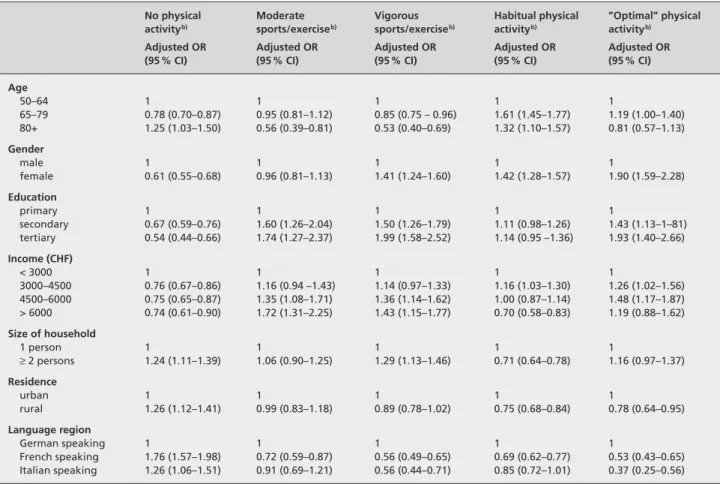
With increasing age, the elderly population was less likely to do guideline-compliant moderate and vigorous sports/ exercise but more likely to do habitual PA. Compared to men, women were more likely to be active in three of the four PA categories as assessed. Compared to urban resi-dents, inhabitants of rural areas were more likely to be phys-ically inactive and less likely to do habitual PA and/or opti-mal PA. In contrast, living in an urban or rural environment had no differentiating effect on moderate and/or vigorous sports/exercise. Living in different language areas of Swit-zerland was associated with a different involvement in both sedentary lifestyle and categories of PA as assessed. The higher the education and income of the aging population, the more likely it was to do moderate sports/exercise, vigor-ous sports/exercise, or optimal PA. A reverse association was seen between income and habitual PA. Living in single households and households with two or more persons had a differentiating effect on habitual PA and vigorous sports/ exercise.
Relationship between physical activity and health-related variables (Tab. 4)
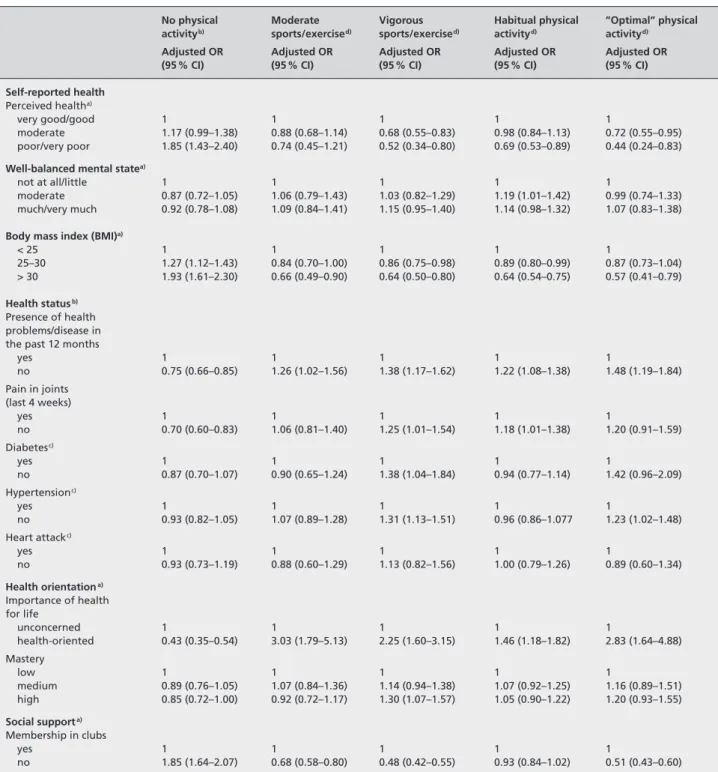
The elderly who reported that they were in poor health, overweight or obese were more likely to be physically inac-tive than the elderly who reported contrasting parameter values for the above variables. Those who reported good health, normal BMI and no chronic health problems/dis-eases were more likely to be associated with three of the four categories of PA (vigorous sports/exercise, habitual PA, optimal PA), after adjustment for possible confounders. As for moderate sports/exercise, it did no matter whether the self-rated health was good, moderate and/or poor. Existence and/or absence of pain in the joints had a differentiating effect on physical inactivity, vigorous sports/exercise and habitual PA. Previous history of heart attack had no impact on the likelihood of a person being sedentary or physically active. Those who reported having no diabetes and or high blood pressure tended to be those who did vigorous sports/exercise and optimal PA. Those who were less active were generally those who reported having these cardiovas-cular risk factors. After adjustment for socio-demographic
Table 3 Adjusted odds ratios a) for meeting physical activity guidelines by selected socio-demographic variables (Swiss Health Survey 2002)
No physical Moderate Vigorous Habitual physical ”Optimal” physical activityb) sports/exerciseb) sports/exerciseb) activityb) activityb)
Adjusted OR Adjusted OR Adjusted OR Adjusted OR Adjusted OR
(95 % CI) (95 % CI) (95 % CI) (95 % CI) (95 % CI)
Age 50–64 1 1 1 1 1 65–79 0.78 (0.70–0.87) 0.95 (0.81–1.12) 0.85 (0.75 – 0.96) 1.61 (1.45–1.77) 1.19 (1.00–1.40) 80+ 1.25 (1.03–1.50) 0.56 (0.39–0.81) 0.53 (0.40–0.69) 1.32 (1.10–1.57) 0.81 (0.57–1.13) Gender male 1 1 1 1 1 female 0.61 (0.55–0.68) 0.96 (0.81–1.13) 1.41 (1.24–1.60) 1.42 (1.28–1.57) 1.90 (1.59–2.28) Education primary 1 1 1 1 1 secondary 0.67 (0.59–0.76) 1.60 (1.26–2.04) 1.50 (1.26–1.79) 1.11 (0.98–1.26) 1.43 (1.13–1–81) tertiary 0.54 (0.44–0.66) 1.74 (1.27–2.37) 1.99 (1.58–2.52) 1.14 (0.95 –1.36) 1.93 (1.40–2.66) Income (CHF) < 3000 1 1 1 1 1 3000–4500 0.76 (0.67–0.86) 1.16 (0.94 –1.43) 1.14 (0.97–1.33) 1.16 (1.03–1.30) 1.26 (1.02–1.56) 4500–6000 0.75 (0.65–0.87) 1.35 (1.08–1.71) 1.36 (1.14–1.62) 1.00 (0.87–1.14) 1.48 (1.17–1.87) > 6000 0.74 (0.61–0.90) 1.72 (1.31–2.25) 1.43 (1.15–1.77) 0.70 (0.58–0.83) 1.19 (0.88–1.62) Size of household 1 person 1 1 1 1 1 ≥2 persons 1.24 (1.11–1.39) 1.06 (0.90–1.25) 1.29 (1.13–1.46) 0.71 (0.64–0.78) 1.16 (0.97–1.37) Residence urban 1 1 1 1 1 rural 1.26 (1.12–1.41) 0.99 (0.83–1.18) 0.89 (0.78–1.02) 0.75 (0.68–0.84) 0.78 (0.64–0.95) Language region German speaking 1 1 1 1 1 French speaking 1.76 (1.57–1.98) 0.72 (0.59–0.87) 0.56 (0.49–0.65) 0.69 (0.62–0.77) 0.53 (0.43–0.65) Italian speaking 1.26 (1.06–1.51) 0.91 (0.69–1.21) 0.56 (0.44–0.71) 0.85 (0.72–1.01) 0.37 (0.25–0.56)
Table 4 Adjusted odds ratiosa) – b) for meeting physical activity guideline by selected health variables (Swiss Health Survey 2002)
No physical Moderate Vigorous Habitual physical ”Optimal” physical activityb) sports/exercised) sports/exercised) activityd) activityd)
Adjusted OR Adjusted OR Adjusted OR Adjusted OR Adjusted OR
(95 % CI) (95 % CI) (95 % CI) (95 % CI) (95 % CI)
Self-reported health
Perceived healtha)
very good/good 1 1 1 1 1
moderate 1.17 (0.99–1.38) 0.88 (0.68–1.14) 0.68 (0.55–0.83) 0.98 (0.84–1.13) 0.72 (0.55–0.95)
poor/very poor 1.85 (1.43–2.40) 0.74 (0.45–1.21) 0.52 (0.34–0.80) 0.69 (0.53–0.89) 0.44 (0.24–0.83)
Well-balanced mental statea)
not at all/little 1 1 1 1 1
moderate 0.87 (0.72–1.05) 1.06 (0.79–1.43) 1.03 (0.82–1.29) 1.19 (1.01–1.42) 0.99 (0.74–1.33)
much/very much 0.92 (0.78–1.08) 1.09 (0.84–1.41) 1.15 (0.95–1.40) 1.14 (0.98–1.32) 1.07 (0.83–1.38)
Body mass index (BMI)a)
< 25 1 1 1 1 1 25–30 1.27 (1.12–1.43) 0.84 (0.70–1.00) 0.86 (0.75–0.98) 0.89 (0.80–0.99) 0.87 (0.73–1.04) > 30 1.93 (1.61–2.30) 0.66 (0.49–0.90) 0.64 (0.50–0.80) 0.64 (0.54–0.75) 0.57 (0.41–0.79) Health statusb) Presence of health problems/disease in the past 12 months
yes 1 1 1 1 1 no 0.75 (0.66–0.85) 1.26 (1.02–1.56) 1.38 (1.17–1.62) 1.22 (1.08–1.38) 1.48 (1.19–1.84) Pain in joints (last 4 weeks) yes 1 1 1 1 1 no 0.70 (0.60–0.83) 1.06 (0.81–1.40) 1.25 (1.01–1.54) 1.18 (1.01–1.38) 1.20 (0.91–1.59) Diabetesc) yes 1 1 1 1 1 no 0.87 (0.70–1.07) 0.90 (0.65–1.24) 1.38 (1.04–1.84) 0.94 (0.77–1.14) 1.42 (0.96–2.09) Hypertensionc) yes 1 1 1 1 1 no 0.93 (0.82–1.05) 1.07 (0.89–1.28) 1.31 (1.13–1.51) 0.96 (0.86–1.077 1.23 (1.02–1.48) Heart attackc) yes 1 1 1 1 1 no 0.93 (0.73–1.19) 0.88 (0.60–1.29) 1.13 (0.82–1.56) 1.00 (0.79–1.26) 0.89 (0.60–1.34) Health orientationa) Importance of health for life unconcerned 1 1 1 1 1 health-oriented 0.43 (0.35–0.54) 3.03 (1.79–5.13) 2.25 (1.60–3.15) 1.46 (1.18–1.82) 2.83 (1.64–4.88) Mastery low 1 1 1 1 1 medium 0.89 (0.76–1.05) 1.07 (0.84–1.36) 1.14 (0.94–1.38) 1.07 (0.92–1.25) 1.16 (0.89–1.51) high 0.85 (0.72–1.00) 0.92 (0.72–1.17) 1.30 (1.07–1.57) 1.05 (0.90–1.22) 1.20 (0.93–1.55) Social supporta) Membership in clubs yes 1 1 1 1 1 no 1.85 (1.64–2.07) 0.68 (0.58–0.80) 0.48 (0.42–0.55) 0.93 (0.84–1.02) 0.51 (0.43–0.60)
a)Adjusted for socio-demographic variables (age, gender, income, residential, and language region), variables on health status and BMI
b)Adjusted for socio-demographic variables (age, gender, income, residential, and language region) and variables on health status
c)Underwent medical treatment in the past 12 months
Soz.- Präventivmed. 50 ( 2005) 218 – 229
variables, health-orientation was strongly associated with both sports/exercise and optimal PA. Those who reported high parameter value for mastery were more likely to do vigorous sports/exercise. Belonging to any type of club was more likely to be associated with physical inactivity, and less likely with both moderate and vigorous sports/exercise and optimal PA (i. e. ≥ 210 minutes per week).
Discussion
In 2002, the aging Swiss population consisted of approxima-tely N = 1.33 million people aged 50–64, N = 830 000 people aged 65–79, and N = 307 000 people aged 80+, correspond-ing to 18.2 %, 11.4 % and 4.2 % respectively of the current total population. By the year 2030, the numbers are expect-ed to increase to approximately N = 1.45 million (50–64), 1.25 million (65–79), and N = 500 000 (≥ 80), corresponding to 19.2 %, 16.6 % and 6.7 % respectively of the expected total population. This scenario implies that the 80+ age group will be the fastest growing segment of the population, followed by the 65–79 age group.
Numerous studies have shown that PA performed through-out one’s life can maintain and/or improve physical and mental health, physical functioning and quality of life, and independence (American College of Sports Medicine 1998; King et al. 1998; Spirduso & Cronin 2001). Recently updated physical fitness recommendations for the general adult population, issued by the American College of Sports Medicine (2000), CDC (Pate et al. 1995) and the Swiss Fed-eral Office of Sports et al. (2000), encourage people to do a certain amount of PA that will result in significant health benefits. For Switzerland and other developed countries, lit-tle is known about how physically active the older and old population is and whether the active elderly do guideline-compliant physical activity and to what extent. Another dif-ficulty is the fact that there is still uncertainty regarding whether or not intervention programs have led to a funda-mental improvement in the physical activity behavior of ag-ing population segments (Conn et al. 2003).
Prevalence of sedentary lifestyle and of physical activity In developed countries, 50+ age groups were reported to be the most sedentary segment of the adult population, partic-ularly the population aged 75+ (Breuer 2004; Martin et al. 1999; Mokdad et al. 2001; U.S. Department of Health and Human Services 1996). In the population assessed, about one-third (32.3 %) either did no sports or did insufficient habitual PA (Fig. 1). The prevalence of insufficient PA was somewhat higher than for the younger Swiss population aged 15 to < 50 (26.7 %). When we compared the PA
be-havior of the ≥ 50 age group to the entire Swiss population (Fig. 2) from another physical activity survey (Martin et al. 1999), we found that the older members of the population have a considerably lower prevalence of doing regular sports/ exercise but a substantially higher prevalence of doing habitual PA. However, various methodological aspects, such as the confounding effect of age in cross-sectional studies must be taken into account when judging these findings (Breuer 2003). Another important consideration is the definition of sedentary lifestyle (i. e. insufficient or no sports/PA). Since this definition may vary from survey to survey, different information will be assessed. In addition, different types of PA need to be considered. In the elderly, there are many types of PA ranging from regular sports (e. g. skiing, swimming), hiking and leisurely walking, and physi-cal therapy to compensate for disability and physiphysi-cal exer-tion from housework and daily activities. Most surveys focus only on regular sports and endurance-based exercise. Finally, response bias may be a problem in items of recall and self-reporting. This is especially true when respondents are from older and old populations. Any of these aspects could cause bias in the findings on PA behavior as surveyed in the Swiss population aged 50 and older.
Physical activity in the socio-demographic context
Most of the relationships that we have observed between PA categories among the elderly and socio-demographic or economic variables (Tab. 1) were also reported for the entire Swiss adult population (Lamprecht & Stamm 2000; Swiss Federal Statistical Office 2003a). The classical notion of PA behavior in the elderly is contradicted by observations that women demonstrated a higher prevalence of physical activity than men or that older age groups have a higher prevalence than younger age groups of doing habitual PA (Tab. 1 and 3). Similar findings were also reported in recent studies (Breuer 2004; King et al. 1991; Lamprecht & Stamm 2000). A variety of popular sports/exercises designed for the older, old and oldest segments of the population and asso-ciated with new health ideals and fitness concepts, could ex-plain the improved PA behavior among aging populations. In the context of similar findings from other studies, partic-ularly longitudinal studies and cohort studies, our findings challenge social and health services to do some rethinking in terms of gender and age specific PA promotion as indicated in the study implications.
In light of the expected increase in the number of single-person households among the demographically aging Swiss population (Swiss Federal Statistical Office 2003a), differing preferences for habitual PA and vigorous sports/exercise among those living in single-person households and those
living in households with two and more persons are worthy of mention (Tab. 3). Living alone and providing for oneself requires physical exertion for daily living. The physical exer-tion that comes with doing housework and gardening, climbing stairs etc. with threshold energy expenditure has been proven to be health-relevant (overview see Oja 2001). Therefore, physical activity behavior in our study could have been described more realistically had this physical exertion for daily living been considered.
Local environment and physical activity
In a previous representative study, 60–74 year-old Swiss reported a preference for sports/exercise outdoors or at home rather at fitness centers (Lamprecht & Stamm 2000). In our study, the elderly living in urban areas were less likely to lead a sedentary lifestyle and more likely to do guideline-compliant sports/exercise, habitual PA or optimal PA of
≥210 min per week than those living in rural areas (Tab. 3).
This result may be less reliable since information about phy-sically demanding work outdoors (i. e. farming and forestry) was not provided by the survey data even though such work would have had an impact on determinations of overall habitual and optimal PA. The findings may reflect the fact that infrastructures are being set up in many Swiss urban areas to encourage urban populations to walk or ride bi-cycles more. Greater possibilities for walking, bike rental facilities at train stations and safe bicycle paths are a few examples of this. In an Australian population segment age 60+, access to various exercise facilities were found to be associated with PA in this sample of seniors (Booth et al. 2000). In Great Britain, the “Urbanwalks” initiative was created to enable the population to become more physically active in their everyday local environment. Such policies and programs designed to enhance the surroundings can lead to significant improvements in a community’s PA behavior patterns compared to communities where such policies and programs are lacking (Brownson et al. 2001)
Physical activity and health status
In the aging segment of the Swiss population, those who reported that they were free of chronic health problems or disease and mentally well-balanced were more likely to do almost all categories of physical activity than those who suffered from health problems (Tab. 2 and 4). Although this finding was to be expected, it was surprising to find that the population segment that reported their health to be poor and/or moderate was less likely to be involved in vigorous sports/exercise, habitual PA and optimal PA than the pop-ulation segment that reported themselves to be in good health, regardless of whether there were chronic health
problems, pain in joints, cardiovascular risk factors or for-mer heart attacks (Tab. 4). The apparent relevance of health perception in determining PA behavior among the older and oldest population is backed by a 55–65 year old repre-sentative population from the Swiss capital, where perceived health was strongly linked to habitual PA and self-reported fitness (Meyer et al. 2004). This finding was further backed by analyses of pooled data from 16 countries of the Euro-pean Union adjusted for age, gender, education, income, and nationality, inter alia (Abu-Omar et al. 2004b).
The cross-sectional design used both in the aforementioned studies and in our study does not allow us to draw conclu-sions regarding causality in either direction. On one hand, health-relevant behavior (including PA) may influence an individual’s perception of health (Kaplan & Baron-Epel 2003) but an individual’s perception of health may also have a positive impact on his/her health-relevant behavior (which includes sports/exercise) (Bailis et al. 2003). Additionally, the cross sectional design of our study leave open how and to which direction and extend, e. g. generation gaps natural aging might have influenced the association of health per-ception and health status.
Regardless of the quality of health status and health percep-tion reported by the elderly respondents, health-orientapercep-tion was a determinant for involvement in all categories of PA (Tab. 4). In this context, it is understood that older adults involved in sports/exercise programs rejected the role of being sick and that physical fitness programs can promote long-term PA sufficient to reduce disability in older adults suffering from arthritis (Minor et al. 1989). The positive association of perceived good health and health-orientation with involvement in almost every single category of PA (Tab. 4) provides an important cognitive aspect for future endeavors to get aging populations to adopt sufficient sports/ exercise habits.
Implications for improving physical activity in aging populations
This study revealed unexpected findings such as the relati-vely low prevalence of insufficient PA in the population of
≥50 years and the relatively high prevalence of
guideline-compliant habitual PA particularly among the segment aged 65 to 80+. However, PA is not enough according to public health recommendations. Like international physical fitness campaigns using the mass media (Bauman et al. 2000), Swiss campaigns such as “Feel Your Power” and “Getting Switzer-land to move” were only partially successful: those who were already physically active became more active and those who were physically inactive failed to adopt better exercise habits (Lamprecht et al. 2004). Failing to achieve changes in
Soz.- Präventivmed. 50 ( 2005) 218 – 229 Zusammenfassung
Körperliche Aktivität in der Schweizerischen Bevölkerung ab Alter 50
Fragegestellung: Die Arbeit exploriert die Prävalenz
richtlinien-konformer körperlicher Aktivität (KA) und ihre Beziehungen zu Variablen der Gesundheit und des Lebenskontextes bei Schweizer und Schweizerinnen im Alter von 50+.
Methoden: Querschnittdaten der Schweizerischen
Gesund-heitsbefragung 2002 wurden analysiert. Gemäss Schweizer und US-amerikanischen Richtlinien wurden vier Kategorien zur KA gebildet: moderate bzw. intensive Sportaktivität; habituelle KA; „optimale“ KA. Eine fünfte Kategorie bezog sich auf sitzende Lebensweise.
Ergebnisse: Im Gesamtkollektiv von N = 8 405 betrug die
Prä-valenz der richtlinien-konformen KA: 9,1 % für moderaten Sport, 12,2 % für intensiven Sport, 45 % für habituelle KA, 8,7 % für optimale KA. Etwa 50 % des Bevölkerungssegmentes der 65- bis 79- sowie der 80+-Jährigen bewegte sich ausrei-health-relevant behavior and awareness might be one ex-planation (Lamprecht et al. 2004) and the different effects of various intervention approaches (information; social and behavioral; political and environmental) might be another (Dunn & Blair 2002).
Physical activity participation in older age as a life-long process is influenced by previous life experiences. In 70– 98 year-old Canadians, the ability to do health-oriented sports/exercise in the latter years of their lives was signi-ficantly associated with recollections of the skills and movement capabilities gained decades earlier in childhood (Cousins 1997). These experiences match the findings on older adults for whom a positive sports/exercise experience was a greater motivating factor than the sports/exercise content itself. Having a positive experience encouraged them to stick to the fitness program or seek out other types of sports/exercise programs (Minor et al. 1989).
In our study, the relationship between PA and various socio-demographic and health-related variables suggest that a behavioral/cognitive approach should be combined with a political/environmental one for programs designed to encourage the aging Swiss population to be more physically active. Moreover, both general and individual approaches may be needed to address common health problems and
physical limitations of aging populations. The clear prefer-ence that older and old Swiss have for habitual PA suggests that infrastructures for age-adequate PA should continue to be developed in both urban and rural areas. To achieve im-provements in PA behavior in the Swiss population aged 50+, involvement of multiple government agencies (not simply those dealing with health- and sports-related mat-ters) seems indispensable. Identifying socio-demographic factors such as gender, size of household and income, and social support, inter alia, can be used to devise policies and intervention strategies to promote PA. In terms of health variables, the decision to adopt adequate PA behavior pat-terns seems to have less to do with whether a person actually had chronic health problems but more to do with the per-son’s mental outlook (i. e. self-reported good health, health orientation). However, whether mental outlook drives PA or PA helps to improve mental outlook remain an open question in terms of our study results.
Future research should develop validated instruments that can be used to measure social and living environments as well as health and health orientation so that older and old populations’ changing needs and unique values are ad-dressed.
chend durch habituelle KA. Ein höherer sozioökonomischer Status stand mit moderater bzw. intensiver Sportaktivität und optimaler KA in Beziehung, ein niedrigerer Status mit habitueller KA. Leben in ländlicher und städtischer Umge-bung hatte keinen differenzierenden Effekt bezüglich Prä-valenz der Sportaktivität, jedoch war Leben in ländlicher Um-gebung mit sitzender Lebensweise und niedriger Prävalenz habitueller bzw. optimaler KA verbunden. Unabhängig von der Existenz chronischer Gesundheitsprobleme standen die gute Gesundheit und ausgeprägte Gesundheitsorientierung mit intensiver Sportaktivität, habitueller bzw. optimaler KA in Beziehung.
Schlussfolgerung: Habituelle KA scheint das grösste Potential
für die Verbesserung von gesundheitsfördernder Bewegung zu haben. Strategien zur Mobilisierung dieses Potentials liegen in den Bereichen Verhalten/Kognition sowie Politik und Umge-bungsstrukturen.
Résumé
Activité physique au sein de la population suisse âgée de plus de 50 ans
Objectifs: Décrire l’observance des recommandations en
matière d’activité physique (AP) selon des variables se rappor-tant au statut socio-démographique, à l’état de santé et à l’environnement.
Méthodes: Analyse transversale basée sur les données (N=8 405)
de l’Enquête Suisse sur la Santé 2002. Quatre catégories d’AP sont utilisées: “modérée”, “intensive”, “habituelle” et “optimale” (cf. les directives suisses et américaines). “Mode de vie sédentaire” définit une cinquième catégorie.
Résultats: 9.1 % du collectif (N = 8 405) fait partie de la
caté-gorie “AP modérée”, 12.2 % de “AP intensive”, 45 % de “AP habituelle” et 8.7 % de “AP optimale”. Parmi la population
âgée de 65–79 ans et de 80 ans et plus, environ 50 % des personnes pratiquent une AP “habituelle”. Un niveau socio-économique élevé est associé à une d’AP “modérée”, “inten-sive” et “optimale”, tandis qu’un niveau socio-économique bas correspond à une “AP habituelle”. Aucune différence entre la vie en milieu citadin ou rural n’a été mise en évidence con-cernant la prévalence de l’activité sportive. Par contre la vie en milieu rural est associée avec un mode de vie plus sédentaire et avec une prévalence plus basse d’AP “habituelle” et “opti-male”. Un bon état de santé et une orientation positive face à la santé sont en lien avec une AP “intense”, “habituelle” ou “optimale”, indépendamment de la présence de problèmes de santé chroniques.
Conclusions: Il faut accroître l’observance des
recommanda-tions en matière d’activité physique. Des approches comporte-mentales, cognitives, politiques et environnementales sont suggérées pour promouvoir l’activité physique.
Lamprecht M, Fischer A, Ruckstuhl B, Stamm HP (2004). “Feel Your Power”: potentials and
limits of a health promotion campaign. Schweiz Z Sportmed Sporttraumatol 52: 71–7.
Lamprecht M, Stamm HP (2000). Sports
Switzer-land 2000: sport activity and Sport consumption in the Swiss population. Basel: Swiss Olympic Association.
Martin BW, Mäder U, Calmonte R (1999).
Physical activity related attitudes, knowledge and behaviour in the Swiss Population: results of the HEPA survey 1999. Schweiz Z Sportmed Sporttraumatol 47: 165–9.
Meyer K, Niemann S, Abel T (2004). Gender
differences in physical activity and fitness: asso-ciation with self-reported health and health-relevant attitudes in a middle-aged Swiss urban population. J Public Health 12: 283–90.
Minor M, Hewett J, Webel R, Anderson S, Kay D
(1989). Efficacy of physical conditioning exercise in patients with rheumatoid arthritis and osteo-arthritis. Arth Rheumat 32: 1396–405.
Mokdad AH, Bowman BA, Ford ES, Vinicor F, Marks JS, Koplan JP (2001). The continuing
epidemics of obesity and diabetes in the United States. JAMA 286: 1195–201.
Oja P (2001). Dose response between total
volume of physical activity and health and fitness. Med Sci Sports Exerc 33: 428–37.
Pate RR, Pratt M, Blair SN, et al. (1995). Physical
activity and public health: a recommendation from the Centers for Disease Control and Pre-vention and the American College of Sports Medicine. JAMA 273: 402–7.
References
Abu-Omar K, Rütten A, Lehtinen V (2004a).
Mental health and physical activity in the Euro-pean Union. Soz Praventiv Med 49: 301–9.
Abu-Omar K, Rütten A, Robine JM (2004b).
Self-rated health and physical activity in the European Union. Soz Praventiv Med 49: 235–342. American College of Sports Medicine (1998). ACSM position stand on exercise and physical activity for older adults. Med Sci Sports Exerc
30: 992–1008.
American College of Sports Medicine (2000). ACSM’s guidelines for exercise testing and prescription. Philadelphia.
Bailis DS, Segall A, Chipperfield JG (2003). Two
views of self-rated health status. Soc Sci Med
56: 203–17.
Bauman AE, Bellew B, Owen N, Vita P (2000).
Impact of an Australian mass media campaign targeting physical activity in 1998. Am J Prev Med 21: 41–7.
Booth M, Owen N, Baumann N, et al. (2000).
Social-cognitive and perceived environment influences associated with physical activity in older Australians. Prev Med 31: 15–22.
Breuer C (2003). Entwicklung und Stabilität
sportlicher Aktivität im Lebenslauf: zur Rolle von Alters-, Perioden- und Kohorteneffekten. Sportwissenschaft. German J Sports Sci
3: 263–79.
Breuer C (2004). Dynamics of life-span demand
for sport. Sport Society 1: 50–72.
Brownson R, Baker E, Housemann R, Brennan L, Bacak S (2001). Environmental and policy
determinants of physical activity in the United States. Am J Public Health 91: 1995–2003.
Conn VS, Monor MA, Burks KJ, Rantz MJ, Pomeroy SH (2003). Integrative review of
phy-iscal activity intervention research in aging adults. J Am Geriatr Soc 51: 1159–68.
Cousins SO (1997). Elderly tomboys? Sources of
self-efficacy for physical activity in later life. J Aging Phys Activity 5: 229–43.
Crimmins E, Hayward M, Saito Y (1994).
Chan-ging mortality and morbidity rates and the health status and life expectancy of the older popula-tion. Demography 31: 159–75.
Cunningham GO, Michael YL (2004). Concepts
guiding the study of the impact of the built envi-ronment on physical activity for older adults: a review of the literature. Am J Health Promot
18: 435–43.
Dunn AL, Blair SN (2002). Translating
evi-denced-based physical activity interventions into practice: the 2010 Challenge. Am J Prev Med 22: 221–5.
Kaplan G, Baron-Epel O (2003). What lies
behind the subjecitve evaluation of health status? Soc Sci Med 56: 1669–76.
King AC, Haskell WL, Taylor CB, Kraemer HC, DeBusk RF (1991). Group-versus home-based
exercise training in healthy older men and women: a community-based clinical trial. J Am Med Assoc 266: 1535–42.
King AC, Rejeski WJ, Buchner DM (1998).
Phy-sical activity interventions targeting older adults: a critical review and recommendations. Am J Prev Med 15: 316–33.
Soz.- Präventivmed. 50 ( 2005) 218 – 229
Spirduso WW, Cronin DL (2001). Exercise
dose-response effects on quality of life and indepen-dent living in older adults. Med Sci Sports Exerc
33: 598–608.
Stewart A, Ware J, Brook R (1977). The meaning
of health: understanding functional limitations. Medical Care 15: 939–52.
Swiss Federal Office of Sports, Swiss Federal Office of Health, Swiss Federal Statistical Office, Network Health and Exercise Switzerland (2000). Physical activity in the Swiss population: level and associations with health. Schweiz Z Sportmed Sporttraumatol 48: 87–8.
Swiss Federal Statistical Office (2003a). Census 1970–2000: press communication. Neuchâtel: SFSO.
Swiss Federal Statistical Office (2003b). Swiss Health Survey 2002. Neuchâtel: SFSO. U.S. Department of Health and Human Services (1996). Physical activity and health: a report of the Surgeon General. Atlanta, GA: U.S. Depart-ment of Health and Human Services, Centers for Disease Control and Prevention, National Center for Chronic Disease Prevention and Health Pro-motion.
Vita A, Terry R, Hubert H, Fries J (1998). Aging,
health risks, and cumulative disability. N Engl J Med 338: 1035–41.
Address for correspondence
PD Dr. Katharina Meyer, PhD, MPH Swiss Health Observatory & University of Bern
Espace de l’Europe CH-2010 Neuchâtel Tel.: +41 32 713 65 36