HAL Id: hal-02997685
https://hal.sorbonne-universite.fr/hal-02997685
Submitted on 3 Dec 2020HAL is a multi-disciplinary open access archive for the deposit and dissemination of sci-entific research documents, whether they are pub-lished or not. The documents may come from teaching and research institutions in France or abroad, or from public or private research centers.
L’archive ouverte pluridisciplinaire HAL, est destinée au dépôt et à la diffusion de documents scientifiques de niveau recherche, publiés ou non, émanant des établissements d’enseignement et de recherche français ou étrangers, des laboratoires publics ou privés.
New experimental approach for intelligent screening of
buried metal/oxide/polymer interfaces via local
electrochemistry: example of undamaged model
epoxy-coated Zn alloys
Thomas Sanchez, Simon Gillet, Viacheslav Shkirskiy, Vincent Vivier, Jaques
Echouard, Jolanta Światowska, Polina Volovitch
To cite this version:
Thomas Sanchez, Simon Gillet, Viacheslav Shkirskiy, Vincent Vivier, Jaques Echouard, et al.. New experimental approach for intelligent screening of buried metal/oxide/polymer interfaces via local elec-trochemistry: example of undamaged model epoxy-coated Zn alloys. Electrochimica Acta, Elsevier, 2021, 367, pp.137411. �10.1016/j.electacta.2020.137411�. �hal-02997685�
New experimental approach for intelligent screening of buried
1metal/oxide/polymer interfaces via local electrochemistry: example of
2undamaged model epoxy-coated Zn alloys
34
Thomas Sanchez1, Simon Gillet1, Viacheslav Shkirskiy1, Vincent Vivier2, Jaques Echouard3, Jolanta 5
Światowska1, Polina Volovitch1,* 6
7
1 Chimie ParisTech - CNRS, PSL University, Institut de Recherche de Chimie Paris, 8
11 rue Pierre et Marie Curie, 75005 Paris, France 9
2 Sorbonne Université, CNRS, Laboratoire Interfaces et Systèmes Electrochimiques (LISE), 4 place 10
Jussieu, 75005 Paris, France
11
3 Safran Landing Systems, Etablissement de Bidos – BP39, 64401 Oloron Sainte Marie Cedex 12 France 13 14
Abstract
15A new simple experimental approach is proposed for in situ mechanistic studies of the underpaint 16
stability of metal/oxide/polymer interface under immersion. It allows an intelligent screening and fast 17
ranking of conversion coatings on Zn alloys designed for further application of organic coatings. The 18
approach is based on the application of a simple electrochemical aging protocol to the samples preliminary 19
coated with a model epoxy-polymer. The latter is enough thin to allow local electrochemical impedance 20
measurement and stable under this protocol, as revealed by attenuated total reflectance infrared 21
spectroscopy (ATR-IR) and electrochemical impedance spectroscopy (EIS). The interface stability and 22
degradation modes characterization is accessed via combined EIS, local electrochemical impedance 23
spectroscopy and mapping (LEIS and LEIM) and in situ optical imaging. 24
The developed approach allowed to discriminate two Zn alloy substrates, one with intact and another 25
with slightly damaged Cr(III) conversion layer, for which no strong differences in the electrochemical 26
behavior or average surface composition was visible prior to the epoxy-polymer application. The relative 27
stability of two substrates with model thin coating, evaluated in the developed electrochemical test, 28
correlated with the observations obtained for the same substrates coated with thick commercial epoxy 29
primer after 1000 h of immersion. The proposed methodology offers the possibility of a rapid intelligent 30
screening of various formulations of Cr(III)-based surface treatments for Zn based substrates designed for 31 paint applications. 32 33
Keywords
34Local electrochemical impedance mapping (LEIM); Underpaint degradation; Zn alloys; conversion 35
coatings; AC-DC-AC 36
1
Highlights
2• New approach for smart screening of conversion coatings is proposed 3
• Modified AC-DC-AC ageing procedure and model polymer are used 4
• Heterogeneous degradation of buried interfaces detected by LEIM and in situ imaging 5
• Relative stability in the new procedure correlates with immersion test 6
1. Introduction
1Polymer coatings have been used for centuries for corrosion protection of metals and alloys due to 2
their good barrier properties limiting water and oxygen access to the metallic substrates [1,2]. Barrier 3
protection mechanisms of organic coatings have been extensively studied and the formulations of 4
hydrophobic binders, as well as the addition of pigments, have been optimized to reduce the permeability 5
of the coating to water and oxygen [3]. However, as water reaches the interface, underpaint reactivity can 6
develop. Localized reactive spots under the polymer coating lead to the metal/oxide/polymer interface 7
disbondment and delamination of the polymer coating from the metallic substrate. This delamination of 8
the coating can accelerate the system degradation and must be considered with caution [4,5]. 9
10
In order to ensure a good adherence of the polymer and improve corrosion resistance, the metallic 11
interface is usually modified by conversion coatings [6]. These coatings are thin oxidized layers formed via 12
chemical and/or electrochemical process at the metal surface [7,8],9]. Among conversion coatings, the 13
most used in the last decades were chromate-based conversion coatings [10]. Their efficiency is supposed 14
to be due to the combination of excellent anti-corrosion properties guaranteed by self-healing ability and 15
good adhesion of chromates to polymer coating [11-12]. However, chromates were proved to be genotoxic 16
and carcinogen [13] and since 2006, European legislation tries to tackle hexavalent chromium via 17
Registration, Evaluation, Authorization and Restriction of Chemicals (REACH) and Restriction of the use of 18
certain Hazardous Substances (RoHS) [14]. According to these legislations, the application of Cr(VI) 19
compounds should be banned in Europe by 2022 even though some industries got several years of 20
extension to find replacement solutions. Therefore, the development and the optimization of new 21
chromate-free conversion coating is strongly required [15-,16,17], whereas Cr(III)-based conversion 22
coatings have been considered as a possible replacement [18,19]. 23
24
In order to optimize the new generation of conversion coatings in a reasonable time scale, and to 25
better understand their performances, it is necessary to develop new analytical tools to access the 26
metal/oxide/polymer interface stability. To detect and localize the interfacial disbondment or 27
deterioration, Scanning Kelvin Probe (SKP) is the most well-known and precise tool, used for both, blisters 28
or delamination front detection and the measurement of the kinetics of polymer delamination front 29
propagation in atmospheric corrosion [20,21]. SKP showed that delamination of a polymer with weak 30
adhesion to zinc is mainly cathodically driven [22]. In immersion conditions, electrochemical impedance 31
spectroscopy (EIS) is the most used technique to detect interfacial disbondment from an artificially 32
introduced defect as well as to monitor the polymer coating degradation [23,24,25].Different approaches 33
have been developed to quantify the global degradation phenomena in painted systems: water uptake, 34
diffusion of soluble ions, evolution of the total delaminated area etc. [26,27,28]. To localize the 35
disbondment at polymer-metal interface, Local Electrochemical Impedance Mapping (LEIM) [29,30] and 36
Scanning Vibrating Electrode (SVET) [31] can both detect the electrochemical reactivity in delaminated 37
areas and distinguish the anodic and the cathodic reactive zones. However, contrary to LEIM, SVET cannot 38
detect the underpaint reactivity in the absence of a defect in the paint. In addition, a quantitative LEIM 39
was recently proposed to study the disbondment front propagation kinetics [32] during immersion. 40
However, it should be mentioned that most of previously reported studies on local degradation of 41
metal/oxide/polymer interfaces using local electrochemical techniques concerned the interface 1
delamination starting from an artificial defect, intentionally introduced at the metal/oxide/polymer 2
interface or in the coating prior to the aging process. 3
4
For an undamaged coated surface, in addition to long term immersion, AC-DC-AC accelerated 5
electrochemical degradation procedure via alternating cathodic polarization (DC) and EIS measurement at 6
open circuit potential (AC) [33] is often used. Depending on the potential of the cathodic polarization 7
during AC-DC-AC procedure, it can either be used to assess the polymer stability [34,35], or to study the 8
underpaint reactivity and delamination [36]. The application of cathodic potential promotes the initiation 9
and propagation of the metal/oxide/polymer interface degradation [37]. Under polarization lower than -10
1 V/SHE, both the oxygen reduction (Eq. 1) and the water reduction (Eq. 2) can occur [38] thus leading to 11
a pH increase at the buried metal/oxide/polymer interface. Using pH sensitive indicator like 12
phenolphthalein, these cathodic reactive areas can be evidenced by in situ Time Lapse Microscopy (TLM) 13
of the sample surface [39,40]. 14 O2 + 2 H2O + 2 e- H2O2 + 2 OH- (1.a) 15 H2O2 + 2 e- 2 OH- (1.b) 16 2 H2O + 2 e- H2 + 2 OH- (2) 17 18
In the case of large cathodic over-potentials, high local pH, peroxides and free radicals can also damage 19
the polymer matrix; the polarization conditions should then be chosen carefully for each system and 20
should take into account the chemistry of the organic coating. 21
Epoxy resins are among the most used primers for Zn alloys because of their hydrophobicity and their 22
ability to incorporate fillers and pigments for corrosion inhibition, anti-fouling, self-healing, etc. [41]. Due 23
to the high impedance of thick commercial epoxy coatings and the presence of numerous additives, in situ 24
study of the underpaint reactivity in such a system by means of electrochemical tests, vibrational 25
spectroscopy and/or optical microscopy is often difficult and the results interpretation can be 26
controversial. In order to understand the underpaint reactivity, the use of a model polymer seems to be a 27
promising approach [42]. In the literature, several weakly adherent coatings, like polyvinyl butyral (PVB) 28
or polyvinyl alcohol (PVA), were used in SKP studies of underpaint reactivity [43,44]. However, they do not 29
sustain long term immersion because of their high solubility in water and weak adhesion to metallic 30
substrates [45]. For stability evaluations in long immersion and aggressive aging tests, some groups 31
performed experiment using thick epoxy polymers [29, 46]. Nonetheless, the measurements were either 32
made in atmospheric conditions or required to introduce a well localized artificial defect in the coating or 33
at the interface prior to the degradation procedures. The latter can influence the degradation mechanisms 34
and is not appropriate if the initial degradation is of interest. 35
Electrochemical impedance studies demonstrated that polymer also degrades in electrochemical 36
tests (see for instance [47,48]); however, to our knowledge, a combined approach, taking into account the 37
possible evolution of all the components of metal/oxide/polymer interfaces is still missing. It seems hence 38
to be timely to develop an experimental approach able to consider the initiation and propagation of the 39
underpaint reactivity and dissociate the intrinsic interface response from the possible polymer evolution 40
under electrochemical testing of buried metal/oxide/polymer interface. The later requires the 41
development of a model thin epoxy coating with a good adhesion to metal interfaces and characterized 42
stability [49],[50]. The model polymer should be homogeneous in terms of chemical composition and 1
thickness, thin enough for in situ electrochemical impedance measurements, transparent in the visible 2
light for an optical survey of the substrate/polymer interface and be stable to sustain AC-DC-AC procedure. 3
4
In this work, a new methodological approach is proposed for in situ accelerated mechanistic study of 5
the underpaint stability of zinc alloy/epoxy interfaces in immersion condition without introducing an initial 6
defect in the coated system. The methodology includes a specific aging procedure to accelerate the 7
interface degradation and the use of an optimized model epoxy polymer, meeting the requirements listed 8
above. The validation is made for a zinc alloy with Cr(III) conversion coatings designed for epoxy painting. 9
10
2. Materials and methods
112.1. Materials
12
2.1.1. Substrates preparation 13
Two substrate materials were used: hot dip galvanized zinc and zinc alloy coated steel. 14
Zn coated (hot dip galvanized, 0.2 wt. % of Al in the coating) plates of low carbon steel were used to 15
test the developed epoxy coatings, because the behavior of this material is well known and the response 16
of the epoxy can be easily distinguished from the response of Zn substrate. Prior to the application of 17
organic coating, the Zn samples were rinsed with Milli-Q water and degreased in 1 M NaOH solution for 18
30 s to remove the oxide layer and then rinsed with Milli-Q water and absolute ethanol before being dried 19
with compressed air. 20
Zinc-nickel alloy coating was used as the substrate for the conversion coating study. The alloy was 21
prepared by a following procedure. Steel plates of 1015 cm² were degreased and grit-blasted. 22
Electrodeposition of Zn alloy was performed in alkaline 12-16 % ZnNi bath for 45 minutes at applied current 23
of 3 A/dm². After electrodeposition, the samples were rinsed with deionized water for 10 min and dipped 24
in trivalent chromium passivation bath, then rinsed for 3 min in deionized water and dried with 25
compressed air. Relief-baking of the samples was performed at around 200 °C for 23 h to alleviate 26
hydrogen embrittlement. X-ray fluorescence (XRF) measurement was performed by Fisherscope X-Ray 27
XDAL and showed 18 ± 2 µm in thickness and 14 ± 2 % in nickel composition. X-ray diffraction (XRD) 28
measurement was performed by Empyrean Panalytical and showed only the presence of the gamma phase 29
(Zn11Ni2). The Cr(III) content at the top surface was found to be between 5 and 9 at. % from the XPS 30
measurement. 31
In order to reduce adhesion of polymer coating to the substrate, conversion coating was modified for 32
some samples. For this, the samples of Zn alloy with conversion coating were immersed in 0.1 M NaOH for 33
5 s then rinsed with milli-Q water and dried with compressed air before application of polymer coating. Zn 34
alloy samples with modified conversion coating are referred as “samples of type 1” while the Zn samples 35
with non-modified conversion coating are referred as “sample of type 2” below. XPS characterization of 36
the surface could not evidence a chemical composition difference between the two types of coating within 37
a 2 % accuracy, which is consistent with the accuracy of the XPS measurement on rough surfaces. 38
For the model epoxy coating and degradation tests, 55 cm² samples were cut from the central part 1
of each 1510 cm² plate to prevent the edge effects that can be observed in electrodeposition process. 2
Prior to the polymer coating, the samples were stored in a desiccator. 3
4
2.1.2. Epoxy coating 5
The model epoxy formulation was a DiGlycidyl Ether of Bisphenol-A prepolymer and TriEthylene 6
TetrAmine hardener (DGEBA-TETA) used in (1:1) ratio. One should note that Bisphenol-A is currently listed 7
in the Candidate List of substances of very high concern, however in this work it is not proposed for 8
industrial application but for methodological demonstration. If the method is applied at large scale, 9
alternative epoxy coating could be formulated. For viscosity requirements, the preparation was diluted in 10
3 mL of ethanol (analytical grade) for 4 g of mixture. Prior to spin-coating procedure, the preparation was 11
placed in a hermetic beaker and mixed at 300 rpm for 20 minutes then left to stand for 15 minutes in order 12
to remove air bubbles. 13
Just before the coating application, the surface of the substrate was rinsed with absolute ethanol to 14
improve the surface’s wettability. The polymer coating was deposited by spin coating process using a 15
POLOS SP15 spin-coater. Once the sample was placed and held in the spin-coater, the resin was poured in 16
large excess and spread on the whole surface, the spin coating was performed twice with a 15 s relaxation 17
time in between with following parameters: 3000 RPM rotary speed and 500 RPM/s linear acceleration for 18
35 s. After spin-coating, the samples were cured at 50 ± 5 °C for 14-16 h for curing and desolvatation [51]. 19
With this procedure, the obtained coating’s thickness controlled by optical microscopy (see section 20
2.2.2. for details of optical measurement) was ca. 10 ± 1 µm. 21
The samples were stored in a desiccator between the coating application and the degradation test. 22
Degradation tests were made in the following week. 23
The chemical bonds formed after curing for stoichiometric formulation were reported in literature [52] 24
and are schematically presented in Fig. 1 [53]. 25
<Fig. 1> 26
For the tests eight 55 cm² samples of each type (type 1 and type 2 described in section 2.1) were 27
coated with model epoxy polymer and tested with the adapted AC-DC-AC procedure as detailed hereafter 28
(see section 2.3.2). For comparison, additional four samples (size 1015 cm², two of each type) were also 29
coated with a 60 µm thick layer of a commercial epoxy primer paint. The last four samples were used in 30
1000 h immersion test and AC-DC-AC degradation tests. These panels are named hereafter as “industrial 31
epoxy coating”. gTo distinguish the same substrates covered with two different coating, the letter A is 32
added to the name/type of the sample with the industrial thick epoxy coated samples and the letter B for 33
the samples with model epoxy. The combinations of studied substrates and coatings are summarized in 34
Table 1. 35
<Table 1> 36
2.2. Polymer characterization
1
No specific drying procedure was used before ex situ measurement except the electrolyte removal 2
from the surface by compressed air. The evolution of the hydrophobic properties of the polymer were 3
followed by static drop contact angle measurements using a Dataphysics OCA 15EC Package 2 contact 4
angle automatic system with SCA 20 software module using a drop of 25 µL Quartex water deposited from 5
1 cm height. Each measurement was repeated 3 times with 3 drops and 3 different locations on each 6
sample. 7
The chemical evolution of the polymer matrix was studied by Attenuated Total Reflectance Infrared 8
Spectroscopy (ATR-IR) with Bruker Tensor 27 equipped with a Pyke MIRacleTM single reflection ATR. ATR 9
was used in a standard configuration with the coating directly pushed against the crystal. Each IR spectrum 10
was recorded from 4000 to 400 cm-1 with a resolution of 2 cm-1 and integrated over 512 cycles, at least 11
two spectra were measured for each sample at two different locations. Before every ATR measurement, 12
the crystal was cleaned with absolute ethanol and a background measurement was performed for the 13
cleaned crystal. Before the measurement, a spectrum of a reference coated sample stored in a desiccator 14
was recorded. Thus, the reproducibility of the measurement could be verified so that normalization of the 15
IR spectra of degraded samples was unnecessary. This protocol was proposed since during degradation of 16
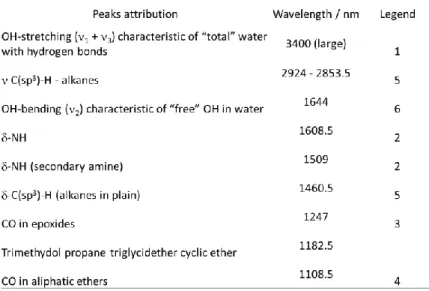
the polymer coating no constant peak could be defined in the ATR-IR spectra. The peaks positions of the 17
characteristic functional groups in DGEBA-TETA epoxy resin followed in this study [54,55] are presented in 18
Table 2.
19
<Table 2> 20
Optical characterization of the samples was performed using a Keyence VHX-5000 3D microscope. Due 21
to its short depth of focus (< 1 µm), it was possible to measure the thickness of the model epoxy by focusing 22
alternatively on the non-coated substrate and on the top of the transparent coating using the reflection 23
of the confocal light source. It was also used to observe the presence of corrosion products under the 24
coating, as well as the deformation of the top surface of the coating in 3D-composition mode. 25
26
2.3. Degradation procedures
27
Three different degradation procedures were used. One sample was also kept in a desiccator after 28
curing to obtain the evolution of a reference coating. 29
1. A humid chamber was used the first stability verifications of the model epoxy. Two samples were 30
kept above 90 % relative humidity at room temperature. For contact angle and ATR-IR measurements, 31
every hour they were taken out, rinsed with Milli-Q water and dried with compressed air before placed 32
back in the humid chamber. 33
2. An immersion was used to verify immersion stability of the model epoxy. Four samples were 34
immersed in 25 mL solution of 0.01 M NaCl with 1 wt. % of phenolphthalein in a sealed glass cell of 4.4 cm 35
in diameter at room temperature. According to the literature, the influence of the phenolphthalein on the 36
cathodic reactivity of polymer/zinc alloy interface can be neglected32. To perform ex situ measurements 37
during immersion, samples were rinsed with milli-Q water and dried with compressed air before 38
measurements and placed back to the immersion solution in less than 5 min. Immersion electrolyte was 39
kept in a beaker during ex situ characterization and poured into the electrochemical cell to continue 1
immersion test. 2
3. An AC-DC-AC test was applied to study the metal/oxide/polymer interface stability. For this test an 3
electrochemical cathodic polarization cycling was performed on 5 coated samples. The samples were 4
immersed for 1 hour in 25 mL of 0.01 M NaCl with 1 wt. % of phenolphthalein at room temperature to 5
reach a stable value of open circuit potential (OCP). After the first EIS measurement, AC-DC-AC cycling was 6
performed as presented in Fig. 2. It consisted of 15 minutes of cathodic polarization at -1.5 V/Ag/AgCl 7
followed by 15 min immersion at OCP and a remaining period of 30 min for different measurements at the 8
OCP. The procedure lasted 7 cycles for a total duration of 8.5 hours. After the cycling and before ex situ 9
characterizations the sample was rinsed with milli-Q water and dried with compressed air. 10
<Fig.2> 11
12
2.4. Electrochemical characterization and Time Lapse Microscopy
13
Electrochemical impedance spectroscopy (EIS) was performed using a Solartron Modulab potentiostat 14
with ECS software interface. The three-electrode electrochemical cell consisted of a silver/silver-chloride 15
(Ag/AgCl) reference electrode (RE), a 6.6 mm in diameter graphite rod as counter electrode (CE) and the 16
coated sample as working electrode (WE). The cell was placed in a Faraday cage to avoid external 17
interferences. EIS spectra were carried out at the OCP from 100 kHz to 0.1 Hz with 6 points per frequency 18
decade and 10 mVRMS sinewave signal. Evolution of the low frequency (0.1 Hz) impedance modulus was 19
used for tracking the stability of the metal/oxide/polymer interface. 20
Separately, local electrochemical impedance mapping (LEIM) was performed on three additional 21
samples under AC-DC-AC tests. The electrochemical setup is described in detail in [30]. The local probe 22
consisted of two Ag wires of 150 µm in diameter sealed in twin-capillaries using 3M glue. The distance 23
between the two wires was 400 µm. The capillaries were bended so that the Ag electrodes were 24
perpendicular to the surface of the sample, and thus, only the normal contribution of the current density 25
was monitored. AgCl was deposited on both Ag electrodes of the probe prior to LEIS experiment by 5 min 26
potentiostatic oxidation at 0.4 V/Ag/AgCl in 0.5 M NaCl solution. OCP and EIS measurements of the 27
Ag/AgCl surfaces of the probe were performed during its immersion in 0.01 M NaCl solution at different 28
times between 5 min and 10 h after the preparation of the probe to verify its stability. A home-made setup 29
using Solartron Modulab software with auxiliary input and a 3-axis stepper motor-controlled by Sensolytics 30
was used for LEIM measurements. The working electrode was a 2 cm diameter sample’s surface. The 31
counter electrode was a 3 cm diameter toroid of platinum wire placed above the surface of working 32
electrode to guarantee symmetrical distribution of the current lines. During the measurement, the probe 33
to sample distance was fixed at 100 ± 25 µm. For electrochemical impedance mapping, the potential 34
oscillation was set to 15 mVRMS and 100 Hz; the X-Y maps consisted of a square grid of 3131 points distant 35
of 100 µm to cover a 33 mm² area, the mapping was performed in 18 min. 36
In situ time lapse microscopy (TLM) using an HD USB microscope with 2 MP CMOS detector and a 4000
37
K white LED enlightenment was set up in the electrochemical cells for both AC-DC-AC and local 38
electrochemistry tests. The objective to surface distance was set to 4 cm for a magnification of 80, leading 39
to a 100 µm² pixel size. A picture was taken every minute during immersion. Local underpaint cathodic 40
reactivity was detected from the color change of phenolphthalein, turning from colorless to pink color in 1
the pH range of 8.2 - 10. The increase of pH due to cathodic OH- release (reactions 1-2) is relevant for both, 2
immersion and cathodic polarization. Percolation of the polymer and opening of pores could also be 3
observed by TLM during immersion test. During cathodic polarization in the AC-DC-AC test, the localized 4
hydrogen evolution can be monitored. 5
The experiments were made in a closed system in order to limit evaporation and keep constant 6
electrolyte level (marked in the cell). This was achieved with the use of parafilm grafting tape, sealing the 7
electrochemical cell and the parts of the setup (objective etc.). The electrolyte level visually stayed 8
constant during 7.5 hours of the testing procedure. 9
Degradation procedures and characterizations used for the evaluation of the samples of different 10
types are listed in Table 1. 11
12
3. Results
133.1. Stability of the epoxy coating on Zn substrate during immersion
14
Fig. 3.a shows typical ATR-IR spectra of the epoxy coated Zn samples at different times of immersion.
15
The peaks attribution is shown in Table 2. The peaks referred as 6 and 1 correspond to characteristic peaks 16
of OH- groups for scissors and stretching vibrations. The scissors vibration at 1644 cm-1 is related to the 17
water molecule and is referred as “free OH” while the stretching vibration at 3400 cm-1 is related to all the 18
OH groups and is referred as “total OH” [56,57]. The evolution of the peak’s intensities averaged for the 19
four immersed samples and the standard deviation are presented in Fig. 3.c. Both intensities increase and 20
follow the same exponential trend (Eq. (3)) for the first 65 h. This trend is consistent with the water uptake 21
of the coating, which seems to reach the saturation level from 20 to 25 hours of immersion: both peaks 22
intensities associated with OH become stable. After 65 to 77 h of immersion, the intensities of these peaks 23
change suddenly: the peak 1 corresponding to the “total OH” increases, whereas the peak 6 associated 24
with the “free OH” decreases. This change in intensity is attributed to chemical evolution within the epoxy 25
polymer coating occurring at around 70 h of immersion in a 0.01 M NaCl solution. The experimentally 26
observed evolution of the OH-group peaks intensities with time could be fitted with the empirical equation 27
(3) for both OH peaks. 28
𝐴(𝑡) = 𝑨sat− 𝐴1 × 𝑒−𝑏×𝑡 , (3)
29
In equation (3), t is the immersion time, A(t) is the peak intensity at time t, 𝑨sat is the peak intensity
30
at saturation, A1 is the pre-exponential factor, and b is the exponential time constant obtained from the
31
fitting. The value b = 0.16 ± 0.01 s-1 was the same for both “free OH” and “total OH” peaks evolution. 32
33
Fig. 3.d shows the average evolution of the intensities of the peaks attributed to the typical organic
34
bonds in DGEBA-TETA epoxy coating 2, 3, 4 and 5 in Table 2 for the four samples during immersion. For 35
clarity, standard deviation of the measurement is not shown in the figure; however, the tendency was 36
similar for all four samples. Their intensities are stable for the first 60 hours of immersion; therefore, it can 37
be considered that only water uptake occurred during this period. After 60 hours, all the peaks’ intensities 38
attributed to the typical organic bonds in epoxy matrix (see Table 2) decrease strongly. This intensity drop 39
coincides with the change in behavior of the two peaks corresponding to OH positions. These trends 40
confirm that the model DGEBA-TETA epoxy coating starts to degrade after around 70 hours of immersion 1
in a 0.01 M NaCl solution at room temperature. 2
<Fig. 3> 3
In addition to ATR-IR spectra, the evolution of the contact angle is shown in Fig. 4.a. The contact angle 4
of the reference sample stored in humid air was also measured for comparison. Under both conditions, 5
immersion and humid air, the contact angle drops from 75° to around 70° during the first hour that 6
evidences a first decrease in hydrophobicity. This can be attributed to the hydration of the top surface of 7
the epoxy coating. Until the 70th hour, the contact angle remains stable (70° for all samples). After 70 hours 8
of immersion, the contact angle decreases down to 60° and the values become more scattered depending 9
on the analyzed areas. The increase in hydrophilicity of the coating corroborates with ATR-IR results: a first 10
phase of water accumulation within the firsts hours, a saturation of water and stability domain of the 11
system up to 50 hours and after 60-70 hours, the beginning of model epoxy matrix degradation. 12
<Fig.4> 13
In situ optical TLM images (Fig. 5 a) show no change of the surface up to 50 hours of immersion.
14
Between 50 and 75 hours of immersion (Figs. 5b, d, and e) localized porosity appears and formation of 15
corrosion products becomes visible around some open pores. A sudden formation of corrosion products 16
with the opening pores could indicate the onset of Zn dissolution under the coating prior to the coating 17
degradation and the decrease in the cross linking. This initial underpaint reactivity can be possible due to 18
porosity of the polymer coating. Fig. 5.c and f show the coating analysis in 3D microscope after 10 hours 19
and 75 hours of immersion consequently. The images are reconstructed using a high-resolution 3D-20
composition over 20 optical images taken over 9 µm depth range. The colors are attributed to light 21
reflection, thus corresponding to the deformation of the coating due to the growth of corrosion products 22
underneath the coating or by swelling. It can be seen that the coating surface is significantly deformed 23
after the immersion test (Fig. 5.c) if compared to non-deformed state (Fig. 5. f), which can be attributed 24
to the swelling of the polymer and also is coherent with the ATR IR observed water content increase. The 25
coating deformation is measured to be ca. 8 µm protruding above the initial coating surface. 26
<Fig. 5> 27
Typical electrochemical impedance spectra of the Zn coated samples after 1 and 72 hours of 28
immersion are presented in Fig. 6.a. The EIS spectrum after 1 h of immersion shows two separate 29
depressed semi-circles attributed to the polymer coating in the high frequency domain (1000 – 5 Hz) and 30
the double layer at the metallic interface in the lower frequency domain (5-0.1 Hz) as reported in 31
literature24. After 1 h of immersion the presence of second semi-arc at low frequencies clearly shows the 32
existence of a double layer capacitance with a value of ca. 1 µF cm-2. It clearly indicates that the polymer 33
coating is highly porous so that water can reach the metallic substrate during this period of immersion. 34
Moreover, it evidences also that the metallic surface is not entirely covered by the model epoxy coating, 35
i.e. there are some zones with pre-existing disbondment at the metal/oxide/polymer coating interface. 36
The Nyquist plot after 72 hours of immersion shows a single depressed semi-circle attributed to the 37
response of the delaminated metallic surface. However, the contribution from the polymer coating and 38
and the corrosion product layer cannot be completely excluded at this time. A thorough data analysis with 39
the fitting was attempted but no simple equivalent circuit was found to fit correctly this single time 40
constant. Various parameter combinations could give valid fitting without proper physical meaning. 41
The evolution of the electrochemical impedance modulus at 0.1 Hz during the immersion is presented 1
in Fig. 6.b. The impedance value of ca. 30 k cm2 remains stable with an abrupt drop at 50 hours to a 2
steady value of ca. 5 k cm2. The decrease of electrochemical impedance modulus can be explained as a 3
loss of adherence and the degradation at the paint/metal interface due to the formation of pores in the 4
coating. It should be noted that the polymer composition remains stable during 50 hours as confirmed 5
from ATR-IR and TLM observations (vide supra). 6
<Fig. 6> 7
3.2. Stability of the epoxy coating on Zn substrate under AC-DC-AC cycling
8
In order to prove the applicability of the proposed model epoxy coating for a fast-electrochemical 9
assessment of epoxy paint/metal interface, the evolution of the model epoxy coating was surveyed during 10
the AC-DC-AC test. 11
The ATR-IR spectra on Fig. 3.b show no variation in the peak intensities related to the characteristic 12
groups of the epoxy matrix except the peak 5 corresponding to the C-H bond, while both peaks 13
corresponding to “free OH” and “total OH”, see Table 2, increase in intensity which is relevant to water 14
uptake. In addition, the hydrophobicity measured by contact angle remains stable throughout the 6 15
polarization cycles, as presented in Fig. 4.b. The results are coherent with water uptake in the polymer 16
pores without polymer degradation. As for the immersion test, electrochemical impedance at low 17
frequency, shown in Fig. 6.c, is also stable for 4 cycles and decreases after the 5th cycle. 18
It can be then concluded, that the proposed model epoxy coating can sustain up to 50 hours of 19
immersion or 7 cathodic polarization cycles without degradation. In addition, with both degradation 20
procedures, the polymer did not show any sign of degradation until the disbondment occurred at the 21
metal/oxide/polymer interface [58]. 22
23
3.3. Zn alloy/oxide/model epoxy interface evolution under modified AC-DC-AC test
24
The developed epoxy coating was applied on the Zn alloy with two types of conversion coating defined 25
as described in the experimental part (section 2.1.1: damaged and undamaged samples corresponding to 26
sample 1 and sample 2, respectively). The modified AC-DC-AC procedure was used to compare the 27
electrochemical stability of zinc alloy/conversion coating/polymer interfaces in these two systems. 28
In the first step, the behavior of two types of samples without application of the polymer was 29
compared. After one hour of immersion in a 0.01 M NaCl solution, the OCP of both types of samples was 30
around -0.56 V vs. Ag/AgCl. Furthermore, the samples with both types of conversion coating show a similar 31
EIS response (Fig. 7.a). A slight difference in the roughness of the Zn alloy substrate can change the angle 32
in the CPE used for the fitting [59], and can explain the slight differences in the shape of the Nyquist plot. 33
<Fig. 7> 34
In contrast, once the samples are coated with the model epoxy coating (referred as type 1B and type 35
2B in Table 1), the electrochemical behavior of the two systems is quite different (Fig. 7.b). The steep 36
decrease in the low frequency electrochemical impedance modulus (|Z| 0.1 Hz) from the 3rd cycle (Fig. 37
7.c) shows an important increase of the system reactivity in the case of the samples of type 1, while the
impedance modulus value remains almost the same for the samples of type 2 during all the 7 cycles. For 1
comparison, in the Zn samples without conversion coating (Fig. 6), the degradation of the 2
metal/oxide/polymer interface was visible from the sharp decrease of electrochemical impedance 3
modulus. Thus, the difference in the evolution of the EIS of Zn alloy with conversion coatings of type 1 and 4
2 (sample type 1B and 2B) with cycling reveals a lower adherence of the model paint to the substrate in 5
the case of type 1 samples than in the case of type 2 substrates. 6
The in situ microscopy images of both samples after 3 and 5 degradation cycles are presented in Fig. 7
8. The sample of type 1B (Fig. 8 left) shows a more significant cathodic hydrogen evolution (Eq. 2) than the
8
sample of type 2B as it can be evidenced by the bubbles present on the surface. In addition, the spreading 9
of pink-colored areas on the surface of type 1B sample indicates the presence of OH- ions (Eq. 1 and Eq. 2) 10
inside and over the coating because of the phenolphthalein indicator in the electrolyte. Although the 11
oxygen reduction reaction can occur during the modified AC-DC-AC degradation cycling for both types of 12
samples, no OH- were detected by the indicator on the sample of type 2B (Fig. 8 right). 13
<Fig. 8> 14
Thus, in situ TLM confirms EIS results under modified AC-DC-AC procedure: samples of type 1 show a 15
much weaker bonding at the metal/oxide/polymer interface than the samples of type 2. The difference in 16
the surface properties of the sample type 1 and type 2 was not observed by EIS before epoxy coating 17
application, however the proposed AC-DC-AC procedure applied on the epoxy coated samples in 18
combination with EIS and TLM observations allowed easily to evidence a difference between these two 19
types of samples. 20
3.4. Spatial distribution of underpaint reactivity
21
Fig. 9 a presents an example of in situ image of a sample of type 1B, coated with the developed epoxy
22
coating. The picture was taken after the relaxation step of the 4th AC-DC-AC cycle, just before the LEIM 23
measurement. Localized hydrogen evolution as well as slightly pink areas corresponding to oxygen 24
reduction reaction sites are clearly visible in the figure. Fig. 9 b shows the LEIM map of the modulus of the 25
local electrochemical admittance, i.e. the inverse of impedance, recorded at the 33 mm² area delimited 26
by black square on the TLM image in Fig. 9 a. While TLM shows no visual degradation (no pores in the 27
polymer, no corrosion products, no pink color indicating high pH) until at least 3 cycles, LEIM clearly 28
demonstrates inhomogeneous distribution of the local admittance, revealing localized damage at the 29
metal/oxide/polymer interface. Indeed, the zones indicated by red color in Fig. 9 b have the values of 30
admittance about one order of magnitude higher compared with the other parts of the scanned surface. 31
The measured admittance values up to 0.5 2 S cm-2, meaning the current is in the mA range, ensure that 32
the developed epoxy coating allows a proper measurement of the underpaint reactivity. One should note 33
that even if Fig. 9 illustrates only one example of the zone with LEIM detected inhomogeneous reactivity, 34
strongly inhomogeneous degradation was detected in multiple locations for the samples of Type 1. For 35
comparison, in the same testing procedure, the samples of Type 2 did not show degradation neither by 36
TLM (Fig. 8 b) nor by LEIM (not shown). 37
<Fig. 9> 38
In order to verify that the interface evolution under the model thin epoxy polymer is coherent with 39
the degradation expected under a thick strong industrial epoxy polymer, and in order to verify if the 40
difference between the conversion coatings of type 1 and type 2 can be detected by LEIM under such a 1
thick layer, additional tests were made with the samples 1A and 2A, coated by industrial paint. 2
The samples of type 2A with thick coatings did not evolve neither in TLM nor in LEIM during 10 AC-DE-3
AC cycles and are not shown in the figures. The samples of type 1A coated with the same industrial paint 4
formed blisters during cycling. Fig. 9 c shows a typical in situ TLM image of a sample of type 1, coated with 5
industrial epoxy coating after 10 AC-DC-AC cycles. Blisters are clearly visible on the surface, indicating 6
localized degradation of the metal/oxide/polymer interface in their vicinity. The black square on the TLM 7
image represents the 44 mm² area scanned by LEIM. The LEIM measured at 100 Hz is presented in Fig. 9 8
d. At the same time, the LEIM map shows a homogenous distribution of admittance values around 0.2 S
9
cm-2. Although the presence of degraded area on the sample detected by TLM, the high impedance of the 10
applied epoxy primer masks the electrochemical response from the metal/oxide/polymer interface in the 11
case of our small local impedance probe. 12
Finally, several samples of type 1A and 2A with industrial coating were immersed for 1000 hours in the 13
demineralized water. After the test, the samples of type 1A were blistered while the samples of type 2A 14
did not. To conclude, the LEIM experiments with model epoxy clearly distinguished two types of 15
conversion coatings, evidenced the localized character of degradation and gave the relative stability order 16
similar to the order obtained in immersion tests and AC-DC-AC tests of the same substrates coated by 17 industrial coating. 18 19
4. Discussion
204.1. Speculative degradation mechanism of model epoxy
21
Three steps of evolution were observed for the model zinc/epoxy interface with developed DGEBA-22
TETA epoxy polymer exposed 0.01M NaCl electrolyte, as demonstrated by combined EIS, ATR-IR and 23
contact angle measurements: 24
- A saturation of the model epoxy coating by water reaching the metal/oxide/polymer interface during 25
the first hours; 26
- A stable behavior of the polymer coating until the polymer disbondment at the metal/oxide/polymer 27
interface at around 50 hours of immersion; 28
- A polymer coating degradation after 70 h of immersion. 29
In situ TLM demonstrated the emergence and the opening of pores, the percolation of the epoxy coating,
30
which can be attributed to a decrease of the cross-linking of the polymer. The evolution of the ATR-IR 31
peaks corresponding to characteristics bonds of epoxy polymer also evidences that the organic bonds were 32
most likely broken during the polymer’s degradation (Fig. 1.b). Our results also demonstrated that the 33
degradation of both the metal/oxide/polymer interface and the epoxy coating was enhanced by the 34
cathodic polarization cycling of the coated samples. During AC-DC-AC aging procedure, hydroxides ions 35
were detected by TLM, which is in agreement with Eq. 1. 36
The degradation mechanism of the polymer coating seems hence to be driven by the local pH increase. 37
Consequently, with a stronger metal/oxide/polymer interfacial bonding the cathodic current under 38
polarization cycling would be reduced leading to a less significant increase of pH under the paint. Hence, 39
the developed model epoxy coating could sustain more severe AC-DC-AC degradation test, such as lower 1
potential or increased number of cycles, for the systems with optimized conversion coating. 2
Leached by the substrate anodic dissolution metallic cations or possible presence of intermediate 3
peroxides formed by the cathodic reactions reported in Refs. [60,61] could also accelerate polymer 4
degradation, however our work is not able to confirm or disclaim their production and their role in the 5
degradation mechanism. 6
7
4.2. Applicability of the modified AC-DC-AC protocol to discriminate conversion coatings
8
The combination of local electrochemical impedance and in situ Time Lapse Microscopy evidenced 9
that the methodology using DGEBA-TETA polymer coating and modified AC-DC-AC procedure permitted 10
to detect localized metal/oxide/polymer interface degradation. A speculative schema of the 11
metal/oxide/polymer interface degradation process induced by the test is presented in Fig. 10. Once water 12
and aggressive species diffuse through the polymer and reach the metal/polymer interface, deadhesion is 13
stronger for conversion coating of type 1 samples than for type 2 samples. More intensive cathodic 14
reaction leads to a quicker evolution of the impedance modulus with time for type 1 samples than for type 15
2 samples. Finally, hydroxides generated at the interface, diffuse through the coating and degrade the 16
polymer, which arrives quicker for the type 1 sample than for type 2 sample. 17
<Fig. 10> 18
The approach allowed to discriminate two conversion coatings on Zn alloys as a function of their ability 19
to form a stable metal/epoxy polymer interface. The proposed methodology is of great interest, because 20
the results can be obtained in approximately 24 hours (1 hour for the coating preparation, 14 hours for 21
curing, 9 hours for the measurements), in comparison to the commonly used 1000 hours of immersion. 22
Thus, this methodology can be used as a fast and smart screening test of conversion coatings on Zn alloys 23
for epoxy primers compatibility. In addition, it could give more comprehensive insights into the 24
degradation mechanism of the metal/oxide/polymer interface such as its sensitivity to cathodic 25
delamination. The combination of TLM and LEIM can indicate the heterogeneous or homogeneous nature 26
of the metal/oxide/polymer disbandment at different scales and with a spatial resolution of approximately 27
100 µm. 28
The proposed methodology evaluates the intrinsic stability of conversion coating in confined zones 29
under epoxy polymer and discriminates coating with close chemistry. Such an approach however cannot 30
take into account possible variations of conversion layer stability related to interactions between the 31
conversion coating and an industrial epoxy polymer, containing numerous additives. Comparison of 32
conversion coatings with very different chemistry and hence probably different degradation mechanisms 33
can be also erroneous without additional characterizations. Though, chemical characterization of the 34
interface and of the effect of the polymer chemistry on the stability of the conversion layer with several 35
model polymers could nicely complete the proposed approach. 36
4.3. Physical interpretation of LEIM on undamaged coated samples
1
Although LEIM is a common technique in the investigation of metal/oxide/polymer interface, most 2
published studies demonstrate that pre-degraded polymer coating with either scarification and/or drilling 3
of the coating was used to initiate the delamination process [29]. Other groups have studied blistering 4
mechanism, i.e. a destabilization of buried metal/paint interface via LEIM without the generation of a 5
localized defect in the coating. In most cases, the reactivity was enhanced at metal/oxide/polymer 6
interface by using either NaCl salt powder or a drop of NaCl solution at the defined area of the metal 7
substrate prior to the polymer coating deposition [62],[63]. Thus, in these experiments a detection of the 8
defect was foreseen. In our work, in order to initiate the metal/oxide/polymer interface reactivity, the 9
conversion coating was slightly degraded then the samples were cleaned prior to paint application so that 10
the loss of stability of the buried metal/oxide/polymer interface was only originating from the conversion 11
coating quality. According to our knowledge, this approach with the unknown random distribution of 12
surface defects before measurements, corresponding to the potentially weak interfacial bonding, was 13
used for the first time. 14
On the other hand, one could contest the accurate contribution of the underpaint reactivity detected 15
by LEIM in this work. Indeed, this technique is often used to detect defects within the organic coating itself 16
more than at the hidden metal/oxide/polymer interface [64]. One could then wonder whether the active 17
sites detected by LEIM were related to interfacial reactivity or to intrinsic defects in the polymer like a 18
localized higher porosity of the model coating [65] or locally thinner polymer [66] as described in the 19
literature. Indeed, the existence of local high porosity in the polymer coating could induce a higher 20
diffusion of oxygen under cathodic polarization and therefore, pH increase leading to the locally 21
accelerated disbondment. A corollary hypothesis would be that these intrinsic defects in the polymer 22
coating could result from the presence of a locally damaged conversion coating underneath: during the 23
paint application and curing, the constraint relaxation within the polymer coating could lead to a 24
segregation of intrinsic defects in the vicinity of a locally weaker metal/oxide/polymer interface. However, 25
as described by Taylor et al. [65] the presence of underpaint reactivity and, therefore, the corrosion 26
products in the pores leads to an enhancement of the barrier effect, thus, the increase of impedance 27
modulus of the system. It was pointed out, that the deposition of zinc corrosion products occurs very 28
shortly after the pore opening in the coating, indicating that the underpaint metal already reacts. 29
The question of the initiation of the local reactivity remains uncertain, both metal/oxide/polymer 30
disbondment and intrinsic defect in the polymer could be the origin of the local reactivity, and might also 31
be linked one to another. Still, this behavior was only evidenced on the samples of type 1, i.e. with 32
supposedly weaker metal/oxide/polymer interface. 33
34
5. Conclusions
35A new methodology using a model epoxy polymer and adapted to an AC-DC-AC accelerated 36
degradation procedure was proposed to study and to understand stability of buried metal/oxide/polymer 37
interface. It allowed to discriminate conversion coatings on zinc alloys in terms of ability to generate a 38
stable metal/oxide/polymer interface in epoxy coated systems. The relative stability of two substrates with 39
model thin coating, evaluated in the developed electrochemical test, correlated with the observations 40
obtained for the same substrates coated with thick commercial epoxy primer after 1000 h of immersion. 1
The proposed testing procedure lasts less than 24 h compared with a classical immersion test, making it 2
interesting for the fast and smart ranking of the quality of conversion coatings. 3
In addition, the combination of in situ optical imaging and local electrochemical impedance in the 4
accelerated test allowed to identify the heterogeneous character of interfacial disbondment on a large 5
surface for which the possible locations from which the degradation can initiate are initially unknown and 6
randomly distributed. This allows to obtain reliable results without preliminary introducing of an artificial 7
defect as usually reported in the literature. The latter allows to have the true response of the sample 8
protected by the coating without having to ask the question of the driving role that the artificial defect 9
could have on the degradation of the coating. 10
References
1[1] T. Prosek, Mechanisms of degradation of organic coatings, The Journal of Association of Corrosion Engineers 61 (2017), 155-161
[2] G. W. Walter, A critical review of the protection of metals by paints, Corrosion Science 26 (1986), 27-38
[3] M. F. Montermor, Functional and smart coatings for corrosion protection: A review of recent advances, Surface and Coatings Technology 258 (2014), 17-37
[4] W. Funke, Towards environmentally acceptable corrosion protection by organic coating, Anti Corrosion (1984), 4-7
[5] W. Funke, Problems and progress in organic coatings science and technology, Progress in Organic Coatings 31 (1997), 5-9
[6] W. Funke, The role of adhesion in corrosion protection by organic coatings, Journal of the oil and colour chemists' association 68 (1985), 229-232
[7] G. L. Song, Surface Engineering of light alloys (2010), 3-39
[8] A.S.H. Makhlouf, Current and advanced coating technologies for industrial applications, Nanocoatings and Ultra-Thin Films (2011), 3-23
[9] T. Biestek, J. Weber, Electrolytic and chemical conversion coatings: a concise survey of their production, properties and testing, J. Electrolytic and Chemical Conversion Coatings (1976), 200
[10] J. Zhao, R.L. McCreery, G.S. Frankel, Effects of chromate and chromate conversion coatings on corrosion of
aluminum alloy 2024-T3, Surface and coating technologies 140 (2001), 51-57
[11] D. Gilroy, P.J. Eddowes, , F.L. Bentes, Techniques for assessing the protective properties of chromated conversion
coatings—Part II: Galvanized steel, Metal Finishing 94 (1996), 14-22
[12] C.S. Jeffcoate, H.S. Isaacs, A.J. Aldykiewicz, M.P. Ryan, Chromate in conversion coatings: a XANES study of its concentration and mobility, JOCS 147 (2000), 540-547
[13] U.S. EPA (1998) Principles of Environmental Impact Assessment Review: Appendix A: Environmental Impact Assessment Checklist
[14] European Commission regulation report n°2017/999 - REACH, Official Journal of European Union (2017) [15] G.D. Wilcox, J.A. Wharton, A review of chromate-free passivation treatments for zinc and zinc alloys, Transactions of the Institute of Metal Finishing 75 (1997), B140-B142
[16] G. Wilcox, Replacing chromates for the passivation of zinc surfaces, Transactions of the Institute of Metal Finishing 81 (2003)
[17] J.W. Bibber, Non-chrome-containing conversion coatings for zinc and zinc alloys: Environmentally friendly alternatives provide equal or better adhesion and corrosion resistance as conventional methods, Metal Finishing (106 (2008), 41-46
[18] R. Berger, U. Bexell, T.M. Grehk, S.E. Hörnstörm, A comparative study of the corrosion protective properties of chromium and chromium free passivation methods, Surface and Coating technologies 202 (2007), 391-397
[19] X. Zhang, C. van den Bos, W.G. Sloof, A. Hovestad, H. Terryn, J.H.W. de Wit, Comparison of the morphology and
corrosion performance of Cr(VI)- and Cr(III)-based conversion coatings on zinc, Surface and Coating Technologies 1999
(2005), 92-104
[20] A. Nazarov, D. Thierry, Application of Scanning Kelvin Probe in the Study of Protective Paints, Frontiers in Materials 6 (2019), art. 192
[21] M. Stratman, H. Streckel, R. Feser, A new technique able to measure directly the delamination of organic polymer films, Corrosion Science 32 (1991), 467-470
[22] W. Fürbeth, M. Stratman, The delamination of polymeric coatings from electrogalvanized steel – a mechanistic approach. Part 3: delamination kinetics and influence of CO2, Corrosion Science 43 (2001), 207-227
[23] A. Amirudin, D. Thierry, Application of electrochemical impedance spectroscopy to study the degradation of polymer-coated metals, Progress in Organic Coatings 26 (1995), 1-28
[24] J.N. Murray, Electrochemical test methods for evaluating organic coatings on metals: an update. Part III: Multiple test parameter measurements, Progress in Organic Coatings 31 (1997), 375-391
[25] P.L. Bonora, F. Deflorian, L.Fedrizzi, Electrochemical impedance spectroscopy as a tool for investigating underpaint corrosion, Electrochimica Acta 41 (1996), 1073-1082
[26] K. Ogle, S. Morel, N. Meddahi, An electrochemical study of the delamination of polymer coatings on galvanized steel, Corrosion Science 47 (2005) 2034-2052
[27] F. Deflorian, S. Rossi, An EIS study of ion diffusion through organic coatings, Electrochimica Acta 51 (2006), 1736-1744
[28] E. Akbarinezhad, M. Bahremandi, H.R. Faridi, F. Rezaei, Another approach for ranking and evaluating organic paint coatings via electrochemical impedance spectroscopy, Corrosion Science 51 (2009), 356-363
[29] J-B. Jorcin, E. Aragon, N. Pébère, Delaminated areas beneath organic coating: A local electrochemical impedance approach, Corrosion Science 48 (2006) 1779-1790
[30] V. Shkirskiy, A. Krasnova, T. Sanchez, A. Amar, V. Vivier, P. Volovitch, Development of anodic and cathodic blisters
at a model Zn/epoxy interface studied using local electrochemical impedance, Electrochemistry Communications 111
(2020), 106633
[31] J.J. Santana, J. González-Guzmán, J. Izquierdo, S. González, R.M. Souto, Sensing electrochemical activity in polymer-coated metals during the early stages of coating degradation by means of the scanning vibrating electrode technique, Corrosion Science 52 (2010), 3924-3931
[32] V. Shkirskiy, P. Volovitch, V. Vivier, Development of quantitative Local Electrochemical Impedance Mapping: an efficient tool for the evaluation of delamination kinetics, Electrochimica Acta 235 (2017) 442-452
[33] K.N. Allahar, G.P. Bierwagen, V.J. Gelling, Understanding ac–dc–ac accelerated test results, Corrosion Science 52 (2010), 1106-1114
[34] J.J. Suay, M.T. Rodríguez, R. Izquierdo, A.H. Kudama, J.J. Saura, Rapid assessment of automotive epoxy primers
by electrochemical techniques, Journal of Coatings Technology 75 (2003), 103-111
[35] M. Bethencourt, F.J. Botana, M.J. Cano, R.M. Osuna, M.Marcos, Lifetime prediction of waterborne acrylic paints
with the AC–DC–AC method, Progress in Organic Coatings 49 (2004), 275-281
[36] J. Hollaender, Rapid assessment of food/package interactions by electrochemical impedance spectroscopy (EIS), Food Additives and Contaminants 14 (1997), 617-626
[37] R. Montoya, F.R. García-Galván, A. Jiménez-Morales, J.C.Galván, A cathodic delamination study of coatings with
and without mechanical defects, Corrosion Science 82 (2014), 432-436
[38] H. Leidheiser, Cathodic delamination of polybutadiene from steel: a review, Journal of Adhesion Science Technology 1 (1987) 79-98
[39] J. Zhang, G. S. Frankel, Corrosion-Sensing Behavior of an Acrylic-Based Coating System, CORROSION 55 (1999), 957-967
[40] F. Maia, J. Tedim, A.C. Bastos, M.G.S. Ferreira and M.L. Zheludkevich, Active sensing coating for early detection
of corrosion processes, RSC Advances 34 (2014), 17780-17786
[41] G. Howarth, The use of water-based epoxies for anti-corrosive primers, Anti-Corrosion Methods and Materials 43 (1996), 23-28
[42] T.H.Y. Qhach, Etude de la durabilité d’un primaire epoxy anticorrosion: rôle de l’interphase polymère/métal et conséquence sur l’adhérence, PhD Manuscript (2010), Polymères. Université du Sud Toulon Var, fftel-00647580 [43] W. Fürbeth, M. Stratman, The delamination of polymeric coatings from electrogalvanized steel – a mechanistic approach. Part 1: delamination from a defect with intact zinc layer
[44] D. Iqbal, R. Singh Moirangthemy, A. Bashir, A. Erbe, Study of polymer coating delamination kinetics on zinc modified with zinc oxide of different morphologies, Materials and Corrosion 65 (2014), 370-375
[45] S.K. Mallapragada, N.A. Peppas, Dissolution mechanism of semicrystalline poly(vinyl alcohol) in water, Polymer Physics 34 (1996), 1339-1346
[46] A. Nazarov, N. Le Bozek, D. Thierry, Assessment of steel corrosion and deadhesion of epoxy barrier paint by scanning Kelvin probe, Progress in Organic Coatings 114 (2018), 123-134
[47] J.T. Zhang, J.M. Hu, J.Q. Zhang, C.N. Cao, Studies of water transport behavior and impedance models of epoxy-coated metals in NaCl solution by EIS, Progress in Organic Coatings 51 (2004), 141-151
[48] M.G. Olivier, M. Poelman, Use of Electrochemical Impedance Spectroscopy (EIS) for the evaluation of Electrocoatings performances, Recent researches in corrosion evaluation and protection Chapter 1, Intech (2012) [49] X. Gu et al., Linking Accelerated Laboratory Test with Outdoor Performance Results for a Model Epoxy Coating
[50] A.C. Rouw, Model epoxy powder coatings and their adhesion to steel, Progress in Organic Coating 34 (1988), 181-192
[51] D. Nguyen Dang, S. Cohendoz,S. Mallarino, S. Touzain, Effects of curing program on mechanical behavior and
water absorption of DGEBA/TETA epoxy network, Journal of applied polymer science 129 (2013), 2451-2463
[52] J. R. Moraes d’Almeida, G. Wagner de Menezes, S. Neves Monteiro, Ageing of the DGEBA/TETA Epoxy System
with off-Stoichiometric Compositions, Vol. 6, No. 3, (2003)
[53] A.L. Bernassau, D. Hutson, C.E.M. Demore, S. Cochran, Characterization of an Epoxy Filler for Piezocomposites
Compatible with Microfabrication Processes, IEEE Transactions on Ultrasonic, Ferroelectrics, And Frequency Control
58 (2011), 2743-2748
[54] A. Charlesby, Crosslinking and degradation of polymers. Radiation Physics and Chemistry (1977) 18, 59
[55] S. Morsch, S. Lyon, S.R. Gibbon, The degradation mechanism of an epoxy-phenolic can coating, Progress in Organic Coatings, 6th International Conference: Advances in Corrosion Protection by Organic Coatings 102, Part A, 37–43
[56] S. Morsch, S. Lyon, P. Greensmith, S.D. Smith, S.R. Gibbon, Water transport in an epoxy–phenolic coating. Progress in Organic Coatings 78 (2015), 293–299
[57] P. Musto, L. Mascia, G. Ragosta, G. Scarinzi, P. Villano, The transport of water in a tetrafunctional epoxy resin by near-infrared Fourier transform spectroscopy, Polymer 41 (2000), 565–574
[58] J. Hollaender, R. Brandsch, Application of impedance methods for corrosion protecting properties of coated
substrates in metal packaging, International Meeting on Corrosion Science and Control Technologies, IMCORR, Rio
de Janeiro, Brazil (1995).
[59] D.S. Viera, P.R.G. Fernandes, H. Mukai, R.S. Zola, G.G. Lenzi, E.K. Lenzi, Surface roughness influence on CPE parameters in electrolytic cells, International Journal of Electrochemical Science 11 (2016), 7775-7784
[60] D. Gervasio, I. Song, J.H. Payer, Determination of the oxygen reduction products on ASTM A516 steel during
cathodic protection, Journal of Applied Electrochemistry, 28 (1998), 972-989
[61] H. Leidheiser, W. Wang, Some Substrate and Environmental Influences on the Cathodic Delamination of Organic Coatings, Journal of Coatings Technologies 53 (1981), 77
[62] F. Zhou, D. Thierry, Localized electrochemical impedance spectroscopy for studying the degradation of organic
coatings, Electrochimica Acta 42 (1997), 3293-3301
[63] G. Williams, and H.N. McMurray, The mechanism of group (I) chloride initiated filiform corrosion on iron, Electrochemical Communications 5 (2003), 871–877
[64] V. Upadhyay, D. Battocchi, Localized electrochemical characterization of organic coatings: A brief review, Progress in Organic Coatings 99 (2016), 365-377
[65] S.R. Taylor, Incentives for using local electrochemical impedance methods in the investigation of organic coatings, Progress in Organic Coatings 43 (2001), 141-148
[66] K. Darowicki, M.Szociński, A. Zieliński, Assessment of organic coating degradation via local impedance imaging, Electrochimica Acta 55 (2010), 3741-3748
Figure captions
Fig. 1. Schematic representation of (a) chemical bonding in cured DGEBA-TETA epoxy resin (adapted from Bernassau et al. [53]) and (b) epoxy degradation induced by interfacial pH increase.
Fig. 2. Schematic description of the AC-DC-AC procedure cycle used in the study.
Fig. 3. ATR-IR spectra (a, b) and evolution of peaks intensities with time (c, d) of the epoxy polymer over Zn HDG in the low wavelength region. (a) after 100 h of immersion and (b) after 7 AC-DC-AC cycles compared with the initial spectra of as coated epoxy polymer as indicated; (c) average evolution of the OH peaks intensities corresponding to “free -OH” and “total -OH” as a function of immersion time (see text for definition) and (d) average evolution of epoxy characteristic peaks (Table 1) intensities as a function of immersion time. Dashed line in (c) corresponds to the exponential fitting with Eq. 3 of the peaks intensities (A) vs immersion time (t).
Fig. 4. Evolution of average contact angle values on the model epoxy surface (a) in humid atmosphere (over 95%) and immersion in 10 mM NaCl water as indicated, (b) in modified AC-DC-AC ageing test. Fig. 5. Examples of optical images of the epoxy coating on Zn after (a) 50 h; (b) 60; (d) 70 and (e) 75 h of immersion in a 10 mM NaCl electrolyte by in situ Time Lapse Microscopy. Images (c) and (d) represent 3D image composition in initial state (10 h of immersion) and after 75 h of immersion consequently. Strong deformation after immersion can be seen (see text for details).
Fig. 6. Typical EIS spectra (a) and evolution of average low frequency electrochemical impedance modulus (b, c) of model epoxy coated Zn at different immersion times (example after 1 and 72 h of immersion time) in a 10 mM NaCl aqueous solution. (a, b) during immersion and (c) under modified AC-DC-AC degradation procedure
Fig. 7. Typical EIS response of Zn alloy with two types of conversion coatings (Type 1 and Type 2 substrates in Tab. 1) in a 10 mM NaCl solution over modified AC-DC-AC aging procedure for (a) uncoated substrates and (b, c) substrates with model epoxy coating. Figure (c) presents average evolution of the low frequency electrochemical impedance modulus for the samples shown in (b). Fig. 8. In situ Time Lapse Microscopy observation during OCP measurement after 3 and 5 AC-DC-AC test cycles for epoxy coated Zn alloy samples of type 1B and type 2B as indicated.
Fig. 9. in situ TLM (a, c) and LEIM maps (b, d) of the Zn alloy sample of type 1B (Type 1 substrate covered with model epoxy) after 4 AC-DC cycles (a, b) and type 1A (Type 1 substrate coated with strong epoxy primer) after 10 AC-DC cycle (c, d). The areas mapped by LEIM are delimited in TLM images by squares.
Fig. 10. Schematic description of the metal/polymer interface degradation in the proposed accelerated test. During immersion, water and aggressive species diffuse through the polymer and reach the metal/polymer interface (a). In function of weak (b) or strong (c) stability of the metal/oxide/polymer interface, the underpaint reactivity under polarization leads to different intensity of cathodic reaction and to different EIS response (Type 1 or Type 2) respectively. Finally, hydroxides generated at the interface diffuse through the coating and degrade the polymer (d).