Publisher’s version / Version de l'éditeur:
Vous avez des questions? Nous pouvons vous aider. Pour communiquer directement avec un auteur, consultez la première page de la revue dans laquelle son article a été publié afin de trouver ses coordonnées. Si vous n’arrivez pas à les repérer, communiquez avec nous à PublicationsArchive-ArchivesPublications@nrc-cnrc.gc.ca.
Questions? Contact the NRC Publications Archive team at
PublicationsArchive-ArchivesPublications@nrc-cnrc.gc.ca. If you wish to email the authors directly, please see the first page of the publication for their contact information.
https://publications-cnrc.canada.ca/fra/droits
L’accès à ce site Web et l’utilisation de son contenu sont assujettis aux conditions présentées dans le site
LISEZ CES CONDITIONS ATTENTIVEMENT AVANT D’UTILISER CE SITE WEB.
Proceedings of the 9th International Conference on Offshore Mechanics and
Arctic Engineering, 4, pp. 83-87, 1990
READ THESE TERMS AND CONDITIONS CAREFULLY BEFORE USING THIS WEBSITE. https://nrc-publications.canada.ca/eng/copyright
NRC Publications Archive Record / Notice des Archives des publications du CNRC :
https://nrc-publications.canada.ca/eng/view/object/?id=0f44561b-b1ad-47a5-8d99-8f16c0ef1f35
https://publications-cnrc.canada.ca/fra/voir/objet/?id=0f44561b-b1ad-47a5-8d99-8f16c0ef1f35
NRC Publications Archive
Archives des publications du CNRC
This publication could be one of several versions: author’s original, accepted manuscript or the publisher’s version. / La version de cette publication peut être l’une des suivantes : la version prépublication de l’auteur, la version acceptée du manuscrit ou la version de l’éditeur.
Access and use of this website and the material on it are subject to the Terms and Conditions set forth at
Analysis of stress distributions in an ice floe
Ser
TH
1
N21d
10.
1680
National
Research
Conseil national
c.2
1+1
Council Canada
de
mhwehe.
C a w
BLDG.
Institute for
lnstitut de
-- --
Research in
recherche en
Construction
construction
Analysis of Stress Distributions
in an
Ice
Floe
by R.M.W. Frederking and E.
Evgin
Reprinted from
Proceedings of the Ninth International Conference
of Offshore Mechanics and Arctic Engineering
1990
OMAE
Volume 1V, p. 83-87
(IRC Paper No. 1680)
NRCC 32350
NRC-
CISnI R
C
'*%;
L I B R A R Y
;r,, '5 %,*
>.JAN
I 5
1991
'
B I B L I O T H ~ Q U E
I R C
CNRe-
I C l 8 T 1Les
rkpartitions des contraintes dans un
floe
de glace id4dM sous forme de
disque circulaire sont calcul6es pour diverses conditions limites de
chargemen t. Pour effectuer cette analyse, l'au teur utilise un programme
polyvalent aux dements finis, 1'ADINA.
Il
examine &dement l'effet de la
variation de l'epaisseur de la glace sur la rkpartition des contraintes. Les
rksultats numbriques obtenus dans cette ktude, complktks par des donnks
recueillies sur le terrain, ont servi d e base pour la formulation de
recommandations concernant les endroits
oh
placer les capteurs de
contraintes, et pour l'interpretation des mesures des contraintes en rapport
avec les forces d'entrainement de la glace de derive.
The American Society
Mechanical Engineers
Reprinted From Proceedings of The Ninth International Conference of Offshore Mechanics and Arctic Engineering Editors: 0. A. Ayorinde, N. K. Sinha, and D. S. Sodhi Book No. 10296F
-
1990ANALYSIS OF STRESS DISTRIBUTIONS I N AN ICE FLOE
R. M. W. Frederking
National Research Council of Canada Ottawa, Ontario, Canada
E. Evgin
Department of Civil Engineering University of Ottawa Ottawa, Ontario, Canada
ABSTRACT
Stress distributions in an ice fbe ldealiied as a circular disk are calculated for various boundary loading conditions. A general purpose finite element program, ADINA, Is used in the analysis. The effect of Ice thickness variations on the stress distrlbutions Is also examined. The numerical results obtained in this study, complemented with some field data, Provided a basis for makim recoinmendations on the locations- of stress sensors, and the interpretation of the stress measurements In relatlon to Pack Ice driving forces.
1.0 INTRODUCTION
The intensity of
pack
ice driving forces Is one of the important factors influencing the magnitude of the forces acting on arctic offshore platforms (Croasdale, 1984). Considerable uncertainty still exists in quantifying these forces. A substantial reduction in the cost of offshore structures could be achieved If the range of uncertainty was reduced.In 1984 Croasdde proposed
an
approach for determlnlng pack leedrMng lorn$. It Involved measuring stresses in the centre of an Ice floe drifflq In the poiar pack. The stresses In the floe would integrate all the forces acting on the boundary of the floe as a resuft
of ridge building or interaction wfth adjacent fbes and those internal
to the floe such as wind and current drag. Thus the siresses measured in the floe are an Indication of pack
lca
driving forces. In1988 a pibt project to measure pack iee driving forces was carrled out (Cmasdale et a!, 1986). Two key issues were identitled In the
project
One
was hardware; i.e. sensors capable of accuratelymeasuring in situ m s s e s in ice. The other was a calculation
I
method to relate measured stresses in a floe to boundary forces.This paper addresses the development of a calculation method. Stress distributions will be evaluated in an idealized ice fbe for various boundary loading conditions. The stress distributions provide a basis for making recommendations on the optimum locations of stress sensors in order to predict the pack ice driving forces.
I
2.0 FINITE ELEMENT ANALYSISThe finite element method of analysis was used to calculate the stress distrlbutions in an Ice fbe for a specified set of boundary forces. The analysis was carried out using ADINA, which Is a reliable
and efficient general purpose finite element program for static and dynamic analysls. The capabilities of the program are described by Bathe (1982). It has been used successfuliy in the analysis of many practical engineering problems In structural and geotechnical engineering fields (Evgin and Morgenstern, 1985).
3.0 ANALYSIS OF STRESS DiSTRlBUTlONS
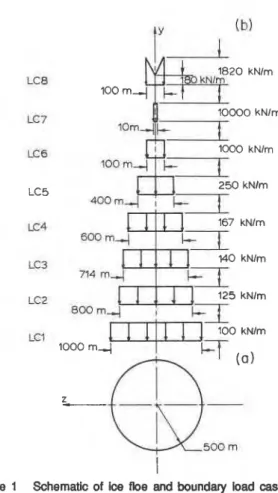
The stress distributions in a circular fbe were calculated for specified loads applied at the boundaries. The idealized floe Is shown in Fig. l(a). It has the following properties:
Diameter = 1000 m Thickness = 3 m Elastic Modulus = 6 GPa Poisson's Ratio = 0.3
A plane stress finite element analysis was carried out for each of the boundary forces shown in Fig. l(b). The ice floe lay in the y-z plane. Load was applied in the y- direction. Compressive stresses are assumed positive in this paper. In all eight different cases of loading, the total load on the perimeter of the fbe was constant (100 MN). The width of the loaded area, however, was different in each case, and the magnitude of the distributed load on the boundary varied accordingly to keep the total load constant. Due to the symmetry, only one quarter of the circular ice floe was analyzed. The mesh shown in Fig. 2 was used In the finite element discretization. The stresses obtained from the finite element analysis were presented for the sections along the z- and y-axes in the circular floe. Normal stresses,
q
and 4, calculated in the finite element analysis for points next to the axes (Sections 1-1 and 11-II)are also the principal stresses. Condensed results of the calculations appear In Figures 3 to 6.
Figure 3 plots the distribution along the z-axis (Section I-I) of stress in the load application direction,
q.
Itcan
be seen that stress a at the centre (z=O) becomes progressively larger as the loading wbth becomes narrower (moving progressively from LC1 to LC7). Also stressg
is everywhere compressive abng Section I-I. At a distance of 250 to 300 m from the center (z = 250 to 300 m), stress a,is
relatively insensitive to the width of loading.
Figure 4 presents distributions of stress o, along the y-axis (Section
11-11). Along this axis a is also everywhere compressive. For loading widths down to &out 600 m (LC1 to LC4) a, distribution along the y-axis is quite uniform. Also near the centre (y c 100 m) stress a, is relatively uniform for all bading cases.
1820 kNlm 2 5 0 kNlm ~ ~ ~ r n ~ + ~ ~ LC4 167 kNlm 600 in+ LC3 140 kNlm 714 m 4
Figure 1 Schematic of ice floe and boundary load cases used In finite element analysis, (a) plan view, (b) boundary load cases
z coordinate. rn
Figure 3 Distribution of stress
q
along the z-axis (Section I-I)Figure 4 Distribution of stress a, along the y-axis (Section 11-I[)
Stresses In the dlrectlon transverse to the loadlng dlmctbn, q.
are
presented in Flgures 5 and 6. Distrtbudons of sbess oa along the
x-axis (Section 1-1) are seen to be everywhere tensile (Flg. 5). For loading wtdths down to about 100 rn, stress q has a slgnlflcant dependence on loadlng width, prwlded
z
c 100 m. Oncez
> 250 rn, a= Is relatively Insensltlve to badlng width. The dlsbibution of mess ts* along the y-axis (Section D-a) Is more complex (see Figure 6). Stress qIs
tenslle In the central region y < 250 m) but becomes compressive near the perimeter (y approaches 500 m). As along the z-axis, stress 4 Is strongly dependent on loadlng width near the orlgin (y c 100 m).The determination of pack ice driving forces from stress measurements requires interpretation of the finlte element results. If the boundary forces are applied uniformly in a known diredon, the width of the loaded area and the lntenslty of the load become the Wo unknowns in this problem.
The following observations can be made from the the results of the finite element analysis to help determine these two unknowns: 1
-
If av is constant everywhere in the floe and q is zero, then theboundary pressure Is equal to a, and Is uniformly applied across Figure 2 Mesh of floe used for finite element calculations the full perimeter of the floe.
z coordinate, rn
Figure 5 Distribution of stress az along the z-axis (Section I-I)
Figure 6 Distribution of stress q along the y-axis (Section II-n)
2
-
The rate of reduction in a, along the z-axis becomes higher when boundary forces are applied along narrower wldths of the boundary.3
-
When the boundary force is applied across less than or equal to a 100 m length of the perimeter, the distribution ofq
along the z-axis is almost the same for different types of load distributionsas
longas
the total load remains the same. In this case, the magnitude of a, at z=0 becomes proportional to thetotal boundary force.
4
-
Normal stressq
c h a p s rapidly along Sectlon 11-IIbetween
y-200 m and 500 rn when the ml boundaryform
Ls appted across a small sectlon of the perimeter (badlng cases LC5 toLC8). However, when the total force is dlsvibuted on a large
ponlon of the boundary (loading cases LC1 to LC4), the
magnltzrde of
q,
along Seezlonn-Ir
remalns almost aonsmt. 5-
In all cases,o;
along SectionII-II
Is tensile near the centre andI compressive at the perimeter. However, the sign of a, at different distances from the centre depending on the width of changes
the boundary force.
6
-
The normal stress q abng Section 11-II is tensile for all cases of loadlng.4.0 NATURE OF STRESS STATE AT CENTRE OF FLOE
When
forces act on the perlrneter of a M e It Is not k min which dIrectIon they wlll be orlented. Also, as the previous analysts shows, stresses near me boundary are very strongly dependent upon localloading eondltions. Therefore In the slmplest situation
stresses
inthe centre of Lhe floe give the best representation of the boundary forces. In Figure 7 the stress state at the centre of the floe Is plottd for various loading widths. Note that the total force on the
floe Is constant (100 MN) for all cases. It can be seen that the ratio of the stresses varles, depending on the width of loadlng (see Figure 7(c)). Shls variation is dtscernible, provided that the loading width
Is
greater than about 300 m. For narrower loading widths a,, ay and the ratloodor
are quite independent of tho loading wldth, and loading widths could only be determined by stress measurements nearer to the periphery of the floe. Nevertheless, knowing the ratioof the principd stresses at the center of the floe and their
magnitude, the kundary load and Its wkdth
can
be determtnd. The preceding of course assumes that the applied boundary bad Is one dimensional. An application of the methodology wlll be illustrated in a following section where the results of one event in theCmasdale et at (1986) field measurements Is analysed further.
iwdlng width, m
Figure 7 Dependence of q,
q
and ratioale,
at the center of the circular floe on boundary ioading width5.0 EFFECT OF VARIATIONS IN ICE THICKNESS
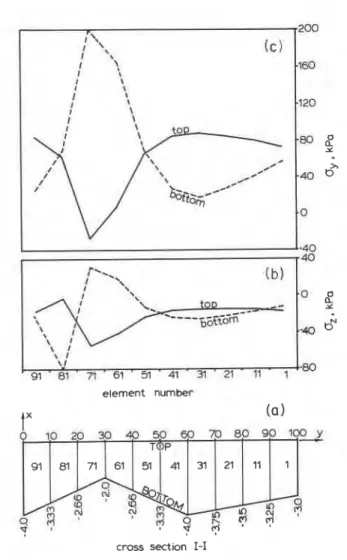
The effect of ice thickness variations on the stress distributions was studied for the same clrcular floe considered in Section 3.0. In order
to reduce the computing cost, only the central portion of the ice floe (shown in Fig. 8) was assumed to have variations In thickness (Flg. 9(a)). The load was applied at the boundaries of thls central region. Its distribution and magnitude were taken from the finite element analysis used for the loading case LC7.
The normal
stresses
calculated for elements shown In Fig. 9(a) aregiven in Flgure 9(b) and (c). These results show the the wesses
at the same locatlon varied dramatlcaliy as a funedon of depth In the
Ice cwer. Stresses at the mld level In a non-uniform Ice cover, however, correspond to those in an
Ice
cover of unlform thicknessprovlded amunt
Is
taken of local Ice thlcknesses. Therefore knowledge of the local thlcknesses of the ice floe wlll be an important factor in positioning the ice stress sensors and interpreting the results.Figure 8 Schematic of central section of the floe used for analysis of effect of thickness variations on stresses
6.0 RE-ANALYSIS OF PILOT PROJECT TEST RESULTS The arlglnal data obtalned by Croasdab et
al
(1986) were re-analysed. Thls analysls took the form of separating out ona of the loading events and eramlnlng h In greater detall. The went selected is the
same
one used by Croagdale st ai (1987). Thestr~sses measured by a roserte of three senson for a 2 hour
In the afternoon of Aprll 22, 1086 were used to cskulste
s$
stresses (see Fig. 10). The recording frequency for these measurements is once per minute.
Ourlng the peak Soadng event (hour 23.5) the major IxfWpal slress
increased by a h u t 20 kPa while the mlmr inclpai stress decreased by b u t 6 kPa. The actual Roe, which L d an Irregular shape about 6 km long and 3 km wide, was assumed to be
represented by the YOOOm diameter by 3 m thick Meallzation used
In the Ilnlte element analysls. It Is recognhW that Mis is a gross slmpllf?cateon, but It
Is
only done here to demonstrate a methdologyfor uslng measured slresses to prodlet boundary stresses and thus
pa&
Ice drlving forces. The ratlo between the two prlnclpal stresschanges ( A a , / A q = -6 kPamJ kPa
-
-
0.3) suggests a loading width of about 350 rn (see Figure 7(c)). Gohg down to Figure 7(b) and(c), the corresponding vafues of a and G, are 58 kPa and -19 kPa,
respectivsly. The boundary load for the 350 rn loading width (100 MNP350 rn = 285 kNlm)
has
to be -ed down by the raoo20 kPa158 kPa to obtain the actual boundary load for this
case (285 W m
.
20 k P a 8 kPa = 100 kN/m). Therefore. the boundary load is 100 kN/m over a width of 350 m.The floe geometry is very much idealized in this example, but it still serves to provide an indication of the approximate value of pa& ice driving forces. The above value falls at the upper range 25 to
100 W m suggested by Croasdale et al 1987.
element number
tx
(a
cross section 1-1
Figure 9 Stress distributions through the floe for non-uniform Roe
thicknesses
23.0 24.0 25.0
ELAPSED TIME, h
Figure 10 Major and minor principal stresses for loading event on April 22, 1986 (Elapsed time from April 21, 1550)
7.0 CONCLUSIONS
Based on the results of the finite element analysis presented in this paper, the following conclusbns were obtained:
1
-
S f m measurementstaken
with e rosette In the central regbn of a circularIce
Roe
are sufRclenl to make a flrst approxlmatbn of the dlstributlon and the magnitude of rldge bulldlng forms onthe perimeter of the floe and hence pack
tce
drivlng forms. More stresssensors
should be placed at strategic iocatlons In the floe to obtain a better measure of the state of load acting at the boundary of the floe.2
-
Variations in the ice thickness have a large influence on the measured stresses. It will be necessary to put more than one level of stress sensor at certain locations where bending moments and the reduced cross section affectsare
expected.8.0 ACKNOWLEDGEMENTS
Funding for this study was provided by SubTask 6.2
-
Marine Engineering of the Panel of Energy Research and Development (PERD).9.0 REFERENCES
Bathe, K.J., 1982. Finlte Element Procedures in Eglneerlng Analysis. Prentlce-Hall, Englewood Cllffs, N.J.
Croasdale, K.R. 1984. The Limit Driving Force Approach to Ice Loads, Offshore Technology Conference, OTC Paper 471 6, Houston, May 7-9, 1984, pp. 57-64.
Croasdale, K.R., Comfort, G. and Graham, B. 1986. A Pilot Project to Measure Pack Ice Driving Forces. Contract Report submitted jointly by K.R. CmasdaJe and Associates and Arctec Canada Ltd. to the Institute of
Ocean
Sdences, Department of Fisheries and OceansCmasdale, K.R., Comfort, G., Frederking, R., Graham, B.W. and Lewis, E.L. 1987. A Pilot Experiment to Measure Pack Ice Driving Forces, POAC '87 Fairbanks, Alaska, 17-21 August 1987, Vol. 3,
pp. 381-395
Evgin, E. and Morgenstem, N.R., 1985. Three-Dlmensbnal Analysis of an Artificial Island. Proc. ASCE Conf. Arctic '85, San Francisco. March 25-27, 1985, pp. 61 7-625.