How reliable are methods to assess xylem vulnerability
to cavitation? The issue of ‘open vessel’ artifact in oaks
N.K. Martin-StPaul
1,2,9†, D. Longepierre
1†, R. Huc
3, S. Delzon
4,5, R. Burlett
4,5, R. Joffre
1, S. Rambal
1,6and H. Cochard
7,81CEFE UMR 5175, CNRS - Université de Montpellier - Université Paul-Valéry Montpellier - EPHE - IRD, 1919 route de Mende 34293 Montpellier Cedex 5, France; 2Laboratoire Ecologie Systématique et Evolution CNRS, Orsay F-91405, France; 3INRA UR629, Ecologie des Forêts Méditerranéennes (URFM), Domaine Saint Paul Site Agroparc, 84194 Avignon Cedex 9, France; 4INRA, UMR 1202 BIOGECO, F-33610 Cestas, France; 5Université de Bordeaux, UMR 1202 BIOGECO, F-33610 Cestas, France; 6Universidade Federal de Lavras, Departamento de Biologia, CP 3037, CEP 37200-000, Lavras, MG, Brazil; 7INRA, UMR 547 PIAF, F-63100 Clermont-Ferrand, France; 8Université Blaise Pascal, UMR 547 PIAF, F-63177 Aubière, France; 9Corresponding author (nico09.martin@gmail.com, nicolas.martin@u-psud.fr)
Received August 27, 2013; accepted June 5, 2014; published online July 28, 2014; handling Editor Annikki Mäkelä
Three methods are in widespread use to build vulnerability curves (VCs) to cavitation. The bench drying (BD) method is considered as a reference because embolism and xylem pressure are measured on large branches dehydrating in the air, in conditions similar to what happens in nature. Two other methods of embolism induction have been increasingly used. While the Cavitron (CA) uses centrifugal force to induce embolism, in the air injection (AI) method embolism is induced by forcing pressurized air to enter a stem segment. Recent studies have suggested that the AI and CA methods are inappropriate in long-vesselled species because they produce a very high-threshold xylem pressure for embolism (e.g., P50) compared with what is expected from (i) their
ecophysiol-ogy in the field (native embolism, water potential and stomatal response to xylem pressure) and (ii) the P50 obtained with the BD
method. However, other authors have argued that the CA and AI methods may be valid because they produce VCs similar to the BD method. In order to clarify this issue, we assessed VCs with the three above-mentioned methods on the long-vesselled Quercus ilex L. We showed that the BD VC yielded threshold xylem pressure for embolism consistent with in situ measurements of native embolism, minimal water potential and stomatal conductance. We therefore concluded that the BD method provides a reliable estimate of the VC for this species. The CA method produced a very high P50 (i.e., less negative) compared with the BD method,
which is consistent with an artifact related to the vessel length. The VCs obtained with the AI method were highly variable, produc-ing P50 ranging from −2 to −8.2 MPa. This wide variability was more related to differences in base diameter among samples than
to differences in the length of samples. We concluded that this method is probably subject to an artifact linked to the distribution of vessel lengths within the sample. Overall, our results indicate that the CA and the AI should be used with extreme caution on long-vesselled species. Our results also highlight that several criteria may be helpful to assess the validity of a VC.
Keywords: drought, Mediterranean tree, methodology, plant hydraulics, plant water transport, vessel length artifact, water relations.
Introduction
A ‘vulnerability curve’ (VC) describes how much the hydrau-lic conductivity of a given stem segment decreases when
exposed to a gradual decrease in xylem pressure. A VC there-fore offers a quantitative assessment of the ability of the con-duits of a given plant to sustain the tensions experienced in
Research paper
†These authors contributed equally.
the face of water deficit. The xylem pressure causing 50% loss of conductivity (P50) is of ecological significance and is
widely used to characterize the drought tolerance of plant spe-cies. It varies widely among species (from −1.5 to −14 MPa;
Choat et al. 2012) and has been shown to correlate with the drought-response strategies of plants (McDowell et al. 2008,
Pittermann et al. 2012) and with the water potential thresh-olds at which plants fail to recover from drought (Brodribb and Cochard 2009, Urli et al. 2013). Given the importance of VCs for understanding species adaptation to drought, it appears crucial to quantify them properly, particularly in the context of ongoing climate change and increasing drought mortality risk (Choat et al. 2012, 2013, Cochard and Delzon 2013).
The techniques for measuring VCs are numerous and differ in the way cavitation is induced or hydraulic conductivity is measured (Cochard et al. 2013). Currently, the most wide-spread methods include the bench drying (BD) method, the air injection (AI) method and the centrifuge-based methods, among which the Cavitron (CA) is the most mature (Cochard et al. 2013). Bench drying exposes a large excised branch to dehydration in free air; xylem pressure and hydraulic conduc-tivity are then measured regularly on short subsamples. The hydraulic conductivity of the sample is measured using either a flow meter or a balance, as in the method first proposed by
Sperry et al. (1988). The relative change in hydraulic conduc-tivity compared with the fully conductive sample (percentage loss of conductivity, PLC) is then computed to assess the rate of cavitation or embolism. Despite being material and time consuming, if BD is done correctly it can be regarded as a reference, because dehydration occurs by leaf evaporation in a similar fashion to what plants experience in the field dur-ing a drought episode (Cochard et al. 2013). For AI, different levels of embolism are induced by forcing air to enter into the plant conduits through a pressure collar (sleeves) tied to a stem sample. After each step of AI, the PLC is determined as in BD. The spinning methods use centrifugal force to induce cavitation (Alder et al. 1997). The PLC can be determined after each step of spinning. The peculiarity of the CA is that the conductivity is measured while the sample is spinning (under negative pressure as in planta), which considerably accelerates the measurement procedure (Cochard et al. 2005, 2013).
Ideally, all these techniques are expected to yield similar VCs provided that they are carried out using similar plant material. Previous studies have shown that if done properly, the differ-ences in mean P50 between methods are <5% (Cochard et al.
2005). However, Cochard et al. (2005, 2010) showed that when samples having a large proportion of vessels cut open (which happens frequently in long-vesselled species, such as ring-porous trees) were measured with the CA, it produced VCs very different from those obtained with the BD technique.
Cochard et al. (2005, 2010) concluded that the CA technique
was subjected to a vessel-length artifact (or ‘open vessel’ arti-fact), while the same conclusion was reached by Choat et al. (2010) and Ennajeh et al. (2011) for the AI method.
The ‘open vessel’ artifact relies on two types of arguments. Firstly, VCs subjected to the ‘open vessel’ artifact describe an onset of cavitation at very high xylem pressure compared with the range of xylem pressure experienced by these plants (Cochard and Delzon 2013, Cochard et al. 2013). Such high vulnerability to cavitation would mean that cavitation occurs routinely in these plants, as soon as xylem pressure falls below zero. This contradicts the premise that plants usually operate at a water potential above the threshold pressure for cavita-tion and control the extension of embolism through stomatal regulation (Jones and Sutherland 1991, Cruiziat et al. 2002). Secondly, as a consequence of the steep increase of embolism in response to decreasing water potential, these VCs exhibit an ‘exponential’ shape, which contrasts markedly with the ‘sig-moidal’ VCs generally obtained when the reference BD method is used (Cochard et al. 2005, 2010, 2013, Choat et al. 2010,
Ennajeh et al. 2011, but see Cai et al. 2014). ‘Sigmoidal’ VCs, in contrast, define a range of xylem pressure within which the fluctuation of water potential does not cause much embolism and where stomatal closure can act to maintain the integrity of the hydraulic system (Cochard and Delzon 2013, Cochard et al. 2013).
However, recent studies have argued that ‘exponential’ VCs with high P50 could be correct because they can be obtained
by presumably independent techniques (BD, spinning and AI techniques; Jacobsen and Pratt 2012, Sperry et al. 2012,
Tobin et al. 2013). The conclusions of these studies involved the following implicit assumptions: (i) that cavitation is routine in some plants; and (ii) that high stomatal conductance and therefore high transpiration can be maintained even with a large proportion of the xylem embolized. Such a risky function-ing of plant species with xylem conduits of apparently high vulnerability has been interpreted and discussed in the light of active xylem refilling under tension (Sperry et al. 2012, Tobin et al. 2013); however, this process lacks robust empirical evi-dence (Sperry 2013, Wheeler et al. 2013) and the underly-ing mechanisms remain speculative (Holbrook and Zwieniecki 1999). Overall, it appears that the fierce controversy concern-ing the VC methods is not only a simple methodological issue but also concerns our general representation of water trans-port in trees and must therefore be clarified urgently (Cochard and Delzon 2013, Cochard et al. 2013).
In this study, we aimed to clarify this methodological issue. We built a set of VCs using the three main methods described above (AI, CA and BD) in the long-vesselled Mediterranean oak, Quercus ilex L. We compared these VCs and attempted to assess their relevance according to their shape, their P50 and other
eco-physiological variables (leaf water potential and stomatal con-ductance) collected from a literature survey.
As explained above, most of the debate has focused on the obvious dichotomy between ‘sigmoidal’ and ‘exponential’ VCs (Cochard and Delzon 2013). In some cases, however, VCs do not fall strictly into one or the other of these categories (Cochard et al. 2013), and it can be hard to decipher whether a VC is subjected to an artifact or not (Cai et al. 2014). For instance, Q. ilex exhibits VCs highly variable in shape, hence in P50 (see Table S1 available as Supplementary Data at Tree Physiology Online), with several VCs appearing more or less linear (e.g., Martínez-Vilalta et al. 2002, Gartner et al. 2003,
Limousin et al. 2010a, Martin-Stpaul et al. 2013). A second-ary objective of the present study is to synthesize our results within a framework providing a set of clues that might help in assessing the validity of a VC, particularly when a reference VC is missing.
Materials and methods
Plant materials and sampling
This study focuses on the long-vesselled Mediterranean ever-green oak, Q. ilex. This species has previously been suspected to be subjected to an ‘open vessel’ artifact (Martínez-Vilalta et al. 2002, Cochard et al. 2005), making it a good candidate to test VC methods. Using stem samples with large rates of native embolism either due to freeze–thaw cycles or to past drought event can preclude the estimation of a correct VC (Wheeler et al. 2013). Consequently, we conducted our mea-surements on current-year resprouts. Quercus ilex resprouts can easily reach between 1 and 2 m in length within the growth period; therefore, they offer the opportunity to study very large samples that have not experienced freeze–thaw cavitation due to winter frost. Additionally, thanks to their low leaf area and their deep root system, they experience lower water limitation during the summer period compared with mature trees (Castell et al. 1994), which limits the formation of drought-induced embolism.
The plant material originated from Q. ilex acorns collected at the Puéchabon forest (43.73°N, 3.58°E) that were planted in the experimental plot of the CNRS campus of the CEFE (43.64°N, 3.86°E) at Montpellier in 1963. Since then, trees have reached 10–15 cm in diameter at breast height and 7–9 m in height. The site has a typical Mediterranean climate with cool, wet winters and hot, dry summers. Mean annual precipitation is 770 mm, and mean temperature is 13.5 °C. In autumn 2009, 10 of these trees were cut, producing hundreds of resprouts that grew in the shade of the surrounding mature trees the following year. Resprouts grew from mid-March to mid-October 2010. During the summer period, resprouts were irrigated twice a week to avoid the formation of drought-induced embolism that could have affected the measurements. During October and before any frost event, resprouts over 1.2 m long were collected. They were systematically cut at their bases,
under water and during the morning (at low vapour pressure deficit), thus limiting artificial embolism formation that could arise from the cutting procedure (Melcher et al. 2012, Sperry 2013). After cutting, the samples were immediately immersed into water by their base and then transported to the laboratory.
For technical reasons, the length of the individual sample differed between methods. Given that the BD method per-mits the study of very long samples, we used long samples of resprouts (>1.2 m). These samples were dehydrated, and PLC measurements were performed on short subsamples collected at the apical parts of the sample. In the case of the CA method, the length of the samples was limited by the size of the rotors we possessed. We used subsamples that came from large resprouts recut at two different lengths in accordance with the length of our rotors (0.28 and 0.42 m). In the case of the AI method, the length of the samples was limited by the ability of our flow meter to measure a flow. As a result of their higher resistance, inaccurate measurements of maximal conductivity were obtained when samples were longer than ~30 cm. We therefore used samples of 0.15 and 0.25 m to avoid any prob-lem with measurements.
Measurements of maximal vessel length
Before performing the VCs, we estimated the maximal vessel length using the air infiltration technique (Ewers and Fisher 1989) on six resprouts. Samples ranging between 1.1 and 1.4 m were cut in the air at ~0.15 m from their distal ends and infiltrated with compressed air (0.15 MPa), with their basal end immersed in water. The stem was successively shortened by 0.02 m at its base until bubbling was observed. Given that com-pressed air cannot pass through vessel end walls, this bubbling indicated that a vessel was cut open at both ends. The maximal vessel length was defined as the remaining shoot length. Bench drying VCs
Bench drying curves were obtained following the method described by Sperry et al. (1988). Twelve resprouts (>1.2 m long, at least 0.2 m longer than the maximal vessel length) were dehydrated on a laboratory bench and their xylem pressures were monitored with a Scholander pressure chamber. Samples were covered between measurements in order to avoid exces-sive water loss from the surface and non-homogeneous distri-bution of embolism in the sample. Once a resprout had reached a target pressure, it was sampled to assess its loss of hydraulic conductance (expressed as a percentage, PLC). The PLC was assessed on at least five subsamples of 2 cm in length excised under water at the terminal part of the shoots. The hydraulic measurements were performed using a commercial XYL’EM apparatus (Bronkhorst, Montigny-les-Cormeilles, France). Immediately after the subsamples were cut, their proximal ends were connected to the tubing system of the XYL’EM, which was filled with degassed and filtered water. The flow was measured
with a high-resolution liquid mass flow meter similar to the one used by Cochard et al. (2000). The hydraulic conductivity of the subsamples (Kh, in kg m s–1 MPa–1) was calculated as the
ratio between the flow through the segment and the pressure gradient (6 kPa). After having measured the initial conductivity (Khini), the samples were flushed once at 0.15 MPa for 30 s, and
their maximal conductivity (Khmax) was measured as above. The
values of Khini and Khmax were used to compute the PLC. Air injection VCs
For the AI method, 14 samples were first recut in order to obtain two different lengths (15 and 25 cm). Embolism was induced by injecting air into a sleeve at different pressure lev-els following the method developed by Cochard et al. (1992). Prior to the measurement, stem segments were recut at both ends, and the bark was removed under water. This latter pro-cedure left petiole scars open so that the air had a seeding point. The samples were then inserted into a sleeve, with the two ends protruding out of the sleeves. Samples were flushed (at 0.15 MPa) for 30 s to obtain the maximal hydraulic con-ductivity (Khmax). A 4 cm sleeve was connected to a pressure
chamber, thus allowing the injection of compressed air at the selected pressure. Air was injected for 2 min at each of the fol-lowing pressures: 1.0, 2.0, 3.0, 4.0, 5.0, 6.0, 7.0 and 8.0 MPa. Hydraulic conductivity was measured with the same methodol-ogy as for the BD method. We waited for at least 30 min after each pressurization (when no more bubbles came out of the sample) to allow the system to equilibrate.
Cavitron VCs
A total of 13 VCs were performed using the CA technique with two different rotor sizes (0.28 and 0.42 m). The tech-nique consists of spinning xylem segments centred on a dedicated rotor to expose them to large negative pressures and then measuring the effect on the hydraulic conductivity. Measurements were performed at the high-throughput phe-notyping platform for hydraulic traits (Cavit Place, University of Bordeaux, Talence, France) using custom-built honeycomb rotors (SamPrecis 2000, Bordeaux, France) mounted on a Sorvall RC5 superspeed centrifuge (Thermo Fisher Scientific, Munich, Germany). Sample ends were inserted into a trans-parent reservoir containing ultrapure water with 10 mM KCl and 1 mM CaCl2 filtered to 0.2 mM. The water level in each
reservoir differs, thus creating a hydrostatic gradient; as a result, water flows through the sample, which allows Kh to
be measured (see Cochard et al. 2005, for further details of this technique). Xylem pressure was first set to a reference pressure (−0.1 MPa), and hydraulic conductivity (Khmax) was
measured. The centrifugation speed was then set to a higher value for 3 min to expose the sample to a more negative pres-sure. Conductance was measured four times for each pressure step, and the average was used to compute the PLC at that
pressure. The PLC was determined at each pressure step. The procedure was repeated for at least eight pressure steps until the loss of conductivity reached at least 80%. Rotor velocity was monitored with a 10 r.p.m. resolution electronic tachym-eter (A2108-LSR232; Compact Instruments, Bolton, UK). We used the Cavisoft software (version 2.0; BIOGECO, University of Bordeaux, Talence, France) for conductance measurements and computation of VCs.
Embolism distribution test
We assessed how embolism was distributed along the stem after decreasing the xylem pressure of the sample at approxi-mately −4 MPa, by using both the AI and CA methods. We used two samples of 0.28 m for the AI method and three samples of 0.28 m for the CA method. An additional sample of 0.5 m length was also tested for the AI method. In the case of the AI method, the pressure sleeve was positioned at the middle part of the sample. For each method, embolism was induced as explained above. The PLC was assessed at three positions along the segment; one was located at the middle part (i.e., the point of maximal pressure or tension), and the two others were located at either end of the segment. For each of the three positions, we cut one sample of 4 cm length that was recut into two subsamples. The PLC was assessed for each subsample using XYL’EM apparatus. For each of the three positions (both ends and the middle), PLC was aver-aged and plotted according to the position from the point where dehydration was the highest (i.e., locations of the pres-sure sleeves and rotational axis for the AI and CA methods, respectively).
Additional data
Predawn and midday xylem water potentials were measured twice during the drought period (12 and 28 August) on cur-rent-year resprouts. Shoots were covered with aluminium foil at least 2 h before measurements. In order to provide addi-tional elements allowing cross-validation of the VC, we used an ecophysiological measurement data set including stoma-tal conductance and predawn and midday leaf water poten-tial values previously collected on mature trees growing in the same area (Limousin et al. 2010b, Martin-StPaul et al. 2012,
Rodríguez-Calcerrada et al. 2012). Additionally, we estimated the range of water potential experienced by this species in the field (from spring to autumn; Limousin et al. 2009, 2010b,
Rodríguez-Calcerrada et al. 2011, Rodríguez-Calcerrada et al. 2014). These measurements were taken at ~3 week intervals over 7 years. In our experience, the comparison of different measurements performed on the same species but on differ-ent growth stages (mature trees and currdiffer-ent-year resprouts) is reliable because the stomatal behaviour of Q. ilex has been shown to be roughly similar in resprouts and mature trees (Castell et al. 1994).
Analysis of VCs
We aimed to carry out a rigorous assessment of which shape best fits the relationship between the PLC and the water poten-tial obtained with the different techniques. Inipoten-tially, we adjusted three different models covering the range of shapes of VCs encountered in the literature (sigmoidal, linear and exponential;
Cochard et al. 2013) for each technique independently. Next, we compared the efficiency of each model to predict the PLC. In order to test whether a VC was sigmoidal, we used the fol-lowing function (Pammenter and Vander Willigen 1998):
PLC = +1 exp( (100aΨ −b)), (1) where a is the slope at the inflection point and b is the inflection point of the curve, which in this case corresponds to the xylem pressure (Ψ ) inducing 50% loss of conductivity (P50). In order to
test whether the VCs were linear, we used the following model:
PLC= aΨ. (2)
Finally, in order to test whether the VCs were exponential (con-cave), we tested a power relationship:
PLC= aΨ .b (3)
Equation (3) can yield shapes ranging from concave to convex according to the value taken by parameters a and b. Thus, we constrained the model to adopt an exponential shape by limit-ing exploration of the parameters to values >0 and <1 for a and b, respectively. In order to test which shape suited best for each measurement technique, all three equations were fit-ted to the whole data set produced by each technique. The performance of the different models was then assessed using both the root mean squared error (RMSE) and the R2
computed for the linear relationship fitted between the PLC predicted by each equation and the PLC measured. The P50
predicted by each equation was computed for each technique. In order to compare the P50 produced by the CA and the AI
techniques and between the two sample size classes used for each method, the same procedure was applied, but P50 values
were computed for each individual sample. We then compared the mean P50 values between CA and AI using Student’s t-test.
For each of these techniques, we also compared the mean P50
between sample size classes. For the BD method, all the sam-ples were pooled together to construct a VC. Consequently, we used a bootstrap procedure (repeated 100 times) to assess the significance of differences in the mean and the variability of the P50 computed between the three methods. At each
itera-tion and for each measurement technique, we sampled 30% of the whole data set and computed a bootstrapped P50 (P50*)
based on the equation that best fitted the data. A distribution
of P50* was thus produced for each technique. The means and
variances of these distributions were compared between BD and both other techniques using Student’s t-test and Bartlett’s test, respectively. Analyses were carried out using R software (3.0.2).
Results
Maximal vessel length
The maximal vessel length estimated using the air infiltration method ranged between 0.75 and 1 m, with an average of 0.86 m. As a result, the samples used to build the VC with AI (0.15–0.25 m) or CA (0.28–0.42 m) and to perform the embo-lism position test had a large proportion of open vessels (>90%) from one end to the other of the samples. In contrast, the 1.2-m-long samples used to perform the BD VC had sections (at the more distal part) where vessels were fully closed by interves-sel punctuation, thus avoiding the artifact related to open vesinterves-sels. Field measurements of water potential of resprouts and native PLC
Xylem water pressures of the resprouts remained high dur-ing the summer drought period (−0.7 ± 0.2 MPa predawn and −1.8 ± 0.4 MPa at midday), compared with the sun branches of the surrounding mature trees (−3.5 ± 0.2 MPa predawn and −4 ± 0.4 MPa at midday). This was probably because the resprouts were irrigated. Indeed, other studies have reported that midday leaf water potentials of resprouts can reach −3 MPa (Castell et al. 1994). The native embolism measured on the current-year resprouts ranged between 0 and 18% and aver-aged 7 ± 7% (n = 6; Figure 1a).
Vulnerability curve based on the BD method
Using the BD method, PLC in Q. ilex resprouts increased sig-nificantly only for xylem pressures below −3.5 MPa, and their P50 was −4.7 MPa (Table 1). This value was retained after
fit-ting the sigmoidal function (Eq. (1)) to the data set (Table 1). Equation (1) indeed yielded far better performances than the linear model (Eq. (2)) and the power model (Eq. (3); Table 1), indicating that this VC was clearly sigmoidal (Figure 1). Furthermore, the native embolism recorded on resprouts roughly matched the PLC predicted by the VC for the minimal xylem pressure recorded in the field (Figure 1). At the xylem pressure recorded on resprouts (−1.8 MPa), native embolism was 7%, which falls within the 95% confidence interval of PLC predicted by the VC (2–24%).
Vulnerability curve fitting and comparison
All methods used to build our VCs yielded a decrease in conductivity with decreasing xylem pressure (Figures 1
and 2); however, means and variances of P50 values as well
as the shapes of the VCs varied substantially among the
methods (Tables 2 and 3). When all the data were consid-ered together, the P50 obtained using CA was much higher
than the BD P50 (Table 1). This was true whatever the
equa-tion used for interpolaequa-tion (ranging from −2.38 to −2.09 MPa; Table 1), indicating that the xylem was two times more prone to drought-induced cavitation compared with the standard BD method. Nevertheless, individual VCs measured with the 0.42 m rotor tended to be more flat and indicated a signifi-cantly lower vulnerability to cavitation (P = 0.04) than those obtained with the 0.28 m rotor (Figure 2b, Table 2). This is likely to have resulted from a lower proportion of vessels being
cut open when the longest samples were used. Using the CA method, a sharp increase in PLC was observed as soon as the xylem pressure decreased, which resulted in an obvious expo-nential pattern (Figure 2b and d). This was also confirmed by our statistical analysis, because the power equation (Eq. (3)) yielded the best fits, indicating that the VC was exponential but neither linear nor sigmoidal (Table 1). When all values were binned for each xylem pressure step, an exponential pat-tern was found whether we used the 0.28 or 0.42 m rotors (Figure 2b). Individual P50 values varied between −0.7 and
−5.9 MPa; hence, the CA technique produced a greater vari-ance than the BD technique (Table 3).
Values of P50 obtained using the AI data set ranged from
−5.65 to −5.75 MPa according to the equation adjusted to the whole data set (Table 1). All three equations adjusted to the AI data set yielded very close performance, but the sigmoidal function yielded slightly better results (Table 1). If one con-siders the equation that fitted the best to the data for each method, the P50 values obtained with the AI method were the
most negative (Table 1). This indicated an apparently very high cavitation resistance compared with BD. When the PLC of each sample was averaged per xylem pressure step, the VC exhib-ited a very flat pattern (Figure 2a). When Eq. (1) was fitted to data binned by sample length categories (0.15 and 0.25 m), the VC from the longest samples appeared more vulnerable to cavitation than the VC from the shortest samples (P < 0.05; Figure 2a). However, when Eq. (1) was fitted independently to each sample, the P50 of each individual curve varied greatly,
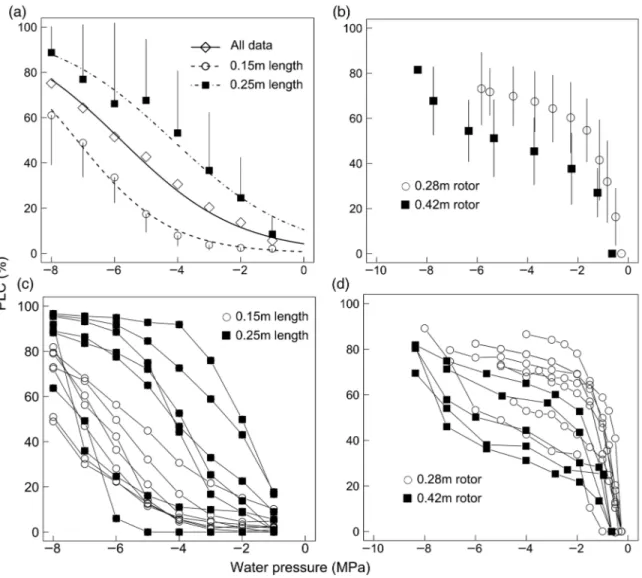
from −2 to −8.2 MPa. Consistently, a wide range of shapes from exponential to sigmoidal was revealed (Figure 2c). The Figure 1. (a) Bench drying (BD) vulnerability curve (VC; diamonds and continuous line; interpolation is indicated by the interrupted line) and the stomatal closure response to midday water potential (open circles and the dotted line). The filled square indicates the native embolism of resprouts for a xylem pressure of −1.8 MPa. (b) The same BD VC and a histogram of the frequency distribution of midday leaf water potential in the back-ground. Bars indicate the standard deviations. The data of midday leaf water potential (Ψmd) and stomatal conductance (gs) come from measure-ments on mature Q. ilex trees on nearby sites (see Materials and methods). Equation (1) was fitted to the percentage loss of conductivity (PLC) data (see Table 1). Equation (1) was fitted to the stomatal conductance data (gs = 100/(1 + exp(2.2 × (Ψmd − 2.4)), R2 = 0.5).
Table 1. Efficiency of the different equations adjusted to the loss of conductivity and xylem pressure data for the three methods tested (AI, air injection; BD, bench drying; CA, Cavitron). For each method, all samples were considered together during the fitting procedure. The different equations are described in the text. The fitted P50, the RMSE and the R2 of the linear model adjusted between the percentage loss of conductivity predicted and the measurements are given. For each method, the best model is indicated in bold.
Equation fitted Parameter and good ness of fit
BD CA AI Sigmoidal (Eq. (1)) P50 (MPa) − 4.70 −2.38 − 5.75 RMSE (MPa) 11.24 17.84 23.01 R2 0.71 0.54 0.51
Linear (Eq. (2)) P50 (MPa) −6.30 −2.55 −5.65 RMSE (MPa) 16.01 17.84 23.28
R2 0.62 0.52 0.51
Power (Eq. (3)) P50 (MPa) −6.30 − 2.09 −5.65 RMSE (MPa) 16.01 16.32 23.28
R2 0.62 0.64 0.51
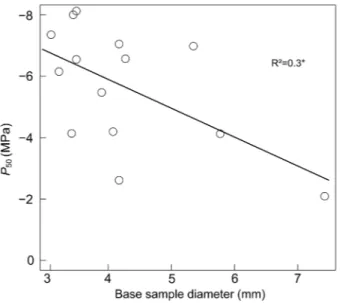
huge variability in P50 was partly explained by the base
diam-eter of the samples, because a significant relationship between the P50 and the base diameter of the sample was found
(Figure 3; R2 = 0.3, P = 0.03).
Distribution of PLC along the stem
The distribution of the PLC along the samples centrifuged at −4 MPa or pressurized at +4 MPa revealed that the highest PLC was not recorded in the middle of the sample (i.e., point of maximal pressure) whatever the method used (Figure 4). Instead, the PLC was greatest at the basal and upstream part Figure 2. Vulnerability curves measured on Q. ilex resprouts using the Cavitron (CA) and the air injection (AI) techniques. (a) The VC constructed using the AI when the samples were either pooled in total or pooled by sample length class. (b) Vulnerability curves constructed using the CA with two different rotor sizes when samples were pooled by sample length class. In (a) and (b), the PLC values were averaged by tension step; mean ± SD are shown (n ≥ 5). (c) and (d) depict the point data for each individual sample for AI and CA, respectively. Different symbols were used according to the sample size (0.15 and 0.25 m for AI) or rotor size (0.28 and 0.42 m for CA).
Table 2. Means and standard deviations of the absolute P50 (in MPa) computed for the air injection (AI) and the Cavitron (CA) methods. For both methods, each sample was fitted individually with the best model (see Materials and methods). The means and standard deviations of the P50 were then computed either for all samples or per size class. Significant differences are indicated by different superscript letters (Student’s t-test α ≤ 0.05) between the two methods by considering all samples and between the two sample sizes but for each method individually.
CA AI CA AI
All samples All samples 0.28 m 0.42 m 0.15 m 0.25 m 2.0 ± 2.0a 5.4 ± 2.1b 1.8 ± 1.8a 3.1 ± 2.0b 6.8 ± 1.0a 3.8 ± 2.0b
Table 3. Bootstrap comparison of the means and variances of P50 (in MPa) assessed with the three techniques. The mean and variance of the bootstrapped distribution of the P50 assessed with each technique (bench drying (BD), Cavitron (CA) and air injection (AI)) were compared using Student’s t-test and Bartlett’s test, respectively. Different super-script letters indicate significant differences at level 0.05.
BD CA AI
Mean Variance Mean Variance Mean Variance −4.7a 0.005d −2.1b 0.17e −5.7c 0.13e
of the segment and tended to decrease towards the proximal part whatever the method (Figure 4). The downward trend was steeper with CA than with AI (Figure 4).
Discussion
Several hundred VCs have been published using the BD method (Cochard et al. 2013) since it was first proposed by Sperry et al. (1988). Bench drying VCs have been demonstrated to predict accurately the level of embolism recorded in plants dehydrating in the field or in pots (Tyree et al. 1992, Breda et al. 1993). Researchers had therefore viewed this technique
as a reference for assessing VCs (Cochard et al. 1992, 2005,
Salleo et al. 1992, Choat et al. 2010, Ennajeh et al. 2010). However, following the development of faster measurement techniques in the early and mid-1990s (e.g., the AI and the centrifuge), an increasing number of published VCs yielded very high thresholds of xylem pressure for embolism (Cochard and Delzon 2013). These types of VCs were mostly reported for angiosperm trees with long xylem vessels (Cochard et al. 2013) and were called ‘exponential’ according to their shape. Recent studies have provided evidence that the exponential VCs resulted from a measurement artifact related to the use of segments with a large proportion of vessels cut open (Cochard et al. 2010, Choat et al. 2010, Ennajeh et al. 2010, McElrone et al. 2012). However, other researchers claimed that the expo-nential VCs were valid, arguing that they were obtained with both the old BD method and modern techniques (Jacobsen and Pratt 2012, Sperry et al. 2012, Tobin et al. 2013). In the following discussion, we will argue the following points: (i) that the BD can be suitable for constructing a sound VC on Q. ilex if the sampling is done on long enough samples; and (ii) that the AI and the CA methods produce inconsistent VCs on this long-vesselled species, because only samples shorter than the maximal vessel length can be used. Finally, we will synthesize our results within a framework that may help in assessing the validity of a VC when a reference is not available.
Bench drying as a reference method for assessing VC in Q. ilex
The VC built with the BD method was sigmoidal in shape (Figure 1, Table 1), with a P50 value equal to −4.7 MPa and
a threshold pressure for embolism induction below −3.5 MPa. It predicted a rate of embolism consistent with the native Figure 3. Relationship between the P50 of each individual sample
measured with the air injection technique and the basal diameter of the sample.
Figure 4. Distribution of PLC along the sample after injecting air at 4 MPa (a) or spinning at −4 MPa (b). For the AI method, two samples of 0.28 m and one of 0.5 m were used, whereas for the CA three samples of 0.28 m were measured. For each sample, PLC was assessed at either end of the sample and at the centre of the sample. For each of the three positions, PLC was assessed on two subsamples for each sample. Bars indicate the standard deviations.
embolism measured in the field (Figure 1a), which provides the first evidence for the reliability of this VC. Besides, this VC predicted a low rate of embolism (<25%) for the range of xylem pressure most frequently experienced by mature Q. ilex in nature (the 0.90 quantile of xylem pressure was −3.9 MPa; Figure 1b). This observation is in line with the classical view that trees are resistant enough to cavitation to cope with the xylem pressure needed to sustain transpiration (Cochard and Delzon 2013). Furthermore, by using a record of stomatal conductance data collected on mature trees, we found that the leaf water potential threshold for 88% of stomatal closure (−3.3 MPa) closely matched the xylem pressure causing 12% cavitation (−3.2 MPa). Although it is recognized that PLC should be related to xylem water potential, we found little difference between leaf and xylem water potential (approximately −0.3 MPa; data not shown). This result is in line with the tight correlation between the xylem pressure causing stomatal closure and the xylem pressure responsible for the onset of cavitation reported early at the interspecific level (Cruiziat et al. 2002). This is also in agreement with the expectation that trees control the extension of embolism by their stomatal closure (Jones and Sutherland 1991). Overall, these observations led us to the conclusion that for this species, BD can be regarded as a reference method.
Nevertheless, our BD VC is not consistent with the results of Sperry et al. (2012) and Tobin et al. (2013), who reported a very high rate of embolism at high xylem pressure on other oak species with similar methodologies. Wheeler et al. (2013)
recently provided evidence that excising samples under xylem tension might drain bubbles into the xylem conduits even when the samples are cut under water, thus provoking an arti-ficial increase in PLC. The artifact proposed by Wheeler et al. (2013) may therefore explain the high threshold of xylem pres-sure for embolism reported by Sperry et al. (2012) and Tobin et al. (2013). In contrast, we found little native embolism in the resprouts that were used to construct our BD curve (Figure 1a). This can be explained by two reasons related to our sampling procedure. Firstly, the dehydrated samples were cut so that they were larger than the maximal vessel length. Secondly, we measured the xylem pressure and PLC on subsamples taken only at the terminal part of the main samples. Consequently, if bubbles had been drained in the xylem conduits during the sampling procedure in the field as reported by Wheeler et al. (2013), their migration would probably have been stopped by intervessel punctuation, therefore producing little embolism in the apical part of the samples.
A last point that may question the validity of our BD VC comes from the recent results of Jacobsen and Pratt (2012), who reported that a sigmoidal VC obtained with the BD method may in fact overestimate the true resistance to cavi-tation. The authors showed that the maximal xylem-specific hydraulic conductivity declined during dehydration because of the development of vessel blockages. However, we did not find
any significant correlation between the water potential during dehydration and the maximal specific conductivity in our data (P = 0.7, R2 = 0.02; see Figure S1 available as Supplementary
Data at Tree Physiology Online), in agreement with the result of McElrone et al. (2012). Overall, this new evidence sug-gests that reliable sigmoidal VCs can be obtained with the BD method and that exponential curves obtained with this tech-nique should be interpreted with caution.
Cavitron and AI VCs are subject to a vessel length artifact The VCs obtained with CA exhibited an exponential increase in embolism as soon as dehydration occurred, therefore con-trasting markedly with the reference VC (Figures 1 and 2b). A very substantial overestimation of xylem vulnerability was obtained (P50 = −2.09 MPa; Table 1) compared with what was
measured with the reference BD VC (−4.7 MPa). Clearly, this VC was not consistent with the ecophysiological behaviour of Q. ilex (Figure 1). Such an overestimation of the true vulner-ability is congruent with the ‘open vessel’ artifact reported for Prunus persica and Quercus robur by Cochard et al. (2010). This artifact was explained by the fact that open vessels lack the end vessel pits and therefore do not filter the tiny particles or bubbles that may nucleate cavitation when they migrate near the middle of the stem where the tensions are the highest (Cochard et al. 2010, Wheeler et al. 2013). Additional sup-port for an ‘open vessel’ artifact comes from the distribution of the embolism along the samples after the xylem pressure was decreased to approximately −4 MPa using the CA. Note that we expected the level of PLC to be consistent with the pressure gradient imposed along the stem (i.e., to be maxi-mal at the middle of the sample where pressure was maximaxi-mal) caused by the spinning (Cochard et al. 2005, Cai et al. 2010a). However, a downward trend from one end of the segment to the other was observed (Figure 4b). This suggests that spin-ning had emptied the vessels cut open at the basal portion of the samples, while other vessels, at the other end of the seg-ment, remained filled with water (Cochard et al. 2010). Overall, these observations indicate that the CA technique should not be applied to Q. ilex.
Choat et al. (2010) and Ennajeh et al. (2011) also reported a substantial overestimation of the true VC using the AI tech-nique on long-vesselled species and concluded the existence of an ‘open vessel’ artifact. Likewise, as for the CA, Wheeler et al. (2013) proposed that the xylem sap, oversaturated with gas in the pressure chamber, would cavitate at lower air pres-sure than expected because the presence of tiny particles not filtered out by vessel ends would nucleate cavitation. At first sight, our results may appear contradictory with an overestima-tion of the P50 as reported by Choat et al. (2010) and Ennajeh
et al. (2011). Indeed, we found a great variability between the VCs obtained for each individual sample (Figure 2c), which yielded values of P50 ranging from −2 to −8.2 MPa. This
indicates that AI may either overestimate or underestimate the true vulnerability depending on the sample used (Figure 2d). We can hypothesize that this variability among samples is related to the proportion of open vessels within the sample (Ennajeh et al. 2011). This hypothesis is supported by the find-ings of Cochard and Tyree (1990), who reported that the ves-sel length of current-year shoots of different Quercus species varied from 4 to 80 cm. Interestingly, we also found that the longest samples were seemingly more vulnerable to cavitation than the shortest ones, which apparently conflicts the premise that the shortest samples are more prone to the ‘open vessel’ artifact (Figure 2a). However, this can be explained by the fact that, by chance, our longest samples had larger diameters than the shortest ones (see Figure S2 available as Supplementary Data at Tree Physiology Online) and were therefore more prone to an ‘open vessel’ artifact. Indeed, segments with larger diam-eter have been proved to have wider and thus longer vessels (Cochard and Tyree 1990, Cai et al. 2010b); hence, it is likely that samples with larger diameters had a larger proportion of vessels cut open. This latter interpretation is consistent with the significant relationship between the P50 and the sample
diameter we report in Figure 3 and leads us to the conclusion that the trade-off between hydraulic safety and hydraulic effi-ciency reported by Wheeler et al. (2005) should be regarded with caution for long-vesselled species. Finally, when seg-ments were pressurized at −4 MPa in their centre, we found a downward trend of the PLC from the basal to the apical end of the segments (Figure 4a). As for the CA, this is not consistent with the expectation that PLC should be maximal at the middle of the sample, where pressure was the greatest (Salleo et al. 1992, Cai et al. 2010a). Overall, these observations indicate that the AI technique is not appropriate for assessing the VC of Q. ilex.
Summary of the differences among the VCs
The ‘open vessel’ artifact reported by Cochard et al. (2010),
Choat et al. (2010) and Ennajeh et al. (2011) has recently been questioned on the basis that the reference BD method could yield highly vulnerable VCs (Jacobsen et al. 2012, Sperry et al. 2012, Tobin et al. 2013). Our study on Q. ilex provides additional support for the reliability of the BD method on long- vesselled species, because we found a VC consistent with native embolism and with the ecophysiological behaviour of Q. ilex in nature (Figure 1). Furthermore, we showed that the CA and the AI produced very different VCs from the BD method (Figures 1 and 2, Table 1), which suggests that these methods were affected by a vessel-length artifact. In some cases, this artifact was consistent with the ‘open vessel’ artifact; the CA produced highly vulnerable VCs with exponential shapes, and some of the VCs obtained with the AI had the same features. However, we also showed that the AI method could yield very variable VCs (P50 ranging from −2 to −8.2 MPa), which also
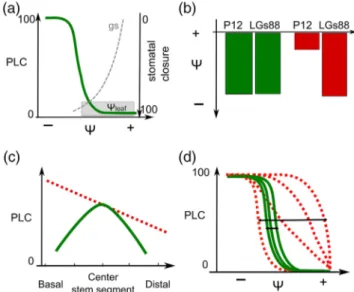
suggests an artifact (see the discussion above). It therefore appears that it can be difficult to assess whether a VC is sound or not using only a shape criterion (exponential or sigmoidal); hence, it may be useful to assess the validity of a VC using several criteria (Figure 5).
A typical VC has been schematized in Figure 5a, redrawn from our Figure 1. From here, it can be useful to assess whether the water potential threshold for stomatal closure matches the water potential responsible for the onset of cavitation (Figure 5b). In most cases, both values should match each other, as reported in interspecies comparisons (Cruiziat et al. 2002; but see
Beikircher et al. 2013 for instance). Furthermore, a comparison between the PLC in the middle of the segment and at both ends of the sample can indicate an ‘open vessel’ artifact if the embolism is not found to be maximal at the site where dehy-dration is maximal (Figure 5c). Finally, it appears important to check whether the measurements of VCs are repeatable, pro-vided they are performed on similar biological materials (Figure
5d). Further studies are needed to define an acceptable range of variation among samples, particularly when a reference VC is missing. So far, the few studies that have explored the variability of the P50 on a huge number of samples reported coefficients
of variation <13% using the CA technique (Herbette et al. 2010,
Lamy et al. 2013). Finally, these guidelines also apply to the BD
Figure 5. Illustration of some criteria for the validation of a vulnerability curve (VC). (a) A typical sigmoidal VC is depicted as the continuous line. Accordingly, plants operate—in terms of water potential and sto-matal conductance—mostly above the point cavitation as highlighted by the stomatal closure curve (grey dashed line) and the water poten-tial frequency distribution. (b) This depicts how the P12 and the xylem pressure provoking 88% of stomatal closure (LGs88) are expected to rank when a VC is reliable (left bars) or not (right bars). (c) This depicts how embolism is expected to distribute along the segments after drop-ping the pressure when samples with open vessels are used (dashed line) or when samples with closed vessels are used (continuous line). (d) This shows how the intersample variability of a VC is expected to be in the case of reliable (continuous lines) or biased VC (dashed lines).
method, because it can also be prone to an artifact related to open vessels (Wheeler et al. 2013).
Supplementary data
Supplementary data are available at Tree Physiology online.
Acknowledgments
The authors warmly thank David Degueldre for his help with field measurements. They also thank three anonymous review-ers for their constructive comments, which helped them to improve the manuscript.
Conflict of interest
None declared.
Funding
A doctoral research grant to N.K.M.-SP. was provided by the ‘Agence de l’Environnement et de la Maitrise de l’Energie (ADEME)’ and the French Research Agency (ANR), through the Drought+ project (ANR-06-VULN-003-01). Additional sup-port was provided by the European project CARBOEXTREME (EP7-ENV-2008-1, project number 226701). D.L. was funded by a PhD grant from EU FP7 program FUME ‘Forest Fires under Climate, Social and Economic changes in Europe, the Mediterranean and other fire-affected areas of the world’ con-tract Grant No. 243888.
References
Alder NN, Pockman WT, Sperry JS, Nuismer S (1997) Use of centrifu-gal force in the study of xylem cavitation. J Exp Bot 48:665–674. Beikircher B, De Cesare C, Mayr S (2013) Hydraulics of high-yield
orchard trees: a case study of three Malus domestica cultivars. Tree Physiol 33:1296–1307.
Breda N, Cochard H, Dreyer E, Granier A (1993) Field comparison of transpiration, stomatal conductance and vulnerability to cavitation of Quercus petraea and Quercus robur under water-stress. Ann Sci For 50:571–582.
Brodribb TJ, Cochard H (2009) Hydraulic failure defines the recov-ery and point of death in water-stressed conifers. Plant Physiol 149:575–584.
Cai J, Hacke U, Zhang S, Tyree MT (2010a) What happens when stems are embolized in a centrifuge? Testing the cavitron theory. Physiol Plant 140:311–320.
Cai J, Zhang S, Tyree MT (2010b) A computational algorithm address-ing how vessel length might depend on vessel diameter. Plant Cell Environ 33:1234–1238.
Cai J, Li S, Zhang H, Zhang S, Tyree MT (2014) Recalcitrant vulnerabil-ity curves: methods of analysis and the concept of fibre bridges for enhanced cavitation resistance. Plant Cell Environ 37:35–44. Castell C, Terradas J, Tenhunen J (1994) Water relations, gas exchange,
and growth of resprouts and mature plant shoots of Arbutus unedo L. and Quercus ilex L. Oecologia 98:201–211.
Choat B, Drayton WM, Brodersen C, Matthews MA, Shackel KA, Wada H, McElrone AJ (2010) Measurement of vulnerability to water stress-induced cavitation in grapevine: a comparison of four techniques applied to a long-vesseled species. Plant Cell Environ 33:1502–1512.
Choat B, Jansen S, Brodribb TJ et al. (2012) Global convergence in the vulnerability of forests to drought. Nature 491:752–755.
Cochard H, Delzon S (2013) Hydraulic failure and repair are not rou-tine in trees. Ann For Sci 70:659–661.
Cochard H, Tyree MT (1990) Xylem dysfunction in Quercus: vessel sizes, tyloses, cavitation and seasonal changes in embolism. Tree Physiol 6:393–407.
Cochard H, Cruizat P, Tyree MT, Cruiziat P (1992) Use of positive pres-sures to establish vulnerability curves. Plant Physiol 100:205–209. Cochard H, Bodet C, Améglio T, Cruizat P, Ameglio T (2000)
Cryo-scanning electron microscopy observations of vessel content dur-ing transpiration in Walnut petioles. Facts or artifacts? Plant Physiol 124:1191–1202.
Cochard H, Damour G, Bodet C, Tharwat I, Poirier M, Ameglio T, Améglio T (2005) Evaluation of a new centrifuge technique for rapid generation of xylem vulnerability curves. Physiol Plant 124:410–418. Cochard H, Herbette S, Barigah T, Badel E, Ennajeh M, Vilagrosa A
(2010) Does sample length influence the shape of xylem embolism vulnerability curves? A test with the Cavitron spinning technique. Plant Cell Environ 33:1543–1552.
Cochard H, Badel E, Herbette S, Delzon S, Piaf UMR, Choat B, Jansen S (2013) Methods for measuring plant vulnerability to cavitation: a critical review. J Exp Bot 64:4779–4791.
Cruiziat P, Cochard H, Améglio T (2002) Hydraulic architecture of trees: main concepts and results. Ann For Sci 59:723–752.
Ennajeh M, Simoes F, Khemira H, Cochard H, Simões F (2011) How reliable is the double-ended pressure sleeve technique for assess-ing xylem vulnerability to cavitation in woody angiosperms? Physiol Plant 142:205–210.
Ewers FW, Fisher JB (1989) Techniques for measuring vessel lengths and diameters in stems of woody plants. Am J Bot 76:645–656. Gartner BL, Roy J, Huc R (2003) Effects of tension wood on specific
conductivity and vulnerability to embolism of Quercus ilex seed-lings grown at two atmospheric CO2 concentrations. Tree Physiol 23:387–395.
Herbette S, Wortemann R, Awad H, Huc R, Cochard H, Barigah TS (2010) Insights into xylem vulnerability to cavitation in Fagus syl-vatica L.: phenotypic and environmental sources of variability. Tree Physiol 30:1448–1455.
Holbrook N, Zwieniecki M (1999) Embolism repair and xylem tension: do we need a miracle? Plant Physiol 120:7–10.
Jacobsen AL, Pratt RB (2012) No evidence for an open vessel effect in centrifuge-based vulnerability curves of a long-vesselled liana (Vitis vinifera). New Phytol 194:982–990.
Jones HG, Sutherland RA (1991) Stomatal control of xylem embolism. Plant Cell Environ 18:189–196.
Lamy J-B, Delzon S, Bouche PS, Alia R, Vendramin GG, Cochard H, Plomion C (2013) Limited genetic variability and phenotypic plastic-ity detected for cavitation resistance in a Mediterranean pine. New Phytol 201:874–886.
Limousin JM, Rambal S, Ourcival JM, Rocheteau A, Joffre R, Rodriguez-Cortina R (2009) Long-term transpiration change with rainfall decline in a Mediterranean Quercus ilex forest. Glob Change Biol 15:2163–2175.
Limousin JM, Longepierre D, Huc R, Rambal S (2010a) Change in hydraulic traits of Mediterranean Quercus ilex subjected to long-term throughfall exclusion. Tree Physiol 30:1026–1036.
Limousin J-M, Misson L, Lavoir A-V, Martin NK, Rambal S (2010b) Do photosynthetic limitations of evergreen Quercus ilex leaves change
with long-term increased drought severity? Plant Cell Environ 33:863–875.
Martínez-Vilalta J, Prat E, Oliveras I, Piñol J (2002) Xylem hydraulic properties of roots and stems of nine Mediterranean woody species. Oecologia 133:19–29.
Martin-StPaul NK, Limousin J-M, Rodríguez-Calcerrada J, Ruffault J, Rambal S, Letts GM, Misson L (2012) Photosynthetic sensitivity to drought varies among populations of Quercus ilex along a rainfall gradient. Funct Plant Biol 39:25–37.
Martin-StPaul NK, Limousin J-M, Vogt-Schilb H, Rodríguez-Calcerrada J, Rambal S, Longepierre D, Misson L (2013) The temporal response to drought in a Mediterranean evergreen tree: comparing a regional precipitation gradient and a throughfall exclusion experiment. Glob Change Biol 19:2413–2426.
McDowell N, Pockman WT, Allen CD et al. (2008) Mechanisms of plant survival and mortality during drought: why do some plants survive while others succumb to drought? New Phytol 178:719–739. McElrone AJ, Brodersen CR, Alsina MM, Drayton WM, Matthews
MA, Shackel KA, Wada H, Zufferey V, Choat B (2012) Centrifuge technique consistently overestimates vulnerability to water stress-induced cavitation in grapevines as confirmed with high-resolution computed tomography. New Phytol 196:661–665.
Melcher PJ, Holbrook NM, Burns MJ, Zwieniecki MA, Cobb AR, Brodribb TJ, Choat B, Sack L (2012) Measurements of stem xylem hydraulic conductivity in the laboratory and field. Methods Ecol Evol 3:685–694.
Pammenter NW, Vander Willigen C (1998) A mathematical and statisti-cal analysis of the curves illustrating vulnerability of xylem to cavita-tion. Tree Physiol 18:589–593.
Pittermann J, Stuart SA, Dawson TE, Moreau A (2012) Cenozoic climate change shaped the evolutionary ecophysiology of the Cupressaceae conifers. Proc Natl Acad Sci USA 109:9647–9652.
Rodríguez-Calcerrada J, Jaeger C, Limousin JM, Ourcival JM, Joffre R, Rambal S (2011) Leaf CO2 efflux is attenuated by acclimation of respiration to heat and drought in a Mediterranean tree. Funct Ecol 25:983–995.
Rodríguez-Calcerrada J, Limousin J-M, Martin-StPaul NK, Jaeger C, Rambal S (2012) Gas exchange and leaf aging in an evergreen oak:
causes and consequences for leaf carbon balance and canopy res-piration. Tree Physiol 32:464–477.
Rodríguez-Calcerrada J, Martin-StPaul NK, Lempereur M, Ourcival JM, del Carmen del Rey M, Joffre R, Rambal S (2014) Stem CO2 efflux and its contribution to ecosystem CO2 efflux decrease with drought in a Mediterranean forest stand. Agric For Metereol 195–196:61–72. Salleo S, Hinckley TM, Kikuta SB, Logullo MA, Weilgoni P, Yoon TM,
Richter H (1992) A method for inducing xylem emboli in situ: exper-iments with a field-grown tree. Plant Cell Environ 15:491–497. Sperry J (2013) Cutting-edge research or cutting-edge artifact? An
overdue control experiment complicates the xylem refilling story. Plant Cell Environ 36:1916–1918.
Sperry JS, Donnelly JR, Tyree MT (1988) A method for measuring hydraulic conductivity and embolism in xylem. Plant Cell Environ 11:35–40.
Sperry JS, Christman MA, Torres-Ruiz JM, Taneda H, Smith DD (2012) Vulnerability curves by centrifugation: is there an open vessel arte-fact, and are ‘r’ shaped curves necessarily invalid? Plant Cell Environ 35:601–610.
Tobin MF, Pratt RB, Jacobsen AL, De Guzman ME (2013) Xylem vulner-ability to cavitation can be accurately characterized in species with long vessels using a centrifuge method. Plant Biol 15:496–504. Tyree MT, Cochard H (1996) Summer and winter embolism in oak:
Impact on water relations. Ann Sci For 53:173–180.
Tyree MT, Alexander J, Machado JL (1992) Loss of hydraulic conduc-tivity due to water stress in intact juveniles of Quercus rubra and Populus deltoides. Tree Physiol 10:411–415.
Urli M, Porté AJ, Cochard H, Guengant Y, Burlett R, Delzon S (2013) Xylem embolism threshold for catastrophic hydraulic failure in angio-sperm trees. Tree Physiol 33:1–12.
Wheeler JK, Sperry JS, Hacke UG, Hoang N (2005) Inter-vessel pit-ting and cavitation in woody Rosaceae and other vesselled plants: a basis for a safety versus efficiency trade-off in xylem transport. Plant Cell Environ 28:800–812.
Wheeler JK, Huggett BA, Tofte AN, Rockwell FE, Holbrook NM (2013) Cutting xylem under tension or supersaturated with gas can gener-ate PLC and the appearance of rapid recovery from embolism. Plant Cell Environ 36:1938–1949.