HAL Id: hal-00835574
https://hal.archives-ouvertes.fr/hal-00835574
Submitted on 18 Feb 2019HAL is a multi-disciplinary open access archive for the deposit and dissemination of sci-entific research documents, whether they are pub-lished or not. The documents may come from teaching and research institutions in France or abroad, or from public or private research centers.
L’archive ouverte pluridisciplinaire HAL, est destinée au dépôt et à la diffusion de documents scientifiques de niveau recherche, publiés ou non, émanant des établissements d’enseignement et de recherche français ou étrangers, des laboratoires publics ou privés.
market redistribution
Emmanuelle Quillérou, Nolwenn Roudaut, Olivier Guyader
To cite this version:
Emmanuelle Quillérou, Nolwenn Roudaut, Olivier Guyader. Managing fleet capacity effectively under second-hand market redistribution. AMBIO: A Journal of the Human Environment, Springer Verlag, 2013, pp.1-17. �hal-00835574�
a s e n o te t h a t th is i s a n a u th o r-p ro d u c e d PDF o f a n a rti c le a c c e p te d f o r p u b lic a ti o n fo llo win g p e e r re v ie w. T h e d e fi n it iv e p u b lis h e r-a u th e n ti c a te d v e rs io n i s a v a ila b le o n t h e p u b lis h e r W e b
AMBIO, A journal of the Human Environment September 2013, Volume 42, Issue 5, Pages 611-627 © Royal Swedish Academy of Sciences 2012
The original publication is available at http://www.springerlink.com
Archimer
http://archimer.ifremer.frManaging fleet capacity effectively under second-hand market redistribution
Emmanuelle Quillérou1,*, Nolwenn Roudaut2, Olivier Guyader3,
1
United Nations University, Institute for Water, Environment and Health (UNU-INWEH), 175 Longwood Road South, Suite 204, Hamilton, Ontario, L8P 0A1, Canada
2
IREA, Université de Bretagne Sud, 8 rue Montaigne, 56017 Vannes, France
3 Ifremer, UMR AMURE, Unité d’Économie Maritime, Technopole de Brest-Iroise, BP 70, 29280 Plouzané Cedex,
France
*: Corresponding author : Emmanuelle Quillérou, email address : [email protected]
Abstract:
Fishing capacity management policies have been traditionally implemented at national level with national targets for capacity reduction. More recently, capacity management policies have increasingly targeted specific fisheries. French fisheries spatially vary along the French coastline and are associated to specific regions. Capacity management policies however ignore the capital mobility associated with second-hand vessel trade between regions. This is not an issue for national policies but could limit the effectiveness of regional capacity management policies. A gravity model and a random-effect Poisson regression model are used to analyse the determinants and spatial extent of the second-hand market in France. This study is based on panel data from the French Atlantic Ocean between 1992 and 2009. The trade flows between trading partners is found to increase with their sizes and to be spatially concentrated. Despite the low trade flows between regions, a net impact analysis shows that fishing capacity is redistributed by the second-hand market to regions on the Channel and Aquitaine from central regions. National capacity management policies (constructions/destructions) have induced a net decrease in regional fleet capacity with varying magnitude across regions. Unless there is a change of policy instruments or their scale of implementation, the operation of the second-hand market decreases the effectiveness of regional capacity management policies in regions on the Channel and Aquitaine.
Keywords: Gravity model, fishing vessels, second-hand markets, Poisson, French Atlantic JEL codes : D78; Q22; Q28; Q57; Q58
1. Introduction
Fishing capacity in the European Union is managed at country-level within the framework of the Common Fishery Policy (CFP). The CFP has aimed since 1983 to reduce fleet (over)capacity and adjust fleet capacity to available fishing resources in each Member State (European Commission 2008). National capacity reductions achieved under these policies have had a limited impact on overfishing reduction and the media have regularly outlined the failure to manage fisheries sustainably (e.g. Mediterranean Bluefin Tuna, North Sea Cod). Governments have therefore been under increased pressure to re-design and implement management policies to reduce overfishing more effectively. European capacity management policies rely on two main policy instruments: entry restrictions (access licences 1) and decommissioning subsidies. Since 2003, eligibility for national policies has been based on specific fish stocks and/or fishing areas and/or associated fleet segments criteria. Vessels are eligible for national capacity management policies regardless of their region of registration and fishing area. However, because of the distribution of fisheries along the French coastline, eligible fishing segments are distributed heterogeneously along the coastline (Berthou et al. 2002; Leblond et al. 2007, p15-24; Leblond et al. 2011, p13-22; Van Iseghem et al. 2011, Figure 3 p1797). All regions do not have equal access to these fishery specific policies and associated subsidies, and fishery specific policies are therefore also region specific.
Historically, French capacity management policies have targeted the place of administrative registration of the vessel rather than the actual fishing or landing areas. There are no legal constraints binding these areas together (Guyader et al. 2007). They are however strongly linked together in France. Ifremer's summary statistics reports consistently show that since 1996 most
1
Complementary licences have been introduced on a piecemeal basis at the regional or local (sub-regional) level to limit entry for specific fisheries and related fish stocks. These fishery licenses are operated by the fishing industry with limited involvement of the government so far. A more detailed description of how the fishing licences are operated in France can be found in MRAG et al. (2009, Part 2 Section 10, p106-133) and Larabi et al. (unpubl.).
vessels in the French fleet are small (less than 12m long), have 1 or 2 gears, practise 1 to 3 métiers 2 and fish close to the coast (Berthou et al. 2002; Leblond et al. 2007, p15-24; Leblond et al. 2011, p13-22). Several fish segments can fish the same fish stock but with varying catch or gross margins (Daurès et al. 2007). Fuel costs represent a large part of the fishing variable costs and vessel owners tend to register and operate their vessels close to where they live. All vessels along the coastline are subject to the same national-level legislation and have access to equivalent decentralised administrative services. Because of their link to specific fishing areas, places of administrative registration provide a pragmatic spatial basis for fishery policy assessment in France.
Capacity management policies have led to a decrease in overall fleet numbers and a higher proportion of the fleet being traded on the second-hand market for higher prices (Quillérou et al. 2011). The second-hand market is important for entry into the fishing sector for first-time capital-constrained buyers (van Putten et al. 2012). Capacity management policies have increased the role of the second-hand vessel market for fisher's entry into the fishing industry (Guyader et al. 2006; Quillérou et al. 2011, p20). Access and fishery licences are legally bound to a vessel. Trading a vessel necessarily includes trade of both the vessel and its access and fishery licences. Since 2006, owners have been allowed to sell their vessel whilst keeping their quota track records. Preliminary evidence would seem to suggest that the second-hand vessel trade has not been impacted much so far and this is still in transition (Larabi et al., unpubl.).
At the national level, these capacity management policies have led to a net decrease in vessel numbers and power (Lindebo 2005; Quillérou et al. 2011, p12; Quillérou and Guyader 2012). The
2
A métier is a homogeneous subdivision of a fishery by vessel type (ICES 2003, p2). The concept has recently been more specifically defined for the European Union as “a group of fishing operations targeting a similar (assemblage of) species, using similar gear, during the same period of the year and/or within the same area and which are characterised by a similar exploitation pattern” (European Commission Decision 2010/93/EU, Annex I Chapter 1, p9). Identification of different metiers is however not always straightforward in practice (Marchal 2008; Deporte et al. 2012).
national reductions in fleet capacity are however generally not equal across regions (Villasante 2010). There are two possible reasons for this: firstly the number of vessels constructed and decommissioned varies across regions and secondly the second-hand market redistributes the national fleet capacity between lower geographical levels.
In theory, the second-hand market acts as an efficient mechanism for capital redistribution from registration districts close to over-utilised/less profitable fisheries to districts close to under-utilised/more profitable fisheries. This capital redistribution along the French coastline through the hand market is compatible with national-level (non fishery specific) policy. The second-hand market trade acts as an internal redistribution mechanism as access licences do not restrict access between fisheries. Trade of second-hand vessels will occur depending on differences in fishing rents. For regional (fishery specific) policies however, the unrestricted redistribution of capital along the coastline between regions becomes an external pressure on regional capacity management.
Whereas before policy assessment against national targets has been undertaken at the national level, the adoption of more regionally focused fishery specific policies would require a shift to regional-level assessments against regional targets. This regional fishery focus for capacity management policies so far ignores capacity redistribution through the second-hand market between regions. If left free to operate between regions, second-hand market redistribution could undermine the effectiveness of regional policies.
There exists some knowledge on how fisher behaviour impacts capacity redistribution between fishing areas. Opaluch et al. (1984) showed that an individual fisherman reallocates its fishing effort between fisheries depending on economic incentives such as expected returns from the new location. They also showed that the high switching costs imposed by changing fisheries (imperfect
malleability) tend to limit this effort reallocation and that fishermen tend to stay within the same fishery over time. Because of the strong link between fisheries and places of registration in France, a long term-change of fishery would be associated to a change of place of registration. This change would also be generally associated to the owner moving homes closer to its vessel, or most likely a change of owners with the new owner living close to the new place of registration.
There is however little information available on capacity dynamics through changes of owners, including on the spatial extent of capacity redistribution (Fulton et al. 2011; van Putten et al. 2011). A previous description showed that 40-50% of traded vessels change maritime districts and 25-40% change regions through the operation of the second-hand-market in the French Atlantic Ocean (Quillérou et al. 2011, p30-31). Maritime districts in France are bundles of fishing harbours within a given region and constitute the administrative level for vessel registration. Maritime districts also provide the lowest spatial level for assessment of capacity management policies and allow for aggregation at the regional level. They also tend to be relatively specialised with one fishing segment more present than the others (Berthou et al. 2002; Leblond et al. 2007, p15-24; Leblond et al. 2011, p13-22; Van Iseghem et al. 2011, Figure 3 p1797).
Our study addresses this gap by focusing on trade of fishing capacity between two specific places of registration. We also examine consequences of the shift in spatial policy scale from the national level to the regional level on the policy effectiveness because of the operation of the second-hand vessel market.
Several proxies of vessel capacity can be used, e.g. vessel numbers, power, tonnage or investment. In this paper, we consider vessel numbers as a proxy for capacity and follow the same approach as in Quillérou and Guyader (2012). Vessel numbers do not constitute a perfect proxy for capacity and other measures of capacity or combination of measures should be ideally preferred. Bigger vessels
tend to have greater capacity than smaller vessels so each vessel (unit) does not represent an equal amount of capacity. Also, (subsidised) fishing vessels modernisation contributes to maintaining fleet overcapacity (Villasante and Sumaila 2010). A reduction in the number of vessels does therefore not necessarily mean less real fishing effort (Del Valle Erkiaga and Ikazuriaga 2012).
Vessel numbers provide a proxy for total fleet capacity (typically targeted by capacity management policies) but not actually used fleet capacity. Total fleet capacity is constrained by fleet (non)renewal through constructions/destructions of vessels and represents the capacity of a fully utilised fleet. Actually used fleet capacity is constrained by both constructions/destructions and fleet activity. Total and actually used fleet capacities have been very different in the French Atlantic Ocean. Both fleet activity and constructions/destructions have affected overall fleet numbers in 1994-2008 with similar magnitudes (Quillérou et al. 2011, p14; Quillérou and Guyader 2012). In 2009, about 5% of the French Atlantic Ocean fleet vessels were classified as "inactive" (not used for fishing).
Despite these limitations, and for the same reasons as outlined in Quillérou and Guyader (2012), vessel number is the only available unit of capacity that has been consistently recorded over the entire study period. There is no available consistent measurement of tonnage available across the whole time period for this analysis: the new GT unit is not comparable to the previous one, the change in measurement occurred over an unidentified period of time and there is no discrimination between measures in the data records. Also, records of vessel fishing power in the European fleet register have been shown to be inaccurate (Guyader et al. 2007). Our approach is however not limited to the use of vessel numbers and other measures of capacity such as power or tonnage could be used instead when available.
Our first research objective is to assess whether the second-hand market reallocates capacity between regions. We investigate what drives second-hand trade flows along the coastline and their spatial extent. We use a gravity model of trade flows of second-hand vessels between fishing districts. Distance between districts and spatial dummies have been explicitly included to identify the distance decay effect of trade between districts and regions. We use additional original fishery data to extend the gravity model estimation. We estimate this model using a random-effect Poisson Pseudo Maximum Likelihood econometric model to keep both time-varying and time-invariant variables. The analysis of residuals helps identify the regions of departure and arrival where trade flows are consistently under-estimated or over-estimated.
Our second research objective is to examine whether the second-hand trade has led to changes in capacity at the regional level and by how much. For a given region, we first assess the model reliability by computing of the net number of second-hand vessels arriving in a given region through the operation of the market. To do so, we compare the net arrival of second-hand vessels (i.e. arrivals less departures) predicted by the gravity model to the net arrival of second-hand vessels observed over the whole time-period. We then compare for each region the net arrival of second-hand vessels to the net increase in vessel numbers because of constructions/destructions. Constructions/destructions are the traditional focus of capacity management policies and most of them are subsidised by the government and/or administrative regions. Constructions/destructions are therefore used as proxies for capacity management policy impact. We derive consequences of capacity redistribution through the second-hand market induced by a shift from national to regional policies for capacity management.
This study complements the description of the French Atlantic Ocean depicted in Quillérou and Guyader (2012) by focusing on the change of spatial location of vessels within the French Atlantic Ocean fleet. This study constitutes a novel application of the gravity model to fishery management
data. The econometric model includes the zero trade flows into the estimation of second-hand vessel trade in the French Atlantic Ocean. This helps better understand fleet capacity dynamics and identify the spatial extent of the second-hand vessel market between districts and other determinants of trade. The analysis of residuals helps us identify the spatial distribution of the most unusual trade flows (i.e. the furthest from the calculated norm) for zero/non-zero flows and for each region. We also identify regions where the second-hand market could limit the effectiveness of regional capacity management policies. This study should serve as a basis to improve policy evaluations and inform policy design for more effective capacity management.
This paper is structured as follows. In Section 2 we present the economic and econometric models used for the estimation of second-hand vessel trade flows between districts. In Section 3, we describe the data used. In Section 4, we present the results of the gravity model between districts. We also present the net arrivals of second-hand vessels in a given region (predicted and observed) and the net increase in vessel numbers because of constructions/destructions. In Section 5, we discuss the implications of our findings in relation to our research questions. We conclude in Section 6.
2. Methodology
2.1. Gravity Model: Economic model description
The gravity model is mostly found in the international trade literature and relates bilateral flows to sizes and geographic distance between trading partners. The use of the gravity model has been recently rehabilitated by the introduction of multilateral resistance terms solving the omitted bias problem (Anderson and van Wincoop 2003, Feenstra 2004, Anderson 2011). We use a demand-side structure gravity model as described in Anderson (2011) to analyse the number of second-hand vessels (Xij) traded between districts of registration (i and j). Fishing vessels are considered as
homogenous goods with heterogeneous characteristics, e.g. age, length, power, tonnage, fleet segment. Our study constitutes the first application of the gravity model to second-hand fishing vessel markets.
In our context, the demand-side structure gravity model can be specified as follows (Equation 1):
Xij = YiYj Yw Tij PiPj 1−σ (Equation 1) with P1−σj = Piσ−1 i
∑
θiTij1−σ Pi1−σ = Pσj−1 j∑
θjTij1−σ Xij Number of vessels traded from fishing district i (origin) to district j (arrival)
Yi(j) Size of district i (j) (number of vessels)
Yw “World size” (Total number of vessels across all districts)
Tij Barrier-to-trade function between districts i and j
Pi(j) Implicit equilibrium price index in district i(j)
σ Elasticity of substitution between vessels of buyers
θi(j) Relative weight of vessel population of district i (j) (relative to Yw)
District size (Yi(j)) is the total number of vessels registered in the district and reflects the potential
supply of the exporting district and the potential demand of the importing district: the bigger the trading partners the more they trade together. This replaces country population used in international trade gravity models.
The barrier-to-trade function (Tij) reflects on the transaction costs between the trading districts (i
and j). It is traditionally a function of the geographical distance between the trading districts: the farther apart the trading partners, the less they trade together. Geographical distance proportional to fuel costs, which represent a major part of the transaction costs for traded vessels physically
changing districts by sea (Bastardie et al. 2010). The barrier-to-trade function also depends on variables reflecting the willingness-to-trade (or not) between the two fishing districts: district adjacency, whether the trading districts are within the same administrative region, the fleet structure of a given district characterised by total district vessel power, average vessel age, district specialisation characterised by the number of different fleet segments, the rate of transactions within each of the trading districts to capture market variations (e.g. in vessel profitability), and the age of trading vessel owners 3. These variables are specific to the context of second-hand trade of fishing vessels. Distance, district adjacency and regional dummies are included to identify the average spatial extent of second-hand market transactions (trade flow). The remaining gravity
model parameters (Pi(j), σ and θi(j) ) are assumed constant for the purposes of this analysis 4. Finally,
dummies controlling for the year of trade have also been included (coded by the corresponding year) to capture potential time-trends and identify policy changes.
2.2. Gravity Model: Econometric model description
In our study, trade data are characterised by a high number of zero-values: two fishing districts might not trade at all over the study period or some years only. 88.4% of the pairs of districts of
3
Greater specialisation of individual trading partners would be expected to lead to greater trade flows between them (Haveman and Hummels 2004). Subsidies are mostly offered at the national level, and there is no data available on regional or local subsidies. Also, there are no tax differences along the coastline other than landings taxes. There is no available data on these landing taxes and fishers can land outside their maritime district of registration. These were thus not included into the analysis. Fiscal regulations have been shown to influence investment into fishing capital across vessels (Le Floc’h et al. 2011). These regulations are national and apply to all administrative regions.
4
We tested fish landings as a proxy for implicit equilibrium prices Pi(j) in each district (or "multilateral resistance" for
trade with other districts) but these were not found to have a significant impact on trade flows between districts. This could be due to the available data on landings only representing the fraction of harvest landed in "criées" for auction and not including direct sales on fish markets. Landings are also inconsistently recorded over the time period. For these reasons of low data quality, we have removed landings from our analysis and have not detailed results in this paper.
origin and destination for a given year have a zero trade, 9.5% trade only one vessel across the whole time period, and 1.5% trade only two vessels across the whole time period.
This is fairly common in gravity models: two districts may not trade together at a given time because of large variable or fixed costs or because trade is imperfectly monitored. Our objective is not to test the gravity model econometric specification but rather determine the spatial extent of the second-hand market. Our analysis consequently follows the approach taken by Santos Silva and Tenreyro (2006) who recommend a Poisson Pseudo Maximum Likelihood estimation. The number of transactions Xijt is assumed to follow a Poisson distribution with a conditional mean function of a
set of independent variables (see Burger et al. 2009 for a detailed presentation of the model). This Poisson specification allows to estimate the gravity model in its multiplicative form with trade flows entered in levels. Santos Silva and Tenreyro (2006) and Westerlund and Wilhelmsson (2009) showed this econometric model performs well in the presence of heteroskedasticity as well as zero trade flows respectively for cross-section and for panel data.
The panel data approach allows to control for unobserved heterogeneity by including district-pair effects. The whole population of vessel transactions is available, which usually leads to consider the individual effects of the district pairs as fixed (Cameron and Trivedi 1998, Section 9.5, p290-292). However, we need to estimate the coefficients of the time-invariant district-pair specific regressors: for example, physical distances between districts do not change with time but their impact on trade might depending on the macroeconomic context of a given year. The individual effects are directional district pair effects treated as random in this study to avoid these being absorbed into the district-pair specific (individual) effects. Using a random effect approach potentially avoids the problems of omitted variables or neglected heterogeneity but coefficients may be inconsistent if the random effects are correlated with the regressors (Cameron and Trivedi 1998, Section 9.5, p290-292, Wooldridge 2002, p251-252).
3. Data and empirical application
3.1. Gravity Model: Data source, variable construction and descriptive statistics
The database used for this analysis has been constructed using Microsoft Access 2002 (Microsoft Corporation 1992-2001), ArcGIS 9.3.1 (Esri 2009), the Geospatial Modelling Environment add-on (Beyer 2001-2010), and R 2.10.1 (R Development Core Team 2009). The econometric analysis has been undertaken using Stata 10 (StataCorp 2007).
Figure 1 about here
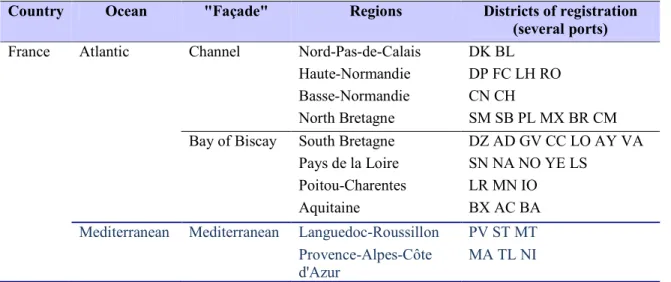
We use a balanced panel data of the 31 French Atlantic Ocean fishing districts (Figure 1) over the period 1992-2009 (18 years) available from Ifremer's Fisheries Information System (2010) representing the total population of second-hand vessel transactions. This dataset is based on the European fleet register with additional primary and secondary data compiled by Ifremer. More detailed descriptions of fleets and fleet segment characteristics can be found in Ifremer's "Synthèses des flottilles" (Ifremer 2010). The sampling strategy and plan of Ifremer's primary data collection are described in Van Iseghem et al. (2011). The hierarchy between the different scales of analysis is summed up in Table 1. The observations of second-hand vessel trade flows are spread across 930 pairs of districts of origin and destination for each year.
Table 1 about here
Districts of origin and destination are necessarily different as this is a between-district analysis. The database includes a dummy for vessels imported from (exported to) other countries but there is no information on where from (to). Our study is therefore limited to trade within France. The distance for a given pair of district of origin and destination is calculated as the sum of flying distances (in km) between the main ports of neighbouring districts and constitutes the best available proxy for the
travel distance by sea. For example, the distance beween Dunkerque and Dieppe DK to DP is calculated as the flying distance between Dunkerque and Boulogne-sur-Mer (DK to BL)flying added
to the flying distance between Boulogne-sur-Mer and Dieppe (BL to DP)flying i.e. DK to DP =
(DK to BL)flying + (BL to DP)flying (Figure 1). Flying distances between the main ports of
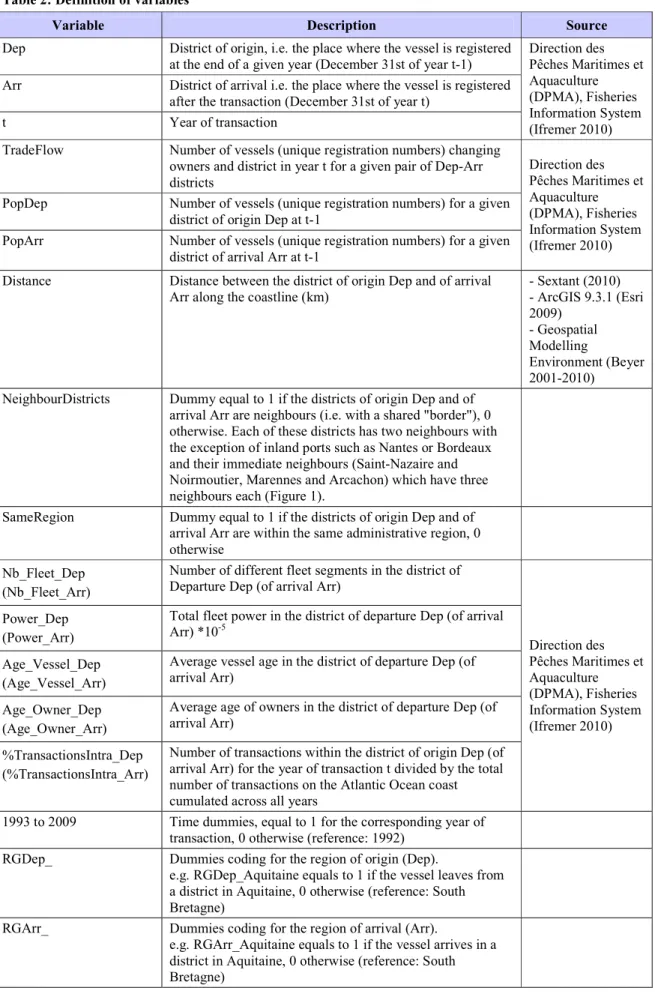
neighbouring districts have been computed from a geographical data layer of fishing district ports available at Ifremer (Sextant 2010) using ArcGIS 9.3.1 (Esri 2009) and its Geospatial Modelling Environment add-on (Beyer 2001-2010). All variables used are listed in Table 2.
Table 2 about here
Table 3 details the flows for each pairs of districts cumulated over the whole time period (from the district of departure as line to the district of arrival as column). 325 out of the 930 pairs of districts (34.95%) never trade over the whole time-period. The intensity of flows is higher (darker in Table 3) for neighbouring districts or districts that are relatively close (along the diagonal), as well as for districts on the same sea (Channel or Bay of Biscay). There also seem to be higher trade flows from South Bretagne (GV to SN) to North Bretagne and South Normandy (CN to SB), i.e. from the Bay of Biscay towards the Channel. This is consistent with Figure 2 showing the number of trade flows cumulated over the period decreasing with distance between maritime districts of registration. The distribution of zero trade flows is heterogeneous across regions (Table 4).
Table 3 about here
Figure 2 about here
Table 4 about here
On average, there are 266 transactions per year, 180 transactions per district (8.6 transactions per district per year), 0.145 transactions between two given different districts for a given year
(directional flow) and 0.07 transactions within a given district (Figure 2, Table 5). As regions have different number of districts, North Bretagne is the most represented region whilst Basse Normandie and Nord-Pas de Calais are the least represented regions in the dataset. All descriptive statistics are summarised in Table 5.
Table 5 about here
3.2. Vessel constructions and destructions: Dataset
The number of constructed and destructed vessels is taken from Ifremer's Fisheries Information System (2010). The database contains dummies for the types of vessel entry or exit which have been used to select the new built ("constructions") or scrapped vessels ("destructions") from the whole vessel population. The number of vessels is derived for each region in the Atlantic Ocean by counting the unique vessel registration numbers across the whole time-period (1992-2009). This time-period starts after the 1991 peak of subsidised vessel destructions in France to avoid introducing a bias in our analysis (Guyader et al. 2004).
The net increase in vessel numbers because of constructions/destructions is calculated for each region across the 18 years by subtracting the number of vessels leaving the region to be scrapped from the number of newly built vessels entering the region. The net increase in vessel numbers because of constructions/destructions captures the overall vessel population change in a given region resulting from both the arrival of new built vessels (constructions) and the exit of other vessels for destruction.
We derive the net arrival of second-hand vessel market trade on each regional fleet from both the gravity model predicted trade flows and observed trade flows. We compute the combined impact of the second-hand market and policy (constructions/destructions) for each region as the sum of the
net arrival of second-hand vessels and the net increase in vessel numbers because of constructions/destructions. For comparison purposes, we divide this combined impact (a cumulated value over the 1992-2008 time-period) by the fleet size in 2009 for each region.
4. Results
4.1. Gravity Model: Study of coefficients
Table 6 (a,b,c) about here
The traditional gravity model is reported as regression (A) in Table 6. Variables specific to the second-hand trade of fishing vessels are introduced in the model and reported as regression (B) in Table 6. Most variables are found highly significant with their expected sign. Model (B) is preferred following the results of the Likelihood ratio tests and suspicion of a misspecification bias for model (A) (Table 6).
As expected, the volume of trade increases with the sizes of both districts of departure and arrival, and decreases with geographical distance. Trade is also significantly greater between neighbouring
districts and for districts within the same administrative region. All regions have significantly more arrivals than South Bretagne (except Pays de la Loire and Poitou-Charentes which coefficients are not significant). Everything else held constant, there are less departures and more arrivals in Aquitaine relative to South Bretagne. The percentage of transactions within the district of departure has not been found significant whilst the trade flow significantly increases with the percentage of transactions within the district of arrival. Districts of departures trade younger vessels more, and districts of arrival trade more with other districts when their average fleet power is smaller and
owners younger on average. Compared to 1992, second-hand vessel trade between districts has been significantly greater from 1994 to 2009.
4.2. Gravity Model: Study of residuals for zero and non-zero trade flows and for each region
An analysis of the residuals at the district level reveals that the zero trade flows are slightly overestimated because of the nature of the Poisson estimation whilst the non-zero flows are on average underestimated. The difference between observed and estimated values is greater for non-zero flows than for non-zero flows because of the high number of non-zero flows in our dataset. Estimated non-zero flows are on average 30% less than their observed equivalent.
When aggregated at the regional level, the predicted regional flow is slightly overestimated for the more central regions (i.e. Normandie and Bretagne) whilst underestimated for more peripherical regions (Nord-Pas de Calais, Pays de la Loire, Poitou-Charentes, Aquitaine). This repartition of the residual signs does however not seem to mirror the number of zeros in each region (as shown in Table 4).
Table 7 about here
The difference between the estimated and observed net arrivals of second-hand vessels for a given region is however small (Table 7). For most regions, the difference is less than 10% of the observed value of net arrival of second-hand vessels, except for Nord Bretagne (14%), Haute Normandie (22%) and Basse Normandie (30%). This is because the differences between estimates and real-life values cancel out in computing the net arrival of second-hand vessels for a given region.
The second-hand market trade decreases fleet size in central regions (South Bretagne, Pays de la Loire and Poitou-Charentes) and increases fleet size in peripherical regions, i.e. regions on the
Channel (Nord-Pas de Calais, Haute Normandie, Basse Normandie, North Bretagne) and in Aquitaine (Table 7). The second-hand market represents on average for each year of the studied period between 0.3 and 1.7% of the 2009 fleet size.
4.3. *et arrival of second-hand vessels, net decrease in vessel numbers because of constructions/destructions for each region and their combined impact on regional fleets
All regional fleets have decreased in size because vessels destructions have been greater than constructions (Table 7). The magnitude of this reduction in regional fleets varies across regions, with a greater decrease in regional fleets of South Bretagne, Pays de la Loire and Aquitaine.
Both the second-hand market and capacity management policies (constructions/destructions) have decreased fleet size in central regions (South Bretagne, Pays de la Loire and Poitou-Charentes) as detailed in Table 7. However, the second-hand market and capacity management policies (constructions/destructions) have opposite impacts on fleet sizes in peripherical regions, i.e. regions on the Channel (Nord-Pas de Calais, Haute Normandie, Basse Normandie, North Bretagne) and in Aquitaine (Table 7). The combined impact of the second-hand market and the vessel constructions and destructions has led to an overall decrease in the vessel numbers in each region, except North Bretagne.
The combined impact of the second-hand market redistribution between regions and policy flows represents a small proportion of the remaining fleet size in 2009 in Nord-Pas de Calais (7%), Basse Normandie (2%), North Bretagne (2%), but about 20% in Haute Normandie and Aquitaine and over 40% of the fleet size in South Bretagne, Pays de la Loire and Poitou-Charentes (Table 7). Three types of regions can be identified: i) regions where the second-hand market and constructions/destructions are opposite and cancel one another out with limited overall change in regional fleet size (Nord-Pas de Calais, Basse Normandie, North Bretagne), ii) regions where the
second-hand market and constructions/destructions are opposite but constructions/destructions are greater leading to a decrease in regional fleet size (Haute Normandie and Aquitaine), and iii) regions where the second-hand market and constructions/destructions work in synergy and lead to a greater decrease in regional fleet size (South Bretagne, Pays de la Loire and Poitou-Charentes).
5. Discussion
5.1. A redistribution of capacity through the second-hand market mainly within regions
As predicted by the gravity model, trade flows significantly increase with the district populations and significantly decrease with distance factors (geographical as well as relative distance). All variables related to distance suggest that markets for second-hand vessels between districts are geographically (regionally) concentrated and that longer-term capital reallocation between regions (fisheries) has so far been spatially limited. This is consistent with the findings of Opaluch et al. (1984) on the limited spatial extent of changes between fisheries in the shorter-term. The spatial concentration of second-hand vessel market in France would be mainly due to the higher availability to the buyers of information on the traded vessel at the local or regional geographical level, consistent with the findings of van Putten et al. (2012).
Also, districts with less total fleet power and younger owners attract more second-hand vessels from districts with younger (less depreciated) vessels. Small (young) firms are typically limited in their investment ability and tend to buy less powerful (cheaper) second-hand vessels rather than new (more expensive) vessels to enter into the fishery sector (van Putten et al. 2012). Also, small (young) firms receive less subsidies than bigger firms in France and in the European Union (Guyader et al. 2007; Cappell et al. 2010).
The attractiveness of the district of arrival play a greater role in generating trade flows than that of the district of origin as indicated by the percentage of within-district transactions. The district of arrival can be more attractive because: i) of higher profitability, or ii) bigger second-hand markets attract more potential buyers, or iii) higher demand in the district of arrival for a given vessel type.
Second-hand vessel trade flows between districts seem to be subject to regional differences. Our results suggest that vessels tend to leave South Bretagne for other regions. Aquitaine's vessel population has increased because of the operation of the second-hand vessel market relative to that of South Bretagne. Vessels tend to be reallocated by the second-hand market towards regions bordering neighbouring countries (border with Spain in the case of Aquitaine, and borders with the United Kingdom and Belgium for the regions on the Channel).
1992 was found to be significantly different from the following years. This could be explained by the change in access licences conditions in 1993 (French Decree of January 8, 1993), the significant reduction in fleet size in 1991-1992 and the increase in the number of vessel owners over 1992-1999 (Quillérou et al. 2011; Quillérou and Guyader 2012). The decrease in the number of vessel owners from 2000 and the impact of other major policy changes such as the 2002 CFP reform and the 2006 implementation round of new French policies with the separation the vessel from its quotas track records for second-hand trade cannot be identified in this study as having had an impact on second-hand market trade (no detectable pattern in significance level, sign, value for 1992, 1993-2002, 2003-2006 and 2007-2009). This lack of change in time patterns could be either due to an imperfect capture of policy changes through the time dummies (which also capture impacts from the wider economy context) or because vessels or because changes in policy merely made official already on-going informal (unofficial) business.
Gravity models usually are mostly explanatory models with low prediction power. The objective of this study was not to test the gravity model itself so we have not formally tested its predictive power. Our coefficient estimates could be potentially used to estimate trade flows for the year after the end of the time period considered (2009), but results should be taken with caution.
The analysis of residuals suggests that our panel Poisson Pseudo Maximum Likelihood econometric model is subject to estimation biases. This is because of the underlying structure of our data (high number of zero flows) as discussed by Burger et al. (2009). This suggests that estimates of individual trade flows should be taken with caution especially for non-zero trade flows. At the regional level, because we have not found any obvious relationship between regional biases and the number of zero trade flows per region suggests that these regional biases are mainly due to the biases arising with the individual non-zero flows rather than a varying number of zero flows per region.
The gravity model does not directly allow to estimate the net impact of second-hand trade on regional fleet capacity (size). The second-hand market may be regionally concentrated on average but its net impact on regional fleets may be significant in some regions. The gravity model provides a valid estimate of net arrivals of second-hand vessels and could be used to estimate the net arrival of second-hand vessels in a given region for ex ante assessment of a change in capacity management policy scale.
5.2. A second-hand market increasing regional fleet capacity and undermining capacity reduction policy target achievement on the Channel and Aquitaine (peripherical regions)
The results from the estimation of individual trade flows suggest that the second-hand market should not impair the achievement of regionally set targets. Markets have been found geographically concentrated between neighbouring districts or within the same region. This is
assuming that a shift from a national policy to regional policies will not change the operation of the second-hand market and its spatial extent.
However, a closer look at the net impact of the second-hand market at the regional level, constructions and destructions at the regional level suggests that this average relationship does not hold for each region. The between regions redistribution, although low, is not zero and has a net impact on regional fleet capacity (size). At the regional level, the operation of the second-hand market would increase the regional policy effectiveness (reduction in regional capacity) in central regions (South Bretagne, Pays de la Loire and Poitou-Charentes), but decrease policy effectiveness in peripherical regions (Aquitaine and the Channel regions) and cancel out policy impacts in North Bretagne.
5.3. Consequences for design of regional capacity management policies
For at least three regions (Nord-Pas de Calais, Basse Normandie, North Bretagne), the impact of the second-hand market cannot be ignored if capacity is to be effectively reduced in each region. Assuming that regional and local government did want to reduce local capacity through the co-financing of decommissioning plans in the past, second-hand vessel market redistribution has clearly undermined this objective in these regions.
One way to ensure regional policy effectiveness would be to limit second-hand market trade between regions. This would however impair the efficient reallocation of capacity through a change of owner to more profitable fisheries or reduce transparency of capacity reallocation to the regulator. This type of regulation would impose an extra cost on society for monitoring and enforcement. Capacity policies are also subject to information problems because of asymmetric information and capacity heterogeneity (Curtis and Squires 2004; Guyader et al. 2004; Clark et al. 2005; Pascoe et al. 2012). In theory, moving to more targeted policies at the regional level could
decrease information problems by targeting more homogeneous fleet segments. This is however not likely to be the case in France because fleet segments are heterogeneous (as indicated by the Index of Variability detailed in Van Iseghem et al. 2011). Also, regulating second-hand market trade between regions would not prevent one fisher from fishing in more profitable areas nor give fishers increased incentives to reduce actually used fishing capacity rather than total capacity.
Rather than regulate second-hand market trade, limiting entry to specific fishery through implementation of fishery access licences might effectively limit trade between regions. This shift would be consistent with the policy scale of decommissioning policies and targeting of fisheries and related fish stocks (European Commission 2008, Commission of the European Communities 2009). Current fish stock management effectiveness is currently impaired for cross-country stocks (e.g. in the Channel) because policies are implemented within Member States but not between Member States. This approach would need to be applied for a given fishery for all concerned Member States to be fully effective.
Alternative policy instruments for capacity management could be altogether adopted to manage fishing capacity more effectively and fish stocks more sustainably. The French government is currently examining various policy options to prepare for the 2013 reform of the CFP. The current discussions at the European Union level suggests decommissioning plans would be discontinued and market-based instruments such as Individual Tradable Quotas and Individual Transferable Effort would be adopted for more effective reduction in overfishing and overcapacity (Commission of the European Communities 2009, European Commission 2011). Individual Trade Quotas (ITQs) realign incentives to fishermen for more economically efficient fish harvest whilst Individual Transferable Effort (ITE) realigns incentive for more economically efficient capacity management (Anderson 1989).
ITQs are instruments that directly reduce overfishing and provide indirect incentives to fishers for more efficient use of capacity (Asche et al. 2008; Squires et al. 2010). ITQs are not affected as such by second-hand trade between regions but would naturally restrict second-hand trade between regions in France if linked to specific fish stocks. For instance, fishing vessels need specific scallop fishing licences to harvest in the Bay of St Brieuc in North Brittany The majority of these vessels are traded between fishers already in the fishery. The scallop fishing licence, because it is geographically limited, acts as a natural barrier to second-hand trade between regions. The introduction of ITQs could reduce the cost of capacity management regulation to the French government compared to regional capacity management policies.
Some fish stocks are already currently subject to national quotas determined at the European Union level for each Member State. These national fishing quotas are allocated by the French government to producer organisations who in turn allocate them between individual vessels (MRAG et al. 2009, Part 2 Section 10, p106-133). These quotas can be traded within and between producer organisations. There is no uniform way to allocate these quotas across fisheries and related fish stocks, across producer organisations and across fishing vessels, and not all fish stocks are subject to fishing quotas. Trade of these quotas between fishing vessels is officially forbidden by law in France.
ITEs are instruments that directly reduce overcapacity thereby indirectly contributing to overfishing reduction and more sustainable harvests. This form of policy instrument has been adopted in the Tasmanian rock lobster fishery in Australia with capacity (pot traps) being sold or leased out between fishers (van Putten et al. 2011). The adoption of ITEs under a fixed quota allowance system led to a reduction in the number of active fishers and number of vessel days (effort) required to fish the allowed catch. The reduction in number of vessel days could in turn lead to a reduction in
fleet capacity although this is not detailed specifically in this study of the Tasmanian rock lobster fishery.
Our results suggest that the change currently considered by the French government from command-and-control capacity management policies at the regional level towards market-based instruments could be appropriate for more effective fishing stock and capacity management. Although appealing in theory, these instruments are however not always perfect in real-life. Clark et al. (2007) indeed showed that substituting ITQ schemes for limited-entry programs does not eliminate fully strategic behaviours of fishers. Effectiveness of these incentive instruments has been shown to depend on the current status and the dynamics of the stock, the broader context, transaction costs of implementation, time horizon, scale, the degree of uncertainty, the degree of heterogeneity of fishery users, initial allocation across stakeholders, and can be reduced when leasing is allowed (Whitmarsh 1998; Asche et al. 2008; Arnason 2009; Pinkerton and Edwards 2009; Townsend 2010; Holland and Herrera 2012; Péreau et al. 2012). All these parameters need to be considered for policy instrument design for effective capacity reduction and sustainable management of fisheries and related fish stocks. A further investigation is needed to assess whether ITQs would be sufficient to decrease capacity effectively or if complementary ITEs would be required. Consequences for economic efficiency would also need to be assessed between adoption of ITQs and adoption of both ITQs and ITEs.
Ideally, these market-based instruments should be implemented at the European level for increased management effectiveness. Current political discussions however suggest that fishing harvests and capacity would still be managed separately in each Member State. Tradable permits for both fishing harvests and capacity (ITQs and ITEs) would be implemented alongside one another in each Member State (European Commission 2011). The risk with adoption of these parallel instruments is that it keeps the overcapacity and overfishing goals separate and does not operationalise a hierarchy
between these goals. It is not clear that the new instruments will lead to an improvement on this aspect compared to the current system. The shift to these new instruments also raises concerns on how to ensure a fair initial quota allocation between vessels and/or owners, the impact of these tradable permits on industry concentration, the respective role of government and producer organisations in the permit market regulation, and which trading rules should be adopted (Anderson 2008, Flaaten 2010). Both ITQs and ITEs would require public funding for set up and monitoring of the transfer market. However, following recent concerns on market distortions induced by speculation, Member States may be allowed to regulate transfer market to prevent these distorsions.
6. Conclusion
This study aimed to assess whether the capacity redistribution along the French coastline by the second-hand fishing vessels market could undermine the effectiveness of capacity management policies implemented at the regional level, and by how much. We have modelled trade flows between fishing districts using a gravity model and a panel Poisson econometric model. Our results show that individual trade flows are indeed determined by spatial distances between trading partners and that second-hand markets tend to be geographically concentrated. Second-hand vessels tend to be reallocated from the central towards the peripherical regions. The national decrease in vessel numbers has been asymmetric between regions because of regional differences in both constructions/destructions and second-hand vessel net arrivals. Our results suggest that the change currently considered by the French from command-and-control capacity management policies at the regional level towards market-based instruments could be appropriate for more effective fishing stock and capacity management.
The gravity model has been designed to identify what determines trade flows relative to a norm (average flow) and does not lend itself to predictions, or at best to one-year predictions assuming
the same trading context. This paper did not aim to assess the prediction power of our model and we have therefore not explored this aspect.
Future research in relation to this study would require the design of a new econometric specification to reduce the overestimation of the zero trade flows (e.g. a panel zero-inflated model or panel negative binomial model in line with Burger et al. 2009). A dynamic panel could also be tried as an alternative to the random-effect model. The distance to consumer markets of the district of origin (arrival) could also be included into the model: a higher (smaller) distance to consumer markets could indeed increase the flow to (from) other districts (Head and Mayer 2011). A simple proxy was however not available for this study and would need to be custom-designed beforehand. Statistics on vessels characteristics that could influence trade (e.g. age, length, power, tonnage, number of different fleet segments) could also be included for each district of origin and of arrival to characterise the degree of structural differences (specialisation) between the trading districts.
Because a reduction in vessel numbers does not necessarily mean a reduction in capacity, it would be interesting to contrast results obtained from vessel numbers to other measures of capacity. It was however possible to use neither tonnage nor fishing power in this analysis because of incomparable measurement units and record inaccuracies over the time period considered.
It would be interesting to compare these results to the status of fishing stocks for each French region. There is so far no published research on the status of stocks in France, let alone each French region. Details on specific stocks can be found in Biseau et al. (2011). The status of the stock(s) for each region would need extensive research as it encompasses several fished species, fleet segments, districts of registration (fishing areas) and stocks are distributed across several European Member States. The results of such a study could then be compared to the results described in this paper.
This model could also be estimated on different time-periods and different measures of physical distance between districts to further test the robustness of our results, or for other countries. This is constrained by the number of non-zero observations available.
Acknowledgements
The authors would like to acknowledge the very helpful comments and suggestions of the Editor, the Associate Editor and two anonymous reviewers. We would also like to thank Dr Sylvain Barde (University of Kent) and Dr Olivier Thébaud (CSIRO) for their insights and constructive suggestions. We are also very grateful for comments and suggestions received during a seminar presentation at the School of Economics of the University of Kent (UK) and at the 2012 Conference of the Natural Resource Modeling Association as part of a research visit funded by the ARC Centre of Excellence for Environmental Decision (CEED) Australia. In addition, we would like to thank Dr Fabienne Daurès for her insights into fishery policy, Samuel Le Blond, Mathilde Pitel and the Sextant team at Ifremer for greatly facilitating the building of the database. We would also like to thank Tatiana Jousselin (ESRI) and Dr Hawthorne L. Beyer (Spatial Ecology LLC) for their help with ArcGIS 9.3.1 and Geospatial Modelling Environment.
Author Biographies
Dr Emmanuelle Quillérou is a project officer at the United Nations University Institute for Water, Environment and Health. Her research interests include natural resource economics and economic policy.
Dr Nolwenn Roudaut is a lecturer at the University of Southern Brittany. Her research interests include trade potential within the European Union, production econometrics and health economics. Dr Olivier Guyader is the current head of the Marine Economics Unit within the Department for Biological Resources and Environment at Ifremer. His research interests include marine resource economics, fishery management and policy.
References
Anderson, J. E. (2011). "The Gravity Model." Annual Review of Economics 3(1): 133-160. Anderson, J. E. and E. van Wincoop (2003). "Gravity with Gravitas: A Solution to the Border
Puzzle." American Economic Review 93(1): 170-192.
Anderson, L. G. (1989). Conceptual Constructs for Practical ITQ Management Policies. Rights Based Fishing, Kluwer Academic Publishers. 169: 191-209.
Anderson, L. G. (2008). "The Control of Market Power in ITQ Fisheries." Marine Resource Economics 23(1): 25-35.
Arnason, R. (2009). "Conflicting uses of marine resources: can ITQs promote an efficient solution?" Australian Journal of Agricultural and Resource Economics 53(1): 145-174. Asche, F., H. Eggert, E. Gudmundsson, A. Hoff and S. Pascoe (2008). "Fisher's behaviour with
individual vessel quotas - Over-capacity and potential rent: Five case studies." Marine Policy 32(6): 920-927.
Bastardie, F., J. R. Nielsen, B. S. Andersen and O. R. Eigaard (2010). "Effects of fishing effort allocation scenarios on energy efficiency and profitability: An individual-based model applied to Danish fisheries." Fisheries Research 106(3): 501-516.
Berthou, P., F. Daurès, O. Guyader, C. Merrien and M. Jézéquel (2002). Synthèse des pêcheries 2000 - Flotte Mer du Nord-Manche Atlantique, Ifremer - RH, DEM: 122 pages.
Beyer, H. L. (2001-2010). Geospatial Modelling Environment Version: 0.3.4 Beta, Spatial Ecology LLC. Available from: www.spatialecology.com/gme [Accessed 17/06/2010]
Biseau, A., R. Bellail, M. Bertignac, G. Biais, J.-L. Bigot, L. Bouche, J. Bourjea, A. Caro, M.-N. De Casamajor, N. Caill-Milly, M. Drogou, E. Duhamel, S. Fifas, E. Foucher, J.-M. Fromentin, A. Jadaud, L. Lampert, M. Laurans, M. Lissardy, P. Lorance, J.-C. Mahe, K. Mahe, J. Masse, G. Morandeau, L. Pawlowski, F. Poisson, L. Reynal, D. Roos, Y. Verin, Y. Vermard and J. Vigneau (2011). State in 2011 of exploited resources by french fishing fleets (In French), Ifremer: 68 pages. Available from:
http://archimer.ifremer.fr/doc/00035/14656/11956.pdf [Accessed 05/10/2012]
Burger, M. J., F. G. van Oort and G.-J. M. Linders (2009). "On the Specification of the Gravity Model of Trade: Zeros, Excess Zeros and Zero-inflated Estimation." Spatial Economic Analysis 4(2): 167-190.
Cameron, A. C. and P. K. Trivedi (1998). Regression analysis of count data, Cambridge University Press.
Cappell, R., T. Huntington and G. Macfadyen (2010). FIFG 2000-2006 Shadow Evaluation. Final Report. Report to the Pew Environment Group. Windrush, Warborne Lane, Portmore, Lymington, Hampshire SO41 5RJ, UK, Poseidon Aquatic Resource Management Ltd: 50 pages plus appendices. Available from:
http://www.pewtrusts.org/uploadedFiles/wwwpewtrustsorg/Reports/Protecting_ocean_life/F IFG-evaluation.pdf [Accessed 10/05/2012]
Clark, C. W., G. R. Munro and U. R. Sumaila (2005). "Subsidies, buybacks, and sustainable fisheries." Journal of Environmental Economics and Management 50(1): 47-58.
Clark, C. W., G. R. Munro and U. R. Sumaila (2007). "Buyback Subsidies, the Time Consistency Problem, and the ITQ Alternative." Land Economics 83(1): 50-58.
Commission of the European Communities (2009). Green Paper Reform of the Common Fisheries Policy. Brussels, European Commission: 28 pages. Available from:
http://eur-lex.europa.eu/LexUriServ/LexUriServ.do?uri=COM:2009:0163:FIN:EN:PDF [Accessed 18/05/2011]
Curtis, R. and D. Squires (2004). Fisheries Buybacks. La Jolla, California, Blackwell Publishing. 267 pages.
Daurès, F., M. Planchot, S. Demanèche, S. Van Iseghem, P. Berthou, E. Leblond and M. Jézéquel (2007). Contribution et Dépendance des flottilles de pêche aux espèces commerciales majeures du Golfe de Gascogne, Ifremer: 66 pages. Available from:
http://archimer.ifremer.fr/doc/00000/4697/ [Accessed 28/06/2012]
Del Valle Erkiaga, I. and K. A. Ikazuriaga (2012). "Assessing Changes in Capital and Investment as a Result of Fishing Capacity Limitation Programs." Environmental and Resource
Economics: Forthcoming.
Deporte, N., C. Ulrich, S. Mahévas, S. Demanèche and F. Bastardie (2012). "Regional métier definition: a comparative investigation of statistical methods using a workflow applied to international otter trawl fisheries in the North Sea." ICES Journal of Marine Science: Journal du Conseil 69(2): 331-342.
Esri (2009). ArcGIS Desktop: Release 9.3.1.
European Commission (2008). The Common Fisheries Policy: A user's guide. European Communities. Available from:
http://ec.europa.eu/fisheries/documentation/publications/pcp2008_en.pdf [Accessed 26/01/2011]
European Commission (2010). Commission Decision of 18 December 2009 adopting a multiannual Community programme for the collection, management and use of data in the fisheries sector for the period 2011-2013 (notified under document C(2009) 10121) (2010/93/EU), Official Journal of the European Union 16.2.2010. L 41/8: 8-71.
European Commission (2011). Reform of the Common Fisheries Policy, Communication from the commission to the European Parliament, the Council, the European Economic and Social Committee and the Committee of the Regions: 11 pages.
Feenstra, R. C. (2004). Advanced International Trade: Theory and Evidence. Princeton, Princeton University Press.
Flaaten, O. (2010). "Fisheries rent creation and distribution - the imaginary case of Codland." Marine Policy 34(6): 1268-1272.
Fulton, E. A., A. D. M. Smith, D. C. Smith and I. E. Van Putten (2011). "Human behaviour: the key source of uncertainty in fisheries management." Fish and Fisheries 12(1): 2-17.
Guyader, O., P. Berthou and F. Daurès (2004). Decommissioning Schemes and Capacity Adjustment: A Preliminary Analysis of the French Experience. Fisheries Buybacks. R. Curtis and D. Squires. La Jolla, California, Blackwell Publishing: 105-132.
Guyader, O., P. Berthou, C. Koustikopoulos, F. Alban, S. Démanèche, M. Gaspar, R. Eschbaum, E. Fahy, O. Tully, L. Reynal and A. Albert (2007). Small-Scale Coastal Fisheries in Europe. Final report of the contract No FISH/2005/10. Ifremer (coord.): 447 pages. Available from: http://ec.europa.eu/fisheries/documentation/studies/small_scale_coastal_fisheries_en.pdf and http://archimer.ifremer.fr/doc/00000/6348/ [Accessed 28/06/2012]
Guyader, O., F. Daurès, M. Jézequel and O. Thébaud (2006). Second Hand Market for fishing vessels and implicit price of fishing rights. International Workshop on Regulating Access to Marine Fisheries in the Coastal Zone - AMURE Research Group, January 2006, Brest, France.
Haveman, J. and D. Hummels (2004). "Alternative hypotheses and the volume of trade: the gravity equation and the extent of specialization." Canadian Journal of Economics/Revue
canadienne d'économique 37(1): 199-218.
Head, K. and T. Mayer (2011). "Gravity, market potential and economic development." Journal of Economic Geography 11(2): 281-294.
Holland, D. S. and G. E. Herrera (2012). "The impact of age structure, uncertainty, and asymmetric spatial dynamics on regulatory performance in a fishery metapopulation." Ecological Economics 77(0): 207-218.
ICES (2003). Report of the Study Group for the Development of Fishery-based Forecasts. Boulogne, France, 18–21 February 2003. Advisory Committee on Fishery Management, International Council for the Exploration of the Sea (ICES): 37 pages. Available from: www.ices.dk/reports/ACFM/2003/SGDFF/SGDFF03.pdf [Accessed 05/10/2012] Ifremer (2010). Système d'Informations Halieutiques (SIH). Available from:
http://www.ifremer.fr/sih/
Larabi, Z., O. Guyader, C. Macher and F. Daurès (unpubl.). "Gestion des quotas de pêche dans un contexte de non transférabilité des droits à produire : le cas de la France." Submitted to Marine Policy.
Le Floc’h, P., F. Daurès, M. Nourry, O. Thébaud, M. Travers and S. Van Iseghem (2011). "The influence of fiscal regulations on investment in marine fisheries: A French case study." Fisheries Research 109(2-3): 257-264.
Leblond, E., F. Daurès, P. Berthou, C. Merrien, M. Pitel-Roudaut, S. Bermell, C. Brigaudeau, M. Planchot, S. Demanèche, M. Jézéquel and E. Bodere (2007). Synthèse des flottilles de pêche 2006 - Flotte Mer du Nord - Manche - Atlantique - Méditerranée, Ifremer: 223 pages. Available from: http://archimer.ifremer.fr/doc/00042/15351/ [Accessed 22/06/2012] Leblond, E., F. Daurès, P. Berthou, C. Merrien, M. Pitel-Roudaut, C. Macher, C. Le Grand, S.
Demanèche, M. Jézéquel, E. Bodere and S. Le Blond (2011). Synthèse des flottilles de pêche 2009 - Flotte Mer du Nord - Manche - Atlantique - Méditerranée, Ifremer: 244 pages. Available from: http://archimer.ifremer.fr/doc/00042/15352/ [Accessed 22/06/2012]
Lindebo, E. (2005). "Role of Subsidies in EU Fleet Capacity Management." Marine Resource Economics 20(4): 445-466.
Marchal, P. (2008). "A comparative analysis of métiers and catch profiles for some French demersal and pelagic fleets." ICES Journal of Marine Science: Journal du Conseil 65(4): 674-686.
Microsoft Corporation (1992-2001). Microsoft Access 2002: Computer Program.
MRAG, IFM, CEFAS, AZTI Tecnalia and PolEM (2009). An analysis of existing Rights Based Management (RBM) instruments in Member States and on setting up best practices in the EU. Final Report. European Commission Studies and Pilot Projects for Carrying Out the Common Fisheries Policy No FISH/2007/03. London, MRAG Ltd: 117 pages. Available from: http://ec.europa.eu/fisheries/documentation/studies/rbm/index_en.htm [Accessed 29/06/2012]
Opaluch, J. J. and N. E. Bockstael (1984). "Behavioral Modeling and Fisheries Management." Marine Resource Economics 1(1): 105-115.
Pascoe, S., L. Coglan, A. E. Punt and C. M. Dichmont (2012). "Impacts of Vessel Capacity Reduction Programmes on Efficiency in Fisheries: the Case of Australia’s Multispecies Northern Prawn Fishery." Journal of Agricultural Economics 63(2): 425–443.
Pinkerton, E. and D. N. Edwards (2009). "The elephant in the room: The hidden costs of leasing individual transferable fishing quotas." Marine Policy 33(4): 707-713.
Péreau, J. C., L. Doyen, L. R. Little and O. Thébaud (2012). "The triple bottom line: Meeting ecological, economic and social goals with individual transferable quotas." Journal of Environmental Economics and Management 63(3): 419-434.
Quillérou, E. and O. Guyader (2012). "What Is Behind Fleet Evolution: A Framework for Flow Analysis and Application to the French Atlantic Fleet." ICES Journal of Marine Science: Journal du Conseil 69(6): 1069-1077.
Quillérou, E., O. Guyader, F. Daurès, M. Jézéquel, E. Leblond, S. Le Blond and M. Merzéréaud (2011). Analyse statistique du fonctionnement du marché des navires d'occasion et de la dynamique associée des flottilles. Évolution des prix sur le marché des navires d'occasion de 1992 à 2008. Rapport de la convention PPDR DPMA-IFREMER – Article 4.3, April 2011: 32 pages. Available from: http://w3.ifremer.fr/blpintra/doc/00036/14704/
R Development Core Team (2009). R: A language and environment for statistical computing. Vienna, Austria, R Foundation for Statistical Computing.
Santos Silva, J. M. C. and S. Tenreyro (2006). "The Log of Gravity." Review of Economics and Statistics 88(4): 641-659.
Sextant (2010). Port français et internationaux (version SIH 2010). Ifremer - Systèmes d'Informations Halieutiques, Plouzané. 28/06/2010 (revision). Available from:
http://www.ifremer.fr/sextant/srv/fr/metadata.show?id=205&currTab=simple [Accessed 17/06/2010]
Squires, D., Y. Jeon, R. Q. Grafton and J. Kirkley (2010). "Controlling excess capacity in common-pool resource industries: the transition from input to output controls." Australian Journal of Agricultural and Resource Economics 54(3): 361-377.
StataCorp (2007). Stata Statistical Software: Release 10. College Station, TX, StataCorp LP. Townsend, R. E. (2010). "Transactions costs as an obstacle to fisheries self-governance in New
Zealand." Australian Journal of Agricultural and Resource Economics 54(3): 301-320. Van Iseghem, S., E. Quillérou, C. Brigaudeau, C. Macher, O. Guyader and F. Daurès (2011).
"Ensuring representative economic data: survey data-collection methods in France for implementing the Common Fisheries Policy." ICES Journal of Marine Science: Journal du Conseil 68(8): 1792–1799.