HAL Id: hal-00317033
https://hal.archives-ouvertes.fr/hal-00317033
Submitted on 1 Jan 2002
HAL is a multi-disciplinary open access
archive for the deposit and dissemination of
sci-entific research documents, whether they are
pub-lished or not. The documents may come from
teaching and research institutions in France or
abroad, or from public or private research centers.
L’archive ouverte pluridisciplinaire HAL, est
destinée au dépôt et à la diffusion de documents
scientifiques de niveau recherche, publiés ou non,
émanant des établissements d’enseignement et de
recherche français ou étrangers, des laboratoires
publics ou privés.
co-located with and adjacent to visual auroral arcs
S. E. Milan, N. Sato, M. Lester, T. K. Yeoman, Y. Murata, H. Doi, T.
Saemundsson
To cite this version:
S. E. Milan, N. Sato, M. Lester, T. K. Yeoman, Y. Murata, et al.. The spectral characteristics of
E-region radar echoes co-located with and adjacent to visual auroral arcs. Annales Geophysicae,
European Geosciences Union, 2002, 20 (6), pp.795-805. �hal-00317033�
Annales Geophysicae (2002) 20: 795–805 c European Geophysical Society 2002
Annales
Geophysicae
The spectral characteristics of E-region radar echoes co-located
with and adjacent to visual auroral arcs
S. E. Milan1, N. Sato2, M. Lester1, T. K. Yeoman1, Y. Murata3, H. Doi4, and T. Saemundsson5
1Department of Physics and Astronomy, University of Leicester, Leicester LE1 7RH, UK 2National Institute of Polar Research, Tokyo 173-8515, Japan
3Graduate University for Advanced Studies, Tokyo 173-8515, Japan 4Tokai University, Kanagawa 259-1292, Japan
5Science Institute, University of Iceland, Reykjavik IS-107, Iceland
Received: 22 June 2001 – Revised: 20 February 2002 – Accepted: 26 February 2002
Abstract. Simultaneous all-sky camera and HF radar
obser-vations of the visual and E-region radar aurora in the west-ward electrojet suggest a close relationship between a pair of parallel east-west-aligned auroral arcs, separated by ∼30 km, and a region of strong radar backscatter. Poleward of this a broader region of radar backscatter is observed, though the spectral characteristics of the echoes in these two regions dif-fer considerably. We suggest that the visual aurorae and their radar counterparts are produced in a region of upward field-aligned current (FAC), whereas the backscatter poleward of this is associated with downward FAC. Relatively low elec-tric fields (∼10 mV m−1) are observed in the vicinity of the arc system, suggesting that in this case, two-stream waves are not directly generated through the electrodynamics of the arc. Rather, the generation of irregularities is most prob-ably associated with the gradient drift instability operating within horizontal electron density gradients produced by the filamentary nature of the arc FAC system. The observation of high Doppler shift echoes superimposed on slow background flow within the region of backscatter poleward of the visual aurora is argued to be consistent with previous suggestions that the ion-acoustic instability threshold is reduced in the presence of upwelling thermal electrons carrying downward FAC.
Key words. Ionosphere (auroral ionosphere; ionospheric
ir-regularities; particle precipitation)
1 Introduction
Considerable work was conducted in the 1970s concerning the relationship between optical auroral arcs and VHF coher-ent radar backscatter echoes from the E-region (Balsley et al., 1973; Greenwald et al., 1973, 1975; Romick et al., 1974; Tsunoda et al., 1974, 1976; Hunsucker et al., 1975; Tsun-oda and Fremouw, 1976a, b). In general, it was found that backscatter was observed adjacent to auroral arcs as opposed Correspondence to: S. E. Milan ([email protected])
to the two phenomena being co-located. Two mechanisms for the generation of metre-scale ionospheric irregularities – the targets from which VHF coherent radars scatter – were suggested to explain this interrelationship. In the first, it was the electron density gradients at the edges of auroral arcs that provided the seed for irregularity formation by the gradient drift instability (Balsley et al., 1973; Tsunoda et al., 1974). The growth rate of this instability becomes positive when the local electron density gradient has a component parallel to the background electric field. In the eastward electrojet the convection electric field is directed poleward and hence, it is the electron density gradient at the equatorward edge of the arc that is most favorable for the generation of irregularities, and so it is here that backscatter should be observed. This situation is reversed in the westward electrojet.
The second theory suggested instead that the irregulari-ties are generated in the electrojet region where the current is the greatest, and that this region is found adjacent to, but not co-located with, visual aurora (Greenwald et al., 1973). One conclusion of this work was that the most intense cur-rent was located in a region of relatively low electron density (low conductivity) compared with that expected to be asso-ciated with the adjacent auroral precipitation, and hence, the electric field in this region must be enhanced. In the observa-tions of Greenwald et al., the eastward electrojet was found equatorward of the visual aurora. Perhaps the discrepancy between these two generation scenarios can be understood in terms of the distinction made by Tsunoda et al. (1974) between diffuse and discrete radar echoes; the former is per-haps more associated with the electrojet and the latter with discrete visual aurora.
Although there has been considerable interest in E-region echoes observed by HF radars, i.e. backscatter from irreg-ularities of decametre-scales (e.g. much work in the 1960s, such as Bates, 1965, and more recently, Villain et al., 1987, 1990; Hanuise et al., 1991; Milan and Lester, 1998, 1999, 2001), it is only in the last few years that the subject of their interrelation with auroral arcs has been revisited (Mi-lan et al., 2000, 2001). The advantage of more modern radar
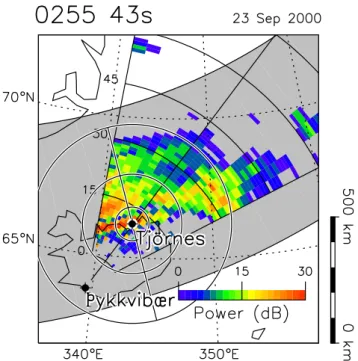
Fig. 1. A map showing the vicinity of Iceland and southeastern Greenland, indicating the location of the Pykkvibær radar and the Tj¨ornes all-sky camera. The radar field-of-view is mapped assum-ing a backscatter altitude of 110 km. Colour-coded is the backscat-ter power from the radar scan starting 02:55:43 UT on 23 September 2000. The projection of the ASC field-of-view is shown, with the three concentric circles marking the locii of zenith angles of 30◦, 60◦and 75◦mapped to an altitude of 110 km. The geomagnetic meridian employed to produce keograms is also shown. Superim-posed is the statistical auroral oval.
systems, such as SuperDARN (Super Dual Auroral Radar Network, Greenwald et al., 1995), over previous apparatus is that in addition to the measurement of solely backscat-ter power, Doppler velocity, spectral width, and to some ex-tent altitude information are also available. This allows for the echo characteristics to be defined much more accurately, and hence, hopefully different generation mechanisms can be distinguished. Milan et al. (2000) demonstrated that in-deed auroral arcs and E-region HF radar backscatter features appeared related, though unfortunately in their study, the viewing-geometry between the radar and the all-sky camera was not optimal and did not allow for the exact interloca-tion to be determined. A superior viewing-geometry allowed Milan et al. (2001) to suggest that backscatter may appear between pairs of auroral arcs (in that case separated by 200 to 300 km), or rather to be bounded at one edge by one arc and then sometime later to be bounded at the other edge by another arc. The present study reports on subsequent ob-servations which demonstrate a remarkable correspondence between closely-spaced (∼ 30 km) arc pairs and HF radar E-region backscatter.
2 Experimental arrangement
The observations to be presented in this study were collected on 23 September 2000, by an all-sky camera (ASC) and HF radar located in Iceland. To allow for an accurate compari-son of the radar and optical observations, it is essential that we are confident of the calibration and mapping of our two systems, which will form the focus of this section.
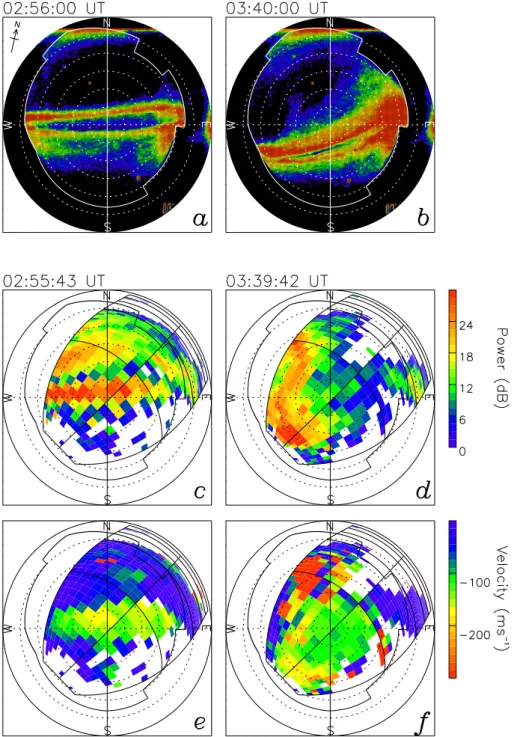
The ASC, situated at Tj¨ornes (66.20◦N, 342.90◦E) as shown in Fig. 1, comprised a video camera which recorded images to videotape at a rate of 24 frames per second. For the purposes of the present study, snapshot images were digitized from this videotape once every 30 s. Due to the nature of the automatic gain control of the camera and the digitization process, no absolute brightness measurements are available. Figures 2a and 2b show two ASC snapshots from 02:56 and 03:40 UT, digitized and presented using a colour scale (ar-bitary units), where the brightest features appear red. Bright spots within the images are heavenly bodies, with Jupiter be-ing the brightest feature in the southern portion of the field-of-view in both images. Comparison of the locations of these features with star maps allowed the alignment of the cam-era to be accurately determined. The centre of the image – the zenith of the field-of-view – could then be identified, as could the direction of geographic north (shown in top left corner of Fig. 2a). The image was then rotated so as to be aligned with the local geomagnetic meridian (solid vertical line); this meridian is employed later in the study to form keograms. Dotted circles show zenith angle locii in steps of 15◦. The presence of hills and buildings in the vicinity of the ASC means that the viewing horizon occurs at a zenith angle between approximately 60◦and 75◦, represented by an irreg-ular solid line. A line along the top of each image occurs at the edge of the video picture recorded on the videotape. In this study, we assume that the altitude of main optical emis-sion is 110 km. The field-of-view of the ASC is shown in Fig. 1, with concentric circles marking the 30◦, 60◦, and 75◦ zenith angle locii, projected to an altitude of 110 km, along with the projection of the geomagnetic meridian. Figure 3 shows the way in which this mapping is achieved.
The radar measurements were made by the Iceland East SuperDARN radar located at Pykkvibær (63.77◦N, 339.46◦E), shown in Fig. 1. The radar sounds along six-teen different beam directions separated by 3.24◦in azimuth, with the radar boresite pointing at an azimuth of 30◦ east of north. SuperDARN radar returns are gated into 75 range bins, usually of 45 km in length, with a range of 180 km to the first gate, giving a maximum range of 3555 km. However, E-region backscatter can only be identified unambiguously in the near ranges of the radar field-of-view, and hence, the “myopic” radar scan mode, designed specifically for study-ing E-region echoes, reduces the length of the 75 range gates to 15 km each, increasing the spatial resolution in the “us-able” portion of the field-of-view. The maximum range of this mode is 1305 km. This reduced field-of-view is shown in Fig. 1, which also illustrates the ranges which correspond to range gates 0, 15, 30, . . . From the slant range r of each
S. E. Milan et al.: E-region backscatter associated with auroral arcs 797
Fig. 2. Two all-sky images taken at (a) 02:56 UT and (b) 03:40 UT on 23 September 2000. Note that panel (a) corresponds to the time of the radar observations in Fig. 1. The circles mark the locii of zenith angle in steps of 15◦. The irregular solid line marks the horizon due to buildings, etc. The vertical solid line shows the geomagnetic meridian passing through zenith, which is employed to produce keograms. The direction of geographic north is indicated in the top left corner.
echo (time of flight), the ground range is determined assum-ing straight-line propagation to an altitude of 110 km (Fig. 3), a standard SuperDARN assumption for E-region backscat-ter. In the present study, the 16 beams are scanned clockwise from beam 0 to beam 15, with a dwell time of 3 s each, with a full scan of the field-of-view being completed every 49 to 50 s. The radar is operating at a frequency of 10.5 MHz, cor-responding to a wavelength λ ≈ 28.6 m. Bragg scatter is then observed from irregularities with a wavelength of 14.3 m. In
each radar cell, the spectral characteristics of the backscatter – power, mean Doppler shift and spectral width – are deter-mined directly from a 17-lag complex auto-correlation func-tion: the spectral width is a measure of the decorrelation time of the ACF, while the velocity is obtained from the rate of change of phase with lag; the reader is directed to Hanuise et al. (1993) for a full description of the ACF analysis tech-nique.
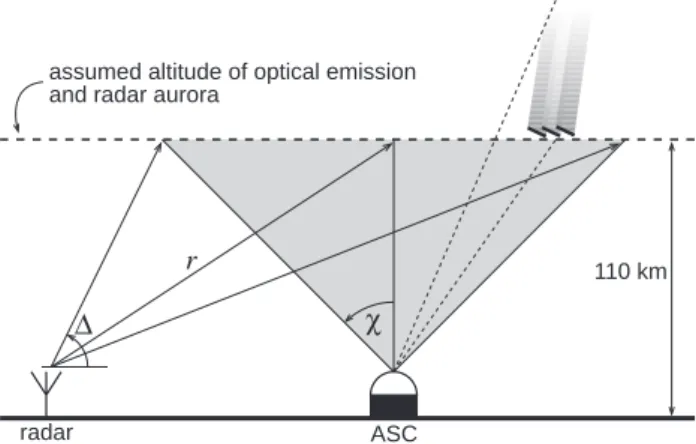
χ ∆ r ASC radar 110 km assumed altitude of optical emission
and radar aurora
Fig. 3. A schematic diagram showing the method of mapping be-tween radar and ASC observations, where r is radar range, 1 is elevation angle, and χ is zenith angle. In our algorithms, a curved Earth is assumed.
observed where the radar wave vector is perpendicular to the local magnetic field, known as the orthogonality condition. At auroral latitudes, radars operating at VHF frequencies – frequencies at which the radar beam is not significantly re-fracted by the ionosphere – can only achieve the orthogonal-ity condition near the peak of the E-region, over a relatively narrow latitudinal range, and only with a poleward-directed radar looking close to the horizon. HF radars, on the other hand, exploit the refractive nature of HF radio-wave propaga-tion in the ionosphere to achieve orthogonality over a range of altitudes both in the E- and F-regions (see, for instance, Milan et al., 1997b). Although our range-determination algo-rithm assumes that backscatter originates at an altitude of 110 km, more accurate estimates of the altitude of each echo can be found from a knowledge of the slant range to the backscat-ter volume r and a measurement of the elevation angle 1 of the radar returns (Fig. 3), determined using the interferomet-ric technique described by Milan et al. (1997a, 2001). Al-titude estimates made in this way will be presented later in this study, which show that the radar backscatter originates predominantly from the altitude range 100 to 140 km. We note that refraction of the radar beam is not taken into ac-count in these altitude estimates, i.e. we assume straight line propagation. In addition, calibration of the radar interferom-eter is somewhat tricky and so a small systematic error in the altitude estimates may be expected, but we are confident that differences in altitude between different regions of backscat-ter are real.
As discussed at length in our previous studies of the rela-tionship between radar and visual auroral forms, Milan et al. (2000, 2001), a fundamental limitation of ground-based ob-servations of the aurora is the ambiguity in determining the location of an optical feature without a detailed knowledge of the altitude profile of the emission intensity. Only auro-ral features situated directly above the observing site, i.e. at the zenith of the ASC field-of-view, can be located with cer-tainty. Another inherent limitation is that as the emission
generally occurs over a range of altitudes, optical features off-zenith may appear somewhat smeared out as the “top” and “bottom” of the aurora will appear at different zenith an-gles, i.e. the well-defined lower border of the aurora appears at higher zenith angles and the more tenuous higher altitude emissions appear at lower zenith angles (see Fig. 3). Again, this is less of a problem above the ASC. We have the option of two different strategies for comparing the radar and optical observations. In the first, the ASC observations are projected to a geographic frame, employing an assumed emission alti-tude, to compare with the radar measurements. Alternatively, the radar observations are projected onto the ASC field-of-view and compared directly with the optical images, though again, an optical emission altitude must be assumed to de-termine the radar mapping. For the present study, we have elected to employ the latter technique. Figures 2c–2f illus-trates the mapping of the radar field-of-view onto that of the ASC, assuming an optical emission altitude of 110 km; here, we show the same field-of-view grid as seen in Fig. 1. The geomagnetic meridian of the ASC field-of-view runs from beam 0, gate 30, through beam 7, gate 10 at zenith, to beam 15, gate 5. In the following analysis, we employ this merid-ian to produce “radar keograms” for direct comparison with optical keograms.
3 Observations
In Fig. 1, the radar backscatter power (signal-to-noise ratio) recorded during the scan starting 02:55:43 UT on 23 Septem-ber 2000 is colour-coded. Backscatter is only shown where the SNR of the echoes was sufficient to be able to calculate the spectral parameters of Doppler velocity and width. Run-ning east-west over the location of Tj¨ornes is a high backscat-ter power feature, which is of the order of 2–3 radar gates in latitudinal width. The location of the statistical auroral oval (Holzworth and Meng, 1975) is also shown in Fig. 1, and it is found that the enhancement in the backscatter power is closely aligned along this, though the statistical oval is much broader. This study will concentrate on the behaviour of this “radar arc” and its relationship to simultaneously served optical features. Other backscatter features are ob-served poleward of this location, and these will be discussed as well.
Figure 2 shows a direct comparison of visual and radar aurora observed at 02:56 UT (the same time as Fig. 1) and 03:40 UT. In both all-sky camera images (Figs. 2a and 2b), a pair of parallel, approximately east-west-aligned arcs are present near the zenith of the camera, with a separation of the order of 20–30 km. Such arc pairs are characteristic of our optical observations throughout the night of 22–23 Septem-ber 2000. At times, such as Fig. 2b, considerable additional structure is apparent, though on a gross scale it is the arc pair that dominates. Turning to the radar observations in Fig. 2c, the radar arc described above is clearly seen to be co-located with the visual arc pair, with the power maximum appearing to fall in the gap between the two auroral arcs. The
line-S. E. Milan et al.: E-region backscatter associated with auroral arcs 799
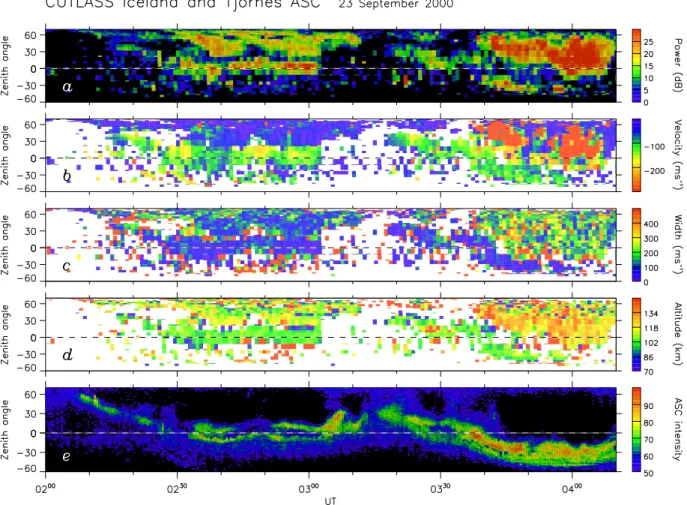
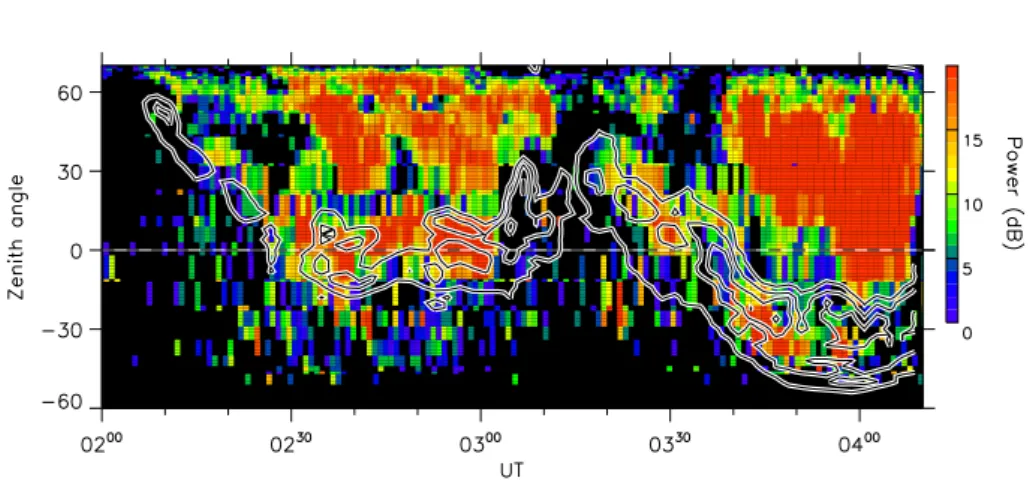
Fig. 4. Radar keograms of (a) backscatter power or signal-to-noise ratio, (b) Doppler shift or line-of-sight velocity, (c) spectral width, and (d) estimate of altitude of scatter volume. (e) Keogram of the visual aurora.
of-sight Doppler velocity indicated in Fig. 2e clearly distin-guishes between the backscatter associated with the arc pair, with velocities of the order of −100 to −200 m s−1 (neg-ative line-of-sight velocities represent Doppler shifts away from the radar), and backscatter poleward and equatorward of the radar arc in which, in general, velocities smaller than
−100 m s−1 are measured. In the second example shown, Figs. 2b, 2d, and 2f, the relationship between the visual and radar signatures appears less clear. However, as will be seen below, backscatter features are still distinguishable that relate specifically to the auroral arc pair.
Figure 4 presents radar and optical observations from the interval 02:00 to 04:10 UT. Panels (a)–(d) are radar keograms of backscatter power, Doppler velocity, spectral width, and the estimated altitude of origin of each echo. In panel (a), black indicates where the SNR was insufficient for spectral characteristics, such as velocity and width, to be determined; these parameters are only indicated in panels (b)–(d), where significant SNR was received. Panel (e) presents an optical keogram. In all five keograms, a dashed line indicates the location of the ASC zenith. We will discuss the optical ob-servations first.
At the start of the interval no significant optical features
are observed. However, at 02:08 UT, a feature appears pole-ward of Tj¨ornes at a zenith angle near 60◦. Inspection of the individual ASC images shows that this is an east-west-aligned optical arc. For the next 20 min or so, this fea-ture drifts equatorwards, reaching the ASC zenith at approx-imately 02:30 UT, before moving just south of the zenith. At this time, 02:33 UT, the arc brightens and a second fea-ture appears adjacent to and polewards of it, forming an arc pair as described above. This arc pair continues to strad-dle the ASC zenith for the next 30 min until 03:03 ˙UT. Dur-ing this time each arc varied individually in brightness, most noticeably between 02:45 and 02:51 UT when the poleward-most arc faded considerably. At 03:03 UT, the auroral in-tensity increased and there was a rapid poleward motion of the poleward-most arc until 03:08 UT, when the intensity dropped and only a single arc remained. Between 03:12 and 03:16 UT, no auroral emission was observed. An au-roral arc became apparent once again at 03:16 UT, poleward of zenith. This subsequently drifted equatorwards, across the ASC zenith at 03:30 UT, to the south of zenith, reaching its southern-most position near 04:00 UT. After 03:25 UT, it is clear that this auroral feature had bifurcated into an arc pair, though there is also considerable additional structure within
this feature, as suggested above in relation to Fig. 2b. Careful examination of the four radar keograms in Fig. 4 indicates that there is a backscatter feature which can be di-rectly associated with the optical auroral arcs observed by the ASC. This feature is first observed near 02:15 UT at a zenith angle of 30–40◦. It subsequently moves equatorwards, reach-ing the ASC zenith at 02:30 UT. At this time, it increases in backscatter power, and remains near-zenith until 03:03 UT when it disappears. Comparison of Figs. 1 and 2 reveals that this is the same radar arc located at the latitude of Tj¨ornes (the zenith of the ASC) at ∼02:56 UT. This backscatter fea-ture is observed once more at 03:17 UT, at a zenith angle of 30◦. Finally it drifts equatorwards, crossing the zenith near 03:30 UT, reaching its most southerly position at 04:00 UT, when it once more fades from view. We can characterize the echoes associated with the radar arc as follows. The echoes are narrow, with spectral widths, in general, below 100 m s−1, with line-of-sight velocities which vary between
−50 and −100 m s−1. In addition, the echoes appear to origi-nate from an altitude between 100 and 110 km. We also note that the backscatter power within this feature appears to be the greatest when two parallel optical arcs are present, for instance, between 02:32 and 03:03 UT. There is also a sug-gestion that the line-of-sight velocity is reduced when the arc pair appears: the line-of-sight velocity is greatest be-fore 02:33 UT, bebe-fore the second arc appears, and between 02:47 and 02:51 UT when the poleward arc fades. As will be demonstrated below, the direction of electron drift deduced from the Doppler shifts is directed predominantly eastward, placing our observations in the westward electrojet, consis-tent with the location of the radar in the early dawn sector.
A direct comparison of the relative locations of the optical and radar arc is made in Fig. 5. Here, the optical keogram, somewhat smoothed to allow for contouring, has been super-imposed over the radar power keogram. Two main conclu-sions are reached. When only a single auroral arc is present (approx. at 02:10–02:30 UT, 02:40–02:50 UT, and 03:20– 03:30 UT), the radar arc lies at the poleward edge of the op-tical luminosity. However, when an arc-pair is observed (for instance, at 02:30–02:40 UT and 02:50–03:04 UT), the cen-tre of the radar arc lies between the two peaks in luminosity. Additional regions of backscatter, other than the radar arc, are also observed throughout this period, especially north-ward of the radar arc, but to the south as well (Figs. 2 and 4). This can also be seen in Fig. 6, which shows the backscatter power and Doppler shift observed during four radar scans from the 8 min period following 02:49 UT; these scans are shown since they are typical of the radar observa-tions throughout the interval of study. Figure 6 shows several interesting features. The radar arc is clearly apparent in the backscatter power measurements of each scan, being in gen-eral the strongest feature observed (near gate 5 in beam 0). Sporadic backscatter is seen at lower latitudes. Other L-shell aligned backscatter features are seen at higher latitudes in the more westerly beams, approximately beams 0 to 10. These features occur in a region where no auroral luminosity is ob-served. Ground clutter echoes, identified by virtue of their
characteristic low Doppler shift and spectral width (see be-low), are observed in the more easterly beams, indicated in grey in the velocity panels of Fig. 6. As discussed in associ-ation with Fig. 2, the Doppler shift measurements reveal that the line-of-sight velocities observed within the radar arc are considerably different from those observed outside it, i.e. a distinct flow signature exists within the arc. This flow sig-nature will be investigated in more detail below. Finally, the echoes observed poleward of the radar arc typically have rel-atively low Doppler shifts (| vlos |< 150 m s−1), but small
regions of echoes are observed in each scan which have con-siderably higher Doppler shifts (| vlos|>150 m s−1), greater
than the typical ion-acoustic speed, seen as irregular patches of red. These patches become more evident after 03:35 UT, when such echoes are seen consistently in Fig. 4b, where again, they appear superimposed on a background of lower Doppler shift echoes. These observations are similar to those described previously by Milan et al. (2001).
The spectral characteristics of the backscatter, as a whole, are examined more quantitatively in Fig. 7. In this way, we hope to determine whether the spectral characteristics of the radar arc are materially different from those of the other E-region echoes, so as to give a clue to their generating mecha-nism. In Fig. 7, three panels show the backscatter (a) power, (b) spectral width and (c) altitude as a function of Doppler shift, for all echoes observed between 02:00 and 04:10 UT; the contours indicate the density of data points on a loga-rithmic scale; approx. 54 000 echoes were observed in to-tal during this period. Plots of this nature have been dis-cussed at length in Milan and Lester (1999, 2001) and Milan et al. (2001), and the backscatter characteristics presented here are consistent with these previous studies. Three main populations of echoes are observed: a high Doppler shift population (| vlos|> 350 m s−1), which originates at
alti-tudes between 100 and 160 km; a low Doppler shift popu-lation (| vlos |< 300 m s−1) from altitudes between 80 and
150 km; a very low Doppler shift (| vlos |< 50 m s−1) and
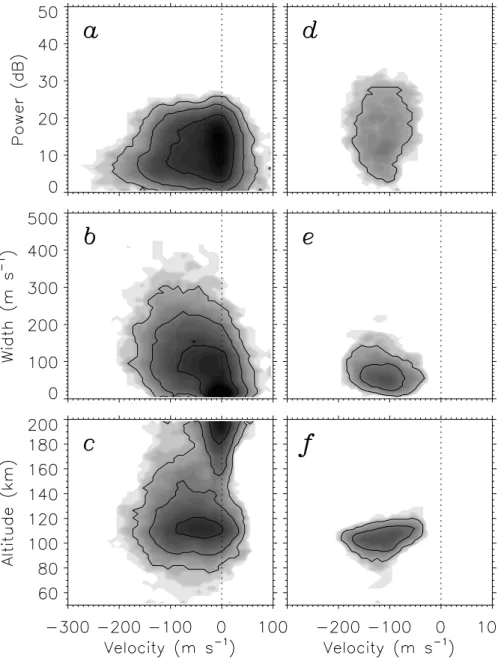
very low spectral width (1v < 30 m s−1) population which originates at altitudes above 180 km. The latter population is the ground clutter described above and of little interest to the present study. This ground clutter appears to originate at high altitude as it necessarily violates our straight line propagation assumption. The high Doppler shift population comprises the sporadic echoes observed poleward of the radar arc, as men-tioned above; these will be discussed more fully below. Of most immediate interest is the low Doppler shift population, some of the echoes of which comprise the radar arc. To in-vestigate the characteristics in more detail, we concentrate on the interval 02:30 to 03:03 UT when the radar arc remained almost stationary near the zenith of the keogram meridian. During this interval we have identified all echoes associated with the arc, and plotted the characteristics of these in a sim-ilar manner to Fig. 7 (see Figs. 8d–8f). For comparison, all other echoes from this interval are shown in Figs. 8a–8c (ig-noring echoes with Doppler shifts in excess of −300 m s−1). Again, a contribution from ground clutter is evident in this figure, especially in panel (c). Differences are observed
be-S. E. Milan et al.: E-region backscatter associated with auroral arcs 801
Fig. 5. A comparison of the backscatter power keogram, assuming an optical emission altitude of 110 km, and the visual luminosity keogram (contours).
Fig. 6. Backscatter power and Doppler shift from four radar scans between 02:49 and 02:58 UT. Every third scan from this interval is shown.
tween the radar arc and the surrounding backscatter, which can be summarized as follows: a slightly broader range of backscatter powers are observed in the radar arc, extending up to 30 dB, as opposed to 25 dB; the Doppler shifts are con-centrated between −50 and −200 m s−1, as opposed to +50 and −200 m s−1; the spectral widths tend to be lower, 1v < 100 m s−1, whereas, in general, 1v ranges up to 300 m s−1. In addition, the range of altitudes from which the radar arc appears to originate is narrow, 90 to 110 km, in comparison to the surrounding backscatter.
We can also deduce that the convection flow associated
with the radar arc is somewhat different from that observed just poleward and equatorward of it, as suggested before. Ap-plying a beam-swinging analysis to the Doppler shifts allows for the direction and magnitude of the plasma drift within a population of backscatter echoes to be inferred, as dis-cussed in some detail in Milan and Lester (2001) and Milan et al. (2001). This analysis is shown in Fig. 9 for backscat-ter within the radar arc (Fig. 9b) and backscatbackscat-ter polewards and equatorwards of it (Fig. 9a) for the interval 02:30 to 03:03 UT. These panels show the Doppler shift, vlos, plotted
Fig. 7. The density of echoes in (a) power-velocity, (b) width-velocity, and (c) altitude-velocity space for the interval 02:00 to 04:10 UT on 23 September 2000. The shading indicates density on a logarithmic scale.
and the local L-shell. We term this angle the “L-shell angle” or φ, and it is measured anti-clockwise from geomagnetic east. The easternmost beam of the radar points almost paral-lel to the local L-shell, whereas the westernmost beam points rather more meridionally, so L-shell angles range from 5◦to 63◦ over the field-of-view. The grey scale shows the den-sity of points, self-normalized and plotted on a linear scale.
Superimposed are the median (dots) and upper- and lower-quartiles (bars) of the distribution in bins with an L-shell angle 3◦wide. If the flow within these populations is
con-sistently of a similar magnitude and direction, then a cosine-dependence between vlosand φ should exist, and indeed, for
the main body of the echoes, this is the case. Within the radar arc (Fig. 9b), this cosine-dependence is found to be consis-tent with a flow speed of 150 m s−1and a flow direction of 0◦ (this cosine-dependence is represented by the dashed curves in Fig. 9), i.e. parallel to the auroral arc pair. Outside of the radar arc (Fig. 9a), the Doppler shifts are consistent with a flow speed of 260 m s−1and a flow direction of 332◦(solid curves). This relationship breaks down for φ < 30◦, though this represents only a very small proportion of the backscat-ter echoes. Some doubt can be cast on the exact velocities and angles deduced using this technique, especially as the measurements presented in Fig. 4 suggest that there is some variability in the line-of-sight Doppler shifts observed dur-ing this interval. However, the results suggest that only rela-tively low drift velocities (certainly less than the ion-acoustic speed) are present in the vicinity of the arc system. Poleward of this, the background flow is again relatively low, though as we saw earlier, irregular patches of high Doppler shift echoes are observed superimposed upon this.
4 Discussion and conclusions
For a period of some two hours, an optical auroral feature is observed by an ASC located at Tj¨ornes, Iceland. At times, this feature takes the form of a single east-west aligned arc, though for the majority of the interval, a pair of parallel arcs, separated by approximately 30 km, is observed. Simultane-ous radar observations show that backscatter is associated with this arc system, appearing to be co-located with the gap between the arc-pair. In addition, other backscatter features are observed poleward of this, in regions where no auroral luminosity is present. However, the spectral characteristics of the radar arc are sufficiently different from the other re-gions of radar backscatter, suggesting that they are produced by different generating mechanisms.
As discussed in the Introduction, several mechanisms for the generation of arc-associated radar backscatter have been suggested by previous workers. One favoured mechanism posits that irregularities are produced in a region of high electric field adjacent to the arc (Greenwald et al., 1973). Indeed, a higher electric field is observed poleward of the arc, of the order of 13 mV m−1(as deduced from the fitted flow velocity of Fig. 9a), than within the arc itself, 8 mV m−1 (Fig. 9b). If the electric field was high enough then it might be expected that these irregularities are generated by the two-stream instability, but this requires a threshold of ∼20 mV m−1. Higher Doppler shift echoes, consistent with electric fields above the two-stream instability growth threshold, are observed some distance poleward of the arc system, but these are thought to originate through another mechanism that will be discussed below.
S. E. Milan et al.: E-region backscatter associated with auroral arcs 803
Fig. 8. Similar to Fig. 7, though only for the interval 02:30 to 03:03 UT, and concentrating on low Doppler shifts. Panels (d)–(f) show the backscatter characteristics of echoes which comprise the radar arc, whereas panels (a)–(c) show the characteristics of all other echoes.
An alternative mechanism for the generation of backscat-ter is the growth of the gradient drift instability in the hori-zontal electron density gradients associated with the arc, pro-duced by enhancement of the E-region by the arc electron precipitation (Balsley et al., 1973). In the westward electro-jet (eastward electron drift), the southward-directed convec-tion electric field favours the growth of gradient drift waves in southward-directed electron density gradients, i.e. on the northern side of the arc. This is indeed the situation observed when a single arc is present (e.g. 02:10 to 02:30 UT, Fig. 5). When multiple arcs appear, the luminosity is highly struc-tured (see, for instance, Fig. 2b), and presumably short scale-length electron density gradients, suitable for the generation of irregularities, abound.
Auroral arcs are generally associated with an upward
field-aligned current (FAC), carried by the precipitating electrons, which produce the auroral luminosity, and current closure is achieved through an adjacent downward FAC sheet. We show in Fig. 10 a schematic of the FAC structure that we envisage being associated with our observations. The auro-ral luminosity is produced within a region of upward FACs with the arc pair being produced by filamentary FACs within this region; such an instance of parallel arcs present within a single upward FAC region has been observed by Janhunen et al. (2000). A broad region of downward FAC lies pole-ward of this, with the FAC being carried by thermally up-welling electrons. These upup-welling electrons produce a de-pletion of the E-region electron density, and if the downward FAC is filamentary, in the same way that the upward FAC appears to be, then this can also provide electron density
gra-Fig. 9. The density of echoes in φ − vlosspace for (b) the echoes which comprise the radar arc and (a) all other echoes. The grey scale shows the density of echoes on a linear scale, self-normalized. The dots and bars show the median and upper- and lower-quartiles of the distributions in 3◦wide bins of L-shell angle. The dashed and solid curves show the vloscosine dependence on φ expected for flows of (i) 150 m s−1aligned eastwards along the local L-shell and (ii) 260 m s−1oriented at 28◦clockwise from the L-shell direction, respectively.
dients that generate gradient drift waves, thus giving rise to the backscatter regions observed poleward of the radar arc. The main body of backscatter echoes associated with this region have Doppler shifts that are consistent with an elec-tric field below the threshold that is necessary for the excita-tion of the two-stream instability (see above). However, spo-radic regions have higher Doppler shifts in excess of the
ion-Downward FAC
Upwelling thermal electrons Low electron density Higher electric field (~13 mV m-1)
Low power, broad echoes
Upward FAC
Precipitating electrons Visual arcs High electron density Lower electric field (~8 mV m-1) Radar arc: high power, narrow echoes
260 m s
-1
150 m s
-1Fig. 10. A schematic showing our suggestion of the FAC system associated with the radar backscatter and visual arcs. The radar arc and visual arcs are confined to a region of upward FAC (dark grey region), adjacent to a broader region of downward FAC lying to the north (light grey region). Also indicated is the approximate electron drift vector within the two regions, deduced from the beam-swinging analysis.
acoustic speed. Villain et al. (1987, 1990) argued that the up-welling electrons that carry downward FACs could feed en-ergy into the two-stream or electrostatic ion cyclotron insta-bilities, producing the growth of waves with Doppler shifts exceeding the ion-acoustic speed, in regions of low back-ground electric field. Milan et al. (2001) employed this argu-ment to explain the appearance of high Doppler shift echoes superimposed on regions of low Doppler shift flow adjacent to an auroral arc, and a similar situation appears to apply in the present case.
Clearly, the exact relationship between radar backscatter and auroral FACs is still an open question. However, there is no doubt that FACs control the generation of E-region ir-regularities through one mechanism or another: they are as-sociated with field-parallel particle motions, which can feed energy into instability growth; these field-parallel motions produce modification of the ionosphere and structure the E-region electron density, giving rise to the horizontal elec-tron density gradients which seed the gradient-drift instabil-ity; they are responsible for the transfer of momentum from the magnetosphere to the ionosphere, i.e. is they are present
S. E. Milan et al.: E-region backscatter associated with auroral arcs 805 wherever strong or divergent horizontal electric fields exist
in the ionosphere. Optical observations, while instructive, do not give an unambiguous identification of the locations of FACs. Low altitude satellite measurements of the parti-cle and/or magnetic field signatures of FACs should, on the other hand, allow for the role of FACs in the excitation of E-region instabilities to be investigated in detail. In the future, we intend to compare the comprehensive DMSP and FAST data sets with SuperDARN observations in order to extend our understanding of the factors which govern the growth of ionospheric irregularities in the E-region, and to character-ize the spectral properties of coherent backscatter from these irregularities.
Acknowledgements. CUTLASS is supported by the Particle Physics and Astronomy Research Council (PPARC grant no. PPA/R/R/1997/00256), UK, the Swedish Institute for Space Physics, Uppsala, and the Finnish Meteorological Institute, Helsinki. The optical auroral observation project in Iceland was supported by Grant in Aid for Overseas Science Survey (grant no. A: 11304029) from the Japanese Society for the Promo-tion of Science (JSPS). SEM was supported by the Particle Physics and Astronomy Research Council (PPARC), UK, grant no. PPA/G/0/1999/00181.
The Editor in Chief thanks a referee for his help in evaluating this paper.
References
Balsley, B. B., Ecklund, W. L., and Greenwald, R. A.: VHF Doppler spectra of radar echoes associated with a visual auroral form: observations and implications, J. Geophys. Res., 78, 1681–1687, 1973.
Bates, H. F.: Some effects of dense ES clouds on high lati-tude backscatter observations, J. Geophys. Res., 70, 5895–5905, 1965.
Greenwald, R. A., Ecklund, W. L., and Balsley, B. B.: Auroral cur-rents, irregularities, and luminosity, J. Geophys. Res., 78, 8193– 8203, 1973.
Greenwald, R. A., Ecklund, W. L., and Balsley, B. B.: Radar ob-servations of auroral electrojet currents, J. Geophys. Res., 80, 3635–3641, 1975.
Greenwald, R. A., Baker, K. B., Dudeney, J. R., Pinnock, M., Jones, T. B., Thomas, E. C., Villain, J.-P., Cerisier, J.-C., Senior, C., Hanuise, C., Hunsucker, R. D., Sofko, G., Koehler, J., Nielsen, E., Pellinen, R., Walker, A. D. M., Sato, N., and Yamagishi, H.: DARN/SuperDARN: A global view of the dynamics of high-latitude convection, Space Sci. Rev., 71, 761–796, 1995. Hanuise, C., Villain, J.-P., Cerisier, J.-C., Senior, C., Ruohoniemi,
J. M., Greenwald, R. A., and Baker, K. B.: Statistical study of high-latitude E-region Doppler spectra obtained with the SHERPA HF radar, Ann. Geophysicae, 9, 273–285, 1991. Hanuise, C., Villain, J.-P., Gresillon, D., Cabrit, B., Greenwald,
R. A., and Baker, K. B.: Interpretation of HF radar ionospheric Doppler spectra by collective wave scattering theory, Ann. Geo-physicae, 11, 29–39, 1993.
Holzworth, R. H. and Meng, C.-I.: Mathematical representation of the auroral oval, Geophys. Res. Lett., 2, 377–380, 1975.
Hunsucker, R. D., Romick, G. J., Ecklund, W.-L., Greenwald, R. A., Balsley, B. B., and Tsunoda, R. T.: Structure and dynamics of ionization and auroral luminosity during the auroral events of 16 March 1972, near Chatanika, Alaska, Radio Sci., 10, 813–825, 1975.
Janhunen, P., Olsson, A., Amm, O., and Kauristie, K.: Characteris-tics of a stable arc based on FAST and MIRACLE observations, Ann. Geophysicae, 18, 152–160, 2000.
Milan, S. E., Jones, T. B., Robinson, T. R., Thomas, E. C., and Yeoman, T. K.: Interferometric evidence for the observation of ground backscatter originating behind the CUTLASS coherent HF radars, Ann. Geophysicae, 15, 29–39, 1997a.
Milan, S. E., Yeoman, T. K., Lester, M., Thomas, E. C., and Jones, T. B.: Initial backscatter occurrence statistics from the CUT-LASS HF radars, Ann. Geophysicae, 15, 703–718, 1997b. Milan, S. E. and Lester, M.: Simultaneous observations at
differ-ent altitudes of ionospheric backscatter in the eastward electrojet, Ann. Geophysicae, 16, 55–68, 1998.
Milan, S. E. and Lester, M.: Spectral and flow angle characteristics of backscatter from decametre irregularities in the auroral elec-trojets, Adv. Space Res., 23, 1773–1776, 1999.
Milan, S. E., Lester, M., Sato, N., Takizawa, H., and Villain, J.-P.: Investigation of the relationship between optical auroral forms and HF radar E-region backscatter, Ann. Geophysicae, 18, 608– 617, 2000.
Milan, S. E. and Lester, M.: A classification of spectral populations observed in HF radar backscatter from the E-region electrojets, Ann. Geophysicae, 19, 189–204, 2001.
Milan, S. E., Lester, M., Sato, N., and Takizawa, H.: On the al-titude dependence of the spectral characteristics of decametre-wavelength E-region backscatter and the relationship with opti-cal auroral forms, Ann. Geophysicae, 19, 205–217, 2001. Romick, G. J., Ecklund, W. L., Greenwald, R. A., Balsley, B. B.,
and Imhof, W. L.: The interrelationship between the > 130 keV electron trapping boundary, the VHF radar backscatter, and the visual aurora, J. Geophys. Res., 79, 2439–2443, 1974.
Tsunoda, R. T. and Fremouw, E. J.: Radar auroral substorm signa-tures, 1. Expansion and recovery phases, J. Geophys. Res., 81, 6148–6158, 1976a.
Tsunoda, R. T. and Fremouw, E. J.: Radar auroral substorm sig-natures, 2. East-west motions, J. Geophys. Res., 81, 6159–6168, 1976b.
Tsunoda, R. T., Presnell, R. I., and Leadabrand, R. L.: Radar auroral echo characteristics as seen by a 398-MHz phased array radar operated at Homer, Alaska, J. Geophys. Res., 79, 4709–4724, 1974.
Tsunoda, R. T., Presnell, R. I., Kamide, Y., and Akasofu, S. I.: Re-lationship of radar aurora, visual aurora, and auroral electrojets in the vening sector, J. Geophys. Res., 81, 6005–6015, 1976. Villain, J.-P., Greenwald, R. A., Baker, K. B., and Ruohoniemi,
J. M.: HF radar observations of E-region plasma irregularities produced by oblique electron streaming, J. Geophys. Res., 92, 12 327–12 342, 1987.
Villain, J.-P., Hanuise, C., Greenwald, R. A., Baker, K. B., and Ruohoniemi, J. M.: Obliquely propagating ion acoustic waves in the auroral E-region: Further evidence of irregularity produc-tion by field-aligned electron streaming, J. Geophys. Res., 95, 7833–7846, 1990.