Development of Multimodal Spectroscopy for the Detection of
Vulnerable Atherosclerotic Plaques
by
Obrad R. S6epanovid
Submitted to the Department of Electrical Engineering and Computer Science
in partial fulfillment of the requirements for the degree of
Doctor of Philosophy in Electrical Engineering and Computer Science
at the
MASSACHUSETTS INSTITUTE OF TECHNOLOGY
June 2008
@
Massachusetts Institute of Technology 2008. All rights reserved.
Author .. ...
...
.
...
•-
- ...
.
...
Department of ilectrical Engineering and Computer Science
May 14, 2008
Certified by.
Accepted by...
MASSACHUSETTS INSTITUTE. OF TECHNOLOGYJUL 0 1
2008
Michael S. Feld
Professor of Physics and Director of G. R. Harrison Spectroscopy Laboratory
Thesis Supervisor
Terry P. Orlando
Chairman, Department Committee on Graduate Students
Development of Multimodal Spectroscopy for the Detection of Vulnerable
Atherosclerotic Plaques
by
Obrad R. S6epanovid
Submitted to the Department of Electrical Engineering and Computer Science on May 14, 2008, in partial fulfillment of the
requirements for the degree of
Doctor of Philosophy in Electrical Engineering and Computer Science
Abstract
The combination of reflectance, fluorescence, and Raman spectroscopy -which is termed multimodal spectroscopy (MMS) -provides complementary and depth-sensitive information about tissue com-position. As such, MMS can provide biochemical and morphological information useful in detecting vulnerable atherosclerotic plaques, that is, plaques most prone to rupture and causing sudden death. Early detection of these vulnerable plaques is critical to reducing patient mortality associated with cardiovascular disease. In developing MMS into a clinical diagnostic modality, several scientific and engineering directions are explored in this work: the physical motivation for MMS, the frame-work of quantitative extraction of spectral parameters, the spectral probes that enable the efficient
collection of data, a clinical instrument able to provide real-time diagnosis, and, finally, a clinical implementation of the entire methodology. The motivation for MMS is shown through a pilot in vitro study using carotid artery specimens, which shows the promise for MMS to detect features of vulnerable plaque. Having established the motivation, the next step describes the mathematical tools used to extract quantitative spectral parameters and, moreover, to assess the uncertainty and confidence of the spectral information. In order to implement MMS, the development of an efficient, specialized MMS probe for data acquisition and a compact and practical clinical MMS instrument are described. Lastly, in vivo and ex vivo results from a relatively large clinical study of vulnerable plaque in humans show excellent agreement between MMS and histopathology. Specifically, MMS is shown to have the ability to detect a thin fibrous cap, necrotic core or superficial foam cells, and thrombus. In addition, these studies show that vulnerable plaques could be detected with a cross validated sensitivity of 89-96%, specificity of 72-78%, and a negative predictive value of 89-97%. These very encouraging results serve as an important step in bringing MMS into the clinical arena
as a powerful diagnostic technique.
Acknowledgments
This research and achievements would not have been possible without the help and support of my advisors, colleagues, friends, and family.
First and foremost, I am indebted to my advisor, Prof. Michael Feld, for his vision, guidance, and for never avoiding to ask the hard questions. Michael, thank you for pushing me when I needed it and, at other times, for giving me the space to work things out on my own. You really are a true believer in spectroscopy and I will buy a used car from you any day. I would also like to thank Dr. Ramachandra Dasari for teaching me how to deal with technical problems and how to negotiate. Ramachandra, thank you for always having your office door open when I needed to talk. I thank the members of my thesis committee, Prof. Roger Mark, Prof. George Verghese, and Prof. Kamran Badizadegan, for providing helpful comments and insights that have strengthened my research. Prof. Mark, I also thank you for opening my eyes to leadership opportunities and pushing me to fully realize myself both in academic and extracurricular circles; you have been like a second father to me.
I thank all of my colleagues, past and present, at the Spec Lab for being supportive and helpful: George Angheloiu, Samir Awasthi, Ishan Barman, Kate Bechtel, Luis Galindo, Saumil Gandhi, Joseph Gardecki, Abigail Haka, Chae-Ryon Kong, Condon Lau, Sasha McGee, Jelena Mirkovi6, Jason Motz, Jonathan Nazemi, Wei-Chuan Shih, Gajendra Singh, and Zoya Volynskaya. Zoya, thanks for putting up with my eccentric personality for all these years and being a great office mate. Chae-Ryon, I owe you one for waking up at crazy hours to go to the hospital with me. Kate, thanks for rubbing off on me your perfection-oriented attitude about research and standards of quality. I am also grateful to Dr. Maryann Fitzmaurice for being a wonderful collaborator and teacher. Maryann, you taught me to how to make sense out of complicated data and never give
up hope. I thank Dr. Arnold Miller for enabling our clinical research and Dr. John Kramer for his clinical and scientific guidance. In addition, I thank all my friends for support, particularly my first lab partner, Ali Motamedi. Babba, it all started with the "giant laser" and you've been my older brother ever since.
My brother, Danilo, has been my biggest inspiration of diligence and scientific pursuit. Brate, I'm not just thanking you for fig2num2.m or endnoteToBib.m or logistic regression, but your entire attitude toward learning which truly motivated me. I thank my best friend, Sourav Dey, for teaching me math and using his energy to excite me about research. Suresh, it all started when we went to India together and I wouldn't have gotten through grad school without you; sorry I Indoed you about Utah. My girlfriend, Azra Pravdid, has been my confidant and pillar of support through the thick and thin of grad school, life, and love. Maleno, thanks for always being there for me.
Finally, I thank my whole family and especially my loving parents, Bojana and Ranko, for supporting me fully in all of my life pursuits.
Funding for this work has been generously provided by the National Institutes of Health and the Lester Wolfe fellowship.
Contents
1 Introduction 1.1 Disease diagnosis ... 1.1.1 Atherosclerosis ... 1.1.2 Vulnerable plaque ... 1.1.3 Competing technologies .. . 1.2 Optical properties and spectroscopy1.2.1 Reflectance ... 1.2.2 Fluorescence .... 1.2.3 Raman scattering.. 1.3 MMS... 1.3.1 Complementarity . 1.3.2 Depth sensing.... 1.4 Data analysis ...
1.5 Instrumentation and probes
27 . . .. . . .. . . .. 27 . . . .. . . .. . . . 27 . . .. . . .. . . .. 30 . .. . . .. . . .. 3 1 . . . . . 36 . . .. . . .. . . .. 36 . .. . . .. . . .. .. 37 . . . .. . . .. .. 38 . . . .. . . .. . . . . 39 . .. . . ... . . . 39 . . . .. . . .. .. . . 40
1.5.1 Reflectance/fluorescence instrumentation and probes . 1.5.2 Raman instrumentation and probes . . . . 1.6 Clinical work ... ... . . . .. .. . . . . 41 . . . . . 44 . . . . . 44 . . . . . 45 . . . . .. . . . 46
1.6.1 1.6.2 1.7 Thesis
Reflectance and fluorescence of arterial Raman spectroscopy of arterial tissue outline . ... tissue . . . . 2 Pilot MMS study 2.1 Introduction ... 2.2 Methods ... 2.2.1 Depth sensing 2.2.2 Tissue study 2.3 Results ... 2.3.1 Depth sensing 2.3.2 Tissue study 2.3.3 Error analysis 2.4 Discussion ... 2.4.1 Intraplaque hemorrhage . . . 2.4.2 Foam cells ...
2.4.3 Thin fibrous cap ...
9244 Necrntic core
2.5 2.6
2.7
2.8
2.4.5 Identifying vulnerable plaques . ... Summary ...
Addendum 1: Detecting fibrous cap thickness revisited . Addendum 2: Freeze/thaw effects on tissue spectroscopy Acknowledgements . ...
3 Data and uncertainty analysis 73
3.1 Linear fitting- IFS and Raman ... . 73
3.1.1 Introduction . . .. .. . . . .. .. . . . . .. . . . . .. . .. .. .. . . . . 73 3.1.2 Theory . . . .. . . 75 3.1.3 Methods ... ... . 82 3.1.4 R esults . . . 85 3.1.5 D iscussion . . . 91 3.2 Nonlinear fitting- DRS ... 98 3.2.1 T heory . . . 98
3.2.2 Results and Discussion ... 99
3.3 Relation between X2 and Ac ... 100
3.4 Summary ... ... 102
3.5 Acknowledgements ... 102
4 MMS probe development 103 4.1 Previous design - Raman probe ... ... 103
4.1.1 Overview ... .... ... . 103
4.1.2 Optical filters . . .. .. . . . .. . . .. . . . . .. . .. . . . . .. .. .. .. 104
4.1.3 Optical system design ... 105
4.1.4 Technical implementation ... 105
4.1.5 Probe performance ... ... 106
4.2 MMS probe design ... .... . ... 106
4.2.1 Optical fibers ... ... ... 107
4.2.3 Adhesives . . . . 4.3 Modeling modifications 4.3.1 DRS modeling 4.3.2 IFS modeling 4.4 Summary . . . . 4.5 Acknowledgements . . . 5 MMS instrumentation development 5.1 Previous instrumentation ...
5.1.1 Clinical Raman system ... 5.1.2 FastEEM system . . . . 5.2 MMS integrated instrumentation . 5.2.1 Sources ... 5.2.2 Coupling to probe . . . . . 5.2.3 Detection ... 5.2.4 Real-time software . . . . . 5.2.5 System calibration . . . . . 5.2.6 Data analysis . . . . 5.2.7 Safety . ... 5.2.8 Clinical layout . . . . 5.3 Summary . ... 5.4 Acknowledgements . . . ... 6 Clinical implementation of MMS 10 123 . . . .. .. . . . 124 . . . .. . . . 124 . . . .. .. . . . 126 . . . .. . . . 130 ... ... . 131 . . . .. .. . . . 131 ... ... . 132 . . . .. .. . . . 133 . . . .. .. . . . 135 . . . .. .. . . . 135 . . . .. .. . . . 137 . . . .. .. . . . 137 . . . .. .. . . . 138 . . . . . . . . . 139 141 109 109 110 118 121 121
6.1 Introduction ... 6.2 M ethods ...
6.2.1 In vivo spectral collection ...
6.2.2 Ex vivo spectral collection ...
6.2.3 MMS data analysis ... 6.2.4 Histological analysis ... 6.2.5 Diagnosis and classification ... 6.3 Results . . . .
6.3.1 In vivo vs. ex vivo ...
6.3.2 Spectroscopic information ... 6.3.3 Histological findings ... 6.3.4 Detecting calcified plaques ... 6.3.5 Detecting NC/SFCs ... 6.3.6 Detecting a TFC ... 6.3.7 Detecting thrombus ...
6.3.8 Detecting "early" vulnerable plaques 6.3.9 Detecting "all" vulnerable plaques . 6.4 Discussion ...
6.4.1 In vivo vs. ex vivo ...
6.4.2 Spectroscopic information ... 6.4.3 Detecting calcified plaques ... 6.4.4 Detecting NC/SFCs ... 6.4.5 Detecting a TFC ... . . . 14 1 . . . .. . . .. . . .142 . . . .. .. . . .. . . .142 . . . 145 . . . .. . . .. . . . .146 . . . 148 . . . . .151 . . . .. . . .. . . . .152 . . . . .. .. . . .. . . .152 . . . 152 . . . . .. . . .. . . .156 . . . . .. . . .. . . .157 . . . . .. . . .. . . .158 . . .. .. . . .. . . .159 . . . . .. . . .. . . .160 . . . 162 . . . . .164 . . .. . . .. . . .165 . . . 165 . .. . . .. . . .166 . . .. . . .. . . .166 . . . 167 . . . 168
6.4.6 Detecting thrombus ... 169
6.4.7 Detecting vulnerable plaques ... 169
6.4.8 Comparison to pilot study ... 171
6.5 Summary ... 173
6.6 Addendum: Ceroid, the unknown absorber? . . . . . . . 174
6.7 Acknowledgements ... 176
7 Accomplishments of this thesis 177 7.1 Diagnostic ability of MM S ... 177
7.2 Quantitative data analysis ... 177
7.3 Spectral probe development ... ... 178
7.4 Clinical instrumentation development ... ... 178
7.5 Clinical implementation of MMS ... 179
8 Future directions 181 8.1 Improving detection of VPs ... 181
8.1.1 Advanced classification ... 181
8.1.2 Thrombus and hemorrhage ... 182
8.1.3 SFC vs. NC ... ... 182
8.1.4 Raman background removal ... ... 183
8.2 Intravascular imaging ... 184
8.2.1 Side-viewing probe ... .. ... 184
8.2.2 Intravascular constraints ... ... 184
8.2.3 Circumferential imaging ... 185 12
8.3 M icroscopy techniques ... 186
A List of abbreviations 187 B Classification 191 B.1 Performance metrics ... 191
B.2 Logistic regression ... ... 193
B.3 Receiver operating characteristic (ROC) ... ... 195
B.4 Leave-one-out cross validation ... 197
C Timeline: 308 nm UV lamp 199 C.1 April 11, 2007 (1st iteration) ... 200 C.2 May 18, 2007 (2nd iteration) ... 201 C.3 Circa June 15, 2007 ... ... . 201 C.4 July 13, 2007 (3rd iteration) ... 201 C.5 September 5, 2007 ... ... 202 C.6 September 19, 2007 (4th iteration) ... 202 C.7 October 24, 2007 ... 202 C.8 December 6, 2007 (5th iteration) ... .. .... ... 202 C.9 December 18, 2007 ... 203 C.10 January 3, 2008 (6th iteration) ... 203
List of Figures
1-1 Morphologic features of a vulnerable carotid plaque. Thin fibrous cap (TFC), necrotic core (NC) and superficial foam cells (SFC) are indicated. Hematoxylin and eosin stain. The scale bar indicates a 1 mm length. ... 31
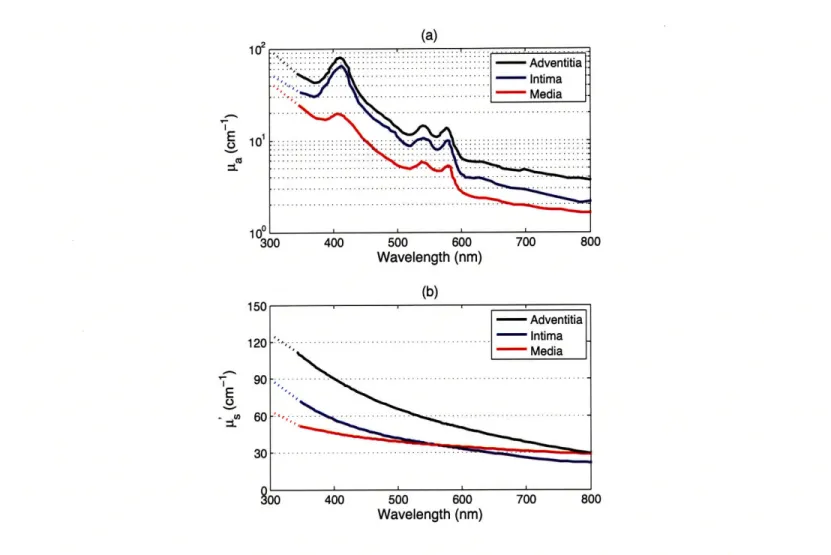
1-2 The optical properties of arterial tissue on 340-800 nm. Top graph in (a) shows the absorption coefficient /a and (b) shows the reduced scattering coefficient I4... .41
2-1 The sampling depth of light in aortic media as function of wavelength. The experi-mental values were obtained via transmission measurements of light through stacked slices of aortic media. The theoretical values were obtained using the values for -a and 1L' from Fig. 1-2 and Eqs. (2.1) and (2.2) ... . . . 56
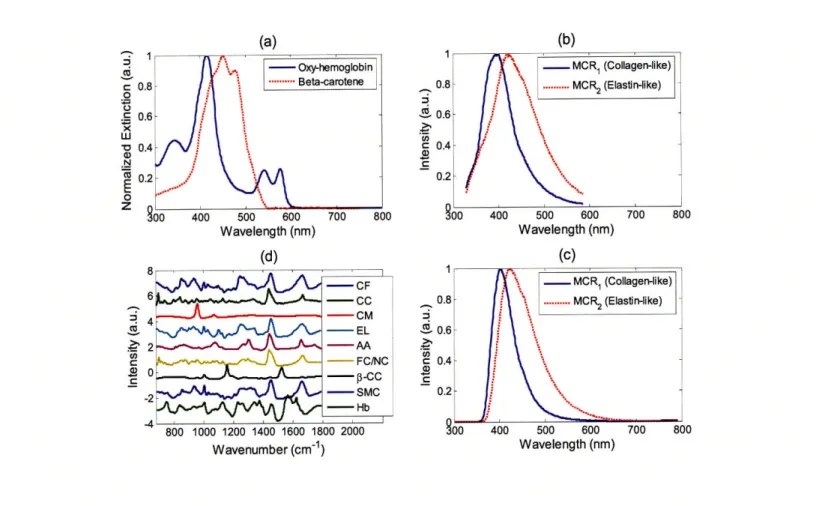
2-2 a) Extinction coefficients of oxy-hemoglobin and beta-carotene; b) MCR basis spectra components for IFS at 308 nm; c) MCR basis spectra components for IFS at 340 nm; d) Raman morphological model basis spectra. . ... 58
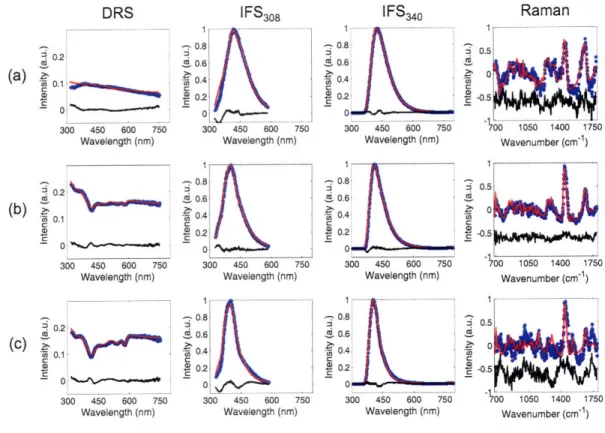
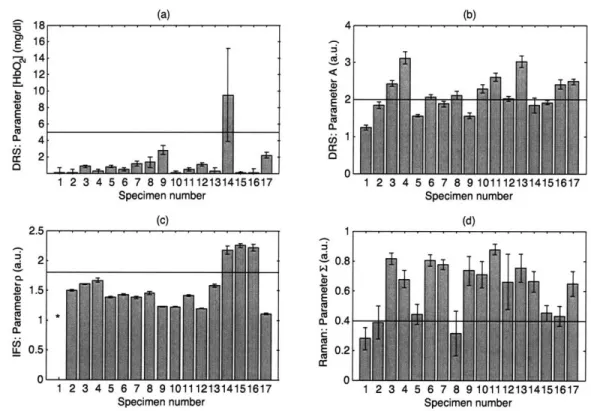
2-3 Representative spectra (dotted blue line), fits (solid red line), and residuals between the data and fit (solid black line) of the MMS modalities for three specimens with different pathologies: a) intimal fibroplasia; b) atherosclerotic plaque (not vulnera-ble); and, c) vulnerable atheromatous plaque. Note the progression of an increased presence of hemoglobin (420 nm absorption dip in DRS) for the three specimens. The IFS spectra for intimal fibroplasia are broader (characteristic of elastin) when compared to the more narrow spectra for the plaques (characteristic of collagen in the fibrous cap). The Raman spectrum of c) is noisy, due to the decreased signal intensity associated with hemoglobin absorption. . ... . 59 2-4 Spectral parameters for each of the 17 specimens: a) hemoglobin concentration
(mg/mL) obtained from DRS, used to detect intraplaque hemorrhage; b) scatter-ing parameter A (relative units) obtained from DRS, used to detect the presence of foam cells; c) p parameter (relative units) extracted from IFS340 and IFS30 8, used
to detect a thin fibrous cap (The value of p for specimen #1 (*) is undefined as C340 is within the error for this sample); and d) the E parameter (relative units) extracted from the Raman fit coefficients, used to obtain information about the presence of necrotic core. The error bars indicate one standard deviation. . ... 60 2-5 Photomicrographs of representative tissue sites: a) specimen #14, an ulcerated
vul-nerable plaque with acute intraplaque hemorrhage (insert; arrows indicate red blood cells) and hemoglobin fit contribution of 9.5 (mg/mL) (H&E; 4X); b) specimen #17 a vulnerable plaque with superficial foam cells (arrows) and scattering parameter A
> 2 (H&E; 20X); and c) specimen #9, a non-vulnerable plaque with deep foam cells (insert) and scattering parameter A < 2 (H&E; 4X). . ... 63 16
2-6 Simulated value of p as function of the thickness of the fibrous cap. The Monte Carlo simulation was run with two layers: top collagen-rich layer (variable thickness) and bottom collagen-free layer (semi-infinite). For each thickness of the top layer, a ratio of fluorescence (-420 nm emission) generated by 308 nm and 340 nm excitation was
calculated. ... 65
2-7 (a) Simulated value of R51 as function of the thickness of the fibrous cap, which should be compared to the one for p presented in Fig. 2-6. (b) The value of Ra1 computed for the 17 specimens, which should be compared to Fig. 2-4c. The error bars indicated one standard deviation. (The value of RC1 for specimens #1 and #2 (*) should be disregarded, as the two-layer model need not apply to intimal fibroplasia. Moreover, the value of R1' for specimen #1 is undefined, for the same
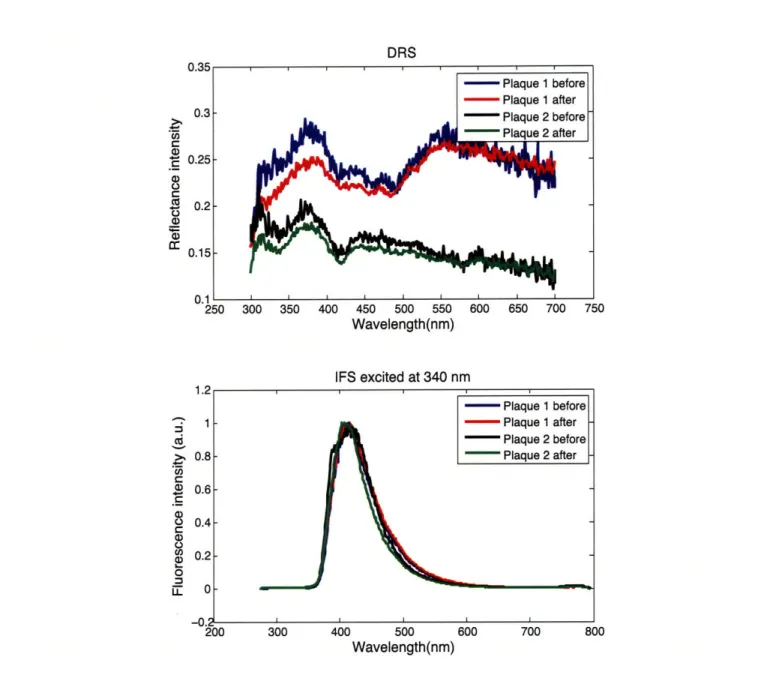
reasons as its p value.) ... 69 2-8 Freeze/thaw effects on DRS and IFS spectra of artery tissue. DRS (top) and IFS
(bottom) spectra from two ex vivo artery tissue locations were collected, the tissue was then snap-frozen in liquid nitrogen and kept in the freezer for 60 days, after which the samples were thawed and spectra collected again. . ... 71
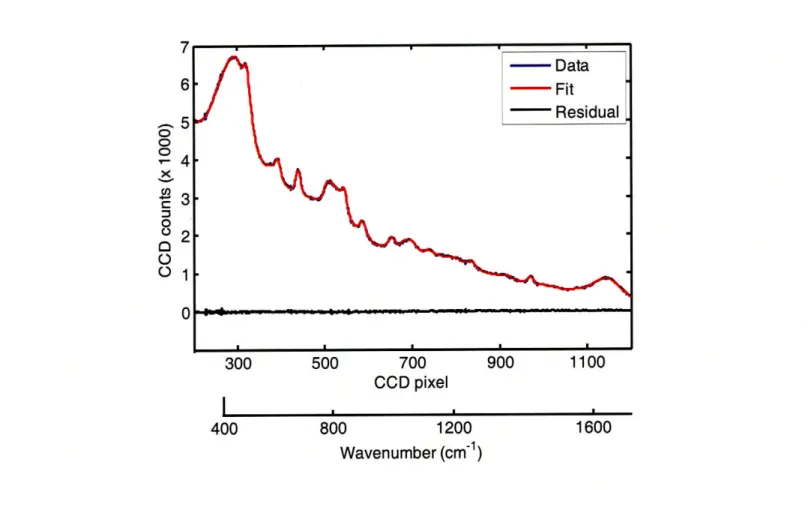
3-1 Constituent Raman spectra - glucose, creatinine, urea, water and cuvette - plotted as functions of wavelength (CCD pixel). The corresponding wavenumber scale is indicated below ... ... 84 3-2 Representative data spectrum (blue), the least squares fit (red) and the residual
be-tween the data and the fit (black) obtained from a mixture solution. Spectral fitting is performed in the wavelength (CCD pixel) domain; the corresponding wavenumber scale is indicated below. ... ... 86
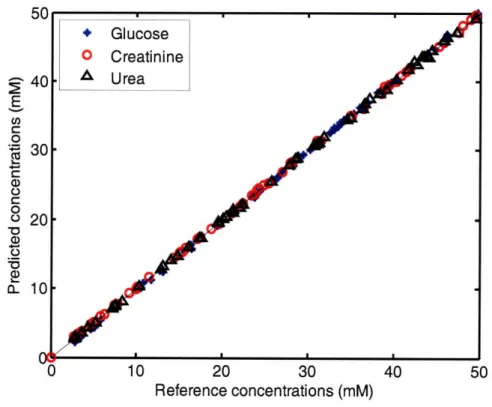
3-3 Predicted concentrations using Eq. 3.5 versus the reference concentrations for the three analytes. The predicted concentrations closely follow the reference
concentra-tions ... 87
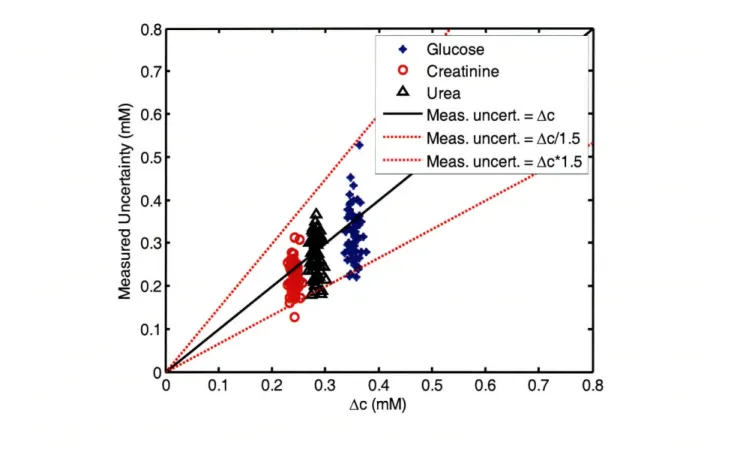
3-4 Measured uncertainty (standard deviation from repeated measurements) vs. uncer-tainty calculated by the analytic formula, Ac, for the three analytes. The dotted lines indicate the region for which the measured uncertainty is within a factor of 1.5 of A c. . . . .. 88
3-5 (a) Representative experimental Raman spectrum (blue), the least squares fit (red), and the residual between the data and the fit (black), obtained from a calcified carotid artery plaque in 0.25 seconds. (b) Diagnostic algorithm, showing several representative Raman artery spectra including the spectrum above (see text for details). The error bars in the two dimensions are calculated using the Ac equation.
(CP = calcified plaque, NCP = non-calcified plaque, IF = intimal fibroplasia.) . . . 89
3-6 The diagnostic probability distributions for the solid and open square from Fig. 3-5b. The mean of each bivariate Gaussian distribution is specified by the fit coefficients while the covariance is specified by the relevant elements of Eq. (3.6). . ... 94
3-7 Uncertainty analysis example in for nonlinear measurements (DRS). The blue noisy simulated data is calculated from the nonlinear DRS model that takes inputs (A, B, C, [HbO2], [3 - car]) with the given true coefficients ("Original"). The extracted fit
coefficients are given in "FC" with the uncertainty associated with each estimate in "Error"... ... ... 100 18
4-1 The schematic of the MMS probe, with the side view of the left and a cross sectional view on the right. The single central excitation fiber (200 Am diameter, 0.22 NA) is optically isolated from the 15 collection fibers, 10 of which (200 Am diameter, 0.26 NA) are used for Raman spectra collection and 5 of which (200 Am diameter, 0.22 NA) are used for DRS and IFS collection. The probe tip contains a filter module to appropriately filter the excitation and collection fibers and a sapphire ball lens to optim ize collection ... ... 107 4-2 The filter characteristics of the MMS probe. The excitation fiber light is filtered by
a shortpass filter that transmits 300-830 nm light and blocks light > 850 nm. The collection fiber tube contains a notch filter that transmits 300-800 nm and 850-1000 nm while blocking light around the Raman laserline (830 nm). . ... 108 4-3 The probe calibration procedure. First, a calibration set of tissue phantoms is used
to determine the probe-specific parameters, rd and r,. Then, these probe-specific parameters are used prospectively on tissue spectra to accurately extract A8 and Aa. 112 4-4 The A' and [a values for the five phantoms mixed in the proportions described in
Table 4.1 ... ... 113 4-5 The experimental DRS spectra for phantoms 1-4 (blue), the best fits using a lookup
table with Eq. (4.2) (red), and best fits using Eq. (4.3) (black). ... 116 4-6 A prospective lookup table calculated using Eq. (4.2) for various values of ju' and ia
while keeping rd = 0.45 mm and rc = 0.30 mm ... 117
4-7 The optimal probe-specific parameters S and 1, for each phantom, that resulted in the calculated IFS spectrum (using Eq. (4.8)) being closest to the measured IFS spectrum (phantom 5) ... ... . 120
5-1 Schematic diagram of the clinical Raman system (CL: Cylindrical Lens; BP: 830 nm Band-Pass filter; M: Mirror; MO: Microscope Objective; CCD: Charge-Coupled Device detector). ... ... 125
5-2 Schematic diagram of the FastEEM clinical spectrophotometer. L1, L2, L3, L4 are lenses. M1 and M2 are mirrors. (Published with permission from: Instrumentation for multi-modal spectroscopic diagnosis of epithelial dysplasia, Technology in Cancer
Research & Treatment, Volume 2, page 509, 2003, Adenine Press; http://www.tcrt.org) 127
5-3 Schematic diagram of the MMS instrument. BF = bandpass filter, LF = longpass filter, S = shutter, FL = focusing lens, OF = optical fiber, FS = fiber switch, SP1 =
visible spectrograph, SP2 = NIR spectrograph, iCCD = intensified charge-coupled device, XTE CCD = thermoelectrically cooled charge-coupled device. ... 130
5-4 Control flow of the MMS instrument software ... 134
5-5 The layout of the MMS instrument (left) and a photo of the actual system (right). . 138
6-1 In vivo data collection during a carotid endarterectomy surgery. The surgeon is holding the sterilized MMS probe in contact with the exposed carotid artery plaque, moments before data acquisition. ... 144
6-2 An excised carotid artery plaque with ink dots demarcating spectral evaluation sites. 146 20
6-3 Photomicrographs of representative tissue sites: a) intimal fibroplasia (H&E; 10X; in-timal thickness indicated by arrows); b) atherosclerotic plaque with thick fibrous cap (H&E; 10X; fibrous cap thickness indicated by arrows); c) thin fibrous cap atheroma (H&E; 10X; fibrous cap thickness indicated by arrows); d) ulcerated thin fibrous cap atheroma, with thrombus (short arrow) and acute intralesional hemorrhage (long ar-row) (H&E; 4X); e) acute intralesional hemorrhage (H&E; 40X); f) superficial foam cells 3+ grade (H&E; 40X). ... 150
6-4 A comparison between in vivo and ex vivo data collected from approximately the same locations on a carotid artery atherosclerotic plaque for (a) DRS, (b) fluores-cence, and (c) Raman spectra... ... 153
6-5 (a) Absorption coefficients used to model the tissue absorbers for DRS modeling; (b) representative data and fit for DRS; (c) basis spectra, obtained through MCR, used to model IFS spectra; (d) representative data and fit for IFS; (e) Raman morphological basis spectra; (f) representative data and fit for Raman. The representative spectra in (b), (d), and (f) are collected ex vivo from the same tissue location, a carotid artery calcified atheromatous plaque. The residuals in (b) and (f) are offset from zero for clarity. ... 155
6-6 Box plot associated with the diagnostic algorithm (left) and ROC curve (right) for detecting calcified plaques using the Raman CM contribution. The chosen point on the ROC curve, represented by the decision threshold line on the left panel, indicates a sensitivity of 81% and a specificity of 93%. Area under the ROC curve = 0.955. . 157
6-7 Diagnostic algorithm (left) and ROC curve (right) for detecting the presence of necrotic core and/or superficial foam cells using DRS
0-carotene
and RamanE.
The chosen point on the ROC curve, specified by the given decision line (left), indicates a sensitivity of 80% and a specificity of 81%. Area under the ROC curve = 0.865. . 1586-8 Diagnostic algorithm (left) and ROC curve (right) for detecting the presence of a thin fibrous cap (< 65
pm)
using IFS Rc and IFS CE. The chosen point on the ROC curve indicates a sensitivity of 91% and a specificity of 62%. Area under the ROC curve - 0.851. ... ... 1596-9 a) Raman basis spectrum of a thrombus; b) Raman spectrum of a thrombotic carotid plaque that was fit using the standard Raman morphological model basis spectra; c) Raman spectrum of the same thrombotic plaque fit using the standard Raman model plus the thrombus basis spectrum given in a). . ... 161
6-10 Diagnostic algorithm (left) and ROC curve (right) for detecting the presence of a thrombus using the Raman thrombus contribution. The chosen point on the ROC curve indicates a sensitivity of 31% and a specificity of 97%. Area under the ROC curve - 0.661. ... ... 162
6-11 Spectroscopic algorithm for the detection of "early" vulnerable plaques. The output of the algorithm classifies a plaques as vulnerable if both of the individual spectro-scopic algorithms for TFC andSFC/NC return positive. . ... 163
6-12 ROC curve for the combined algorithm (left) for the detection of "early" vulnerable plaques, and the decision chart (right) for the particular operating point indicated on the ROC. Area under the ROC curve = 0.886. ... . 163 22
6-13 Spectroscopic algorithm for the detection of "all" vulnerable plaques. The output of the algorithm classifies a plaques as vulnerable if either the individual spectroscopic algorithms for TFC andSFC/NC return positive orif the spectroscopic algorithm for thrombus returns positive ... 164 6-14 ROC curve for the combined algorithm (left) for the detection of "all" vulnerable
plaques, and the decision chart (right) for the particular operating point indicated on the ROC. Area under the ROC curve = 0.901. ... . 165 6-15 (a) Absorption coefficients used to model the tissue absorbers for DRS modeling,
including ceroid; (b) DRS data and fit from Fig. 6-5b, where modeling does not include ceroid; (c) DRS data from Fig. 6-5b and fit, where modeling includes ceroid. The residuals in (b) and (c) are offset from zero for clarity. . ... 175
8-1 A schematic of the side-viewing probe (top) that could be introduced via sheath (bottom) for intravascular use ... ... 185
B-1 Binary classifier plot that visually defines the relevant terms: sensitivity, specificity, positive predictive value (PPV) and negative predictive value (NPV). ... 192
C-1 Photograph of the 308 nm UV lamp by UV Solutions, Inc. The lamp consists of two units: 1) a power supply and control box, and 2) a gas chamber that produces the
List of Tables
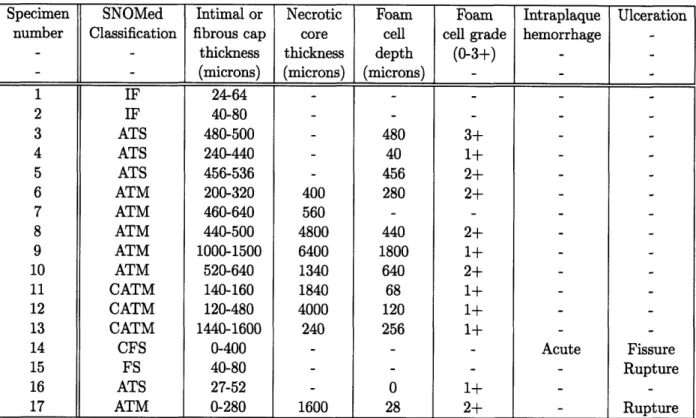
2.1 Morphological features of the 17 specimens. IF = intimal fibroplasia, ATS = atheroscle-rotic plaque, ATM = atheromatous plaque, FS = fibrotic-sclerotic plaque, C = calcified. 57
3.1 Necessary parameters for calculating uncertainty using Eq. (3.8). The constituent glucose, creatinine and urea spectra were measured at 53 mM concentration. The only value that varies from sample to sample is a. The value of a in the representative spectrum of Fig. 3-2 is 14.9 ... ... 87
4.1 The mixture of beads, hemoglobin solution and deionized water that resulted in the five phantoms used to calibrate DRS probe-specific parameters. The volume of beads indicate amount of 1% solids solution and the volume of hemoglobin indicate amount of 8 mg/ml stock solution ... .... ... 113
6.1 Vulnerable plaque index. The vulnerability of a particular plaque is determined by summing the scores of the individual morphological features determined to be present histologically. *Feature by itself indicates a vulnerable plaque. "Applies
Chapter 1
Introduction
In this work, we propose a minimally-invasive spectroscopic approach to disease diagnosis, particu-larly to the detection of vulnerable atherosclerotic plaques. The spectroscopic approach utilizes the information provided by different spectral modalities, together with robust interpretation of data, and the development of appropriate instrumentation and probes that demonstrate the clinical via-bility of the methodology.
E 1.1
Disease diagnosis
Spectroscopy provides a powerful means to obtaining quantitative chemical and morphological information about tissue that is critical to disease diagnosis. To illustrate the methodology in this work, we will focus on the application of diagnosing atherosclerosis and, more specifically, detecting vulnerable plaques. However, the ideas, technology, and methods are more generally applicable to studying the progression and severity of other diseases such as cancer.
N
1.1.1 Atherosclerosis
Significance
Cardiovascular disease is the leading cause of death in the nation despite significant resources allocated for improved diagnosis and treatment. The current prevalence of cardiovascular disease
in the United States is 79.4 million. Mortality due to cardiovascular diseases represented 36.3% of total mortality in 2004, a number almost double that of cancer, the second leading cause of death. The direct and indirects costs associated with cardiovascular disease were estimated to be $432 billion in 2007 [1] and continue to rise. It is predicted that by 2020 cardiovascular disease will surpass infectious disease to become the leading cause of death worldwide [2].
Atherosclerosis accounts for the vast majority of cardiovascular morbidity and mortality. It is a systemic disease, but the most common sites are the coronary, carotid and superficial femoral ar-teries and subrenal aorta. Atherosclerotic coronary artery disease (CAD) accounts for the majority of acute ischemic coronary syndromes, such as sudden cardiac death, acute myocardial infarction and unstable angina. As such, it is responsible for approximately 450,000 deaths per year, which translates into one American dying of myocardial infarction caused by CAD every minute [1]. In addition, atherosclerosis involving the carotid and femoral arteries is also a major cause of stroke, accounting for 270,000 deaths in 2002, and peripheral vascular disease such as gangrene, respectively
[1].
Anatomy
Three concentric layers comprise the artery wall: the intima, media, and adventitia. In normal ar-teries, the intima measures between 50 and 300 pm in thickness and is composed of endothelial cells threaded with collagen and elastin fibers, and some proteoglycans. The endothelium bounds the arterial lumen and furnishes several functions, which include providing a smooth surface for blood flow, producing extracellular matrix components, expressing factors which inhibit blood coagula-tion, and controlling the passage of materials into and out of the bloodstream [3]. It is endothelial
dysfunction, or the loss of proper endothelial function, that ultimately leads to atherosclerosis. In 28
a diseased artery, the intima produces an extracellular network of fibrillar proteins that comprise a fibrous cap, which is predominantly composed of collagen. The dense internal elastic lamina separates the intima from the media. The media of large elastic arteries, such as the aorta and carotids, is primarily composed of elastin fibers and some smooth muscle cells, which enable these vessels to to respond to highly pulsatile blood flow. In medium-sized muscular arteries, which include coronaries, the media contains more smooth muscle cells that control blood flow through vasoconstriction and vasodilation. The media and adventitia are separated by the external elas-tic lamina. The outermost adventitial layer contains a network of connective tissue along with
adipocytes, nerve fibers, and vasa vasorum in the case of larger vessels.
Pathology
In atherosclerosis, arterial luminal obstruction is caused by the development of plaque, which typi-cally progresses slowly over several decades. The initial phases of plaque formation are characterized by lipoprotein infiltration of the intima, followed by recruitment of leukocytes, especially mono-cytes, on the luminal surface of the dysfunctional endothelium, and migration of these cells to the intima through the mediation of cytokines such as monocyte chemoattractant protein-1. Once inside the intima, the monocytes engulf lipoproteins, express scavenger A and CD36 receptors that accelerate the process of lipid endocytosis, and turn into foam cells (FC) under the influence of mediators such as macrophage colony-stimulating factor [4]. Simultaneously, smooth muscle cells (SMC) migrate from the media to the intima and proliferate locally, while FCs are degraded by apoptosis, contributing to the formation of a necrotic core (NC) [5]. Smooth muscle cells subse-quently lay down elements of the extracellular matrix such as collagen and proteoglycans, which form a fibrous cap covering the NC. A balance between the production and degradation of collagen
in the fibrous cap is regulated by molecules such as INF-y and matrix metalloproteinases (MMP-1, -2, -8, -9, -13) [6]. Under certain circumstances collagen breakdown prevails, followed by thinning, fissuring and eventual rupture of the fibrous cap. In addition, the plaque can undergo dystrophic mineralization through the deposition of calcium salts [7].
0
1.1.2 Vulnerable plaque
The severity of atherosclerotic lesions has traditionally been assessed by imaging their location and percentage of intraluminal stenosis. However, landmark studies over the past 10 years have shown that up to 70% of acute cardiac ischemic events results from the rupture of previously sub-symptomatic lesions, ending in thrombotic occlusion and, often, myocardial infarction [8, 9]. The vast majority of these thrombosed coronary artery plaques exhibit less than 75% stenosis [10], the figure often used to define a clinically significant lesion. Thus, plaques that are not critically
stenotic can still cause acute ischemic events [11, 12].
These vulnerable plaques (also known as culprit or unstable plaques) often exhibit rupture of a so-called thin cap fibrous atheroma: i.e. a plaque with a thin (< 65 pm) fibrous cap overlying a large (> 2 mm) necrotic core [10]. A recent consensus paper by cardiovascular pathologists [13, 14] has reported that additional morphological features may be associated with thrombosis, such as erosion or denudation of the intimal endothelial layer. In both ruptured and eroded plaques, the fibrous cap [9, 10] or superficial intima [12] is frequently infiltrated by inflammatory cells, most often macrophages and foam cells. Exposed calcifications [10] and acute intraplaque hemorrhage or dissection [9, 15, 16] are other common features of thrombosed plaques. In addition, the presence of a non-occlusive intraluminal thrombus from a previous plaque rupture is another feature of vulnerability as it leaves the plaque prone to subsequent thrombosis [17, 13]. Figure 1-1 shows the
Figure 1-1. Morphologic features of a vulnerable carotid plaque. Thin fibrous cap (TFC), necrotic core (NC) and
superficial foam cells (SFC) are indicated. Hematoxylin and eosin stain. The scale bar indicates a 1 mm length.
histology of a carotid artery that exhibits features of a prototypical vulnerable plaque. The diseased intima is separated from the lumen by only a thin fibrous cap, and there is a large cholesterol-rich NC and many superficial foam cells (SFC).
At present, there does not exist a scheme for assessing the relative vulnerability of different lesions. To address this limitation, a quantitative approach to ranking plaque vulnerability, called the vulnerable plaque index, is proposed in Sec. 6.2.4.
E
1.1.3 Competing technologies
There is currently great interest in developing new techniques for clinical detection and imaging of vulnerable plaque. These include x-ray angiography, angioscopy, intravascular ultrasound (IVUS), thermography, nuclear magnetic resonance imaging (MRI), computed tomography (CT), optical coherence tomography (OCT), nonlinear optical microscopy, and optical spectroscopy [18]. A brief
X-ray angiography
X-ray angiography, the gold standard for diagnosing atherosclerosis, uses x-ray transmission to image vessel narrowing and blood flow. Contrast is obtained by injecting a radio-opaque medium into the artery lumen. This technique can quantify the severity of stenosis and identify occlusive thrombi and dense calcifications. However, it is unable to identify the marginally stenotic vulnerable plaques that give rise to the majority of acute ischemic events [19, 20, 21, 22, 23].
Angioscopy
Although not commonly used in general practice in this country, angioscopy has been widely ap-plied for evaluation of coronary atherosclerosis outside the United States [24, 25]. By visualizing the arterial surface with white light illumination through a miniature endoscope ("angioscope"),
atherosclerotic plaques and surface complications such as rupture and thrombosis can be identified. However, angioscopy cannot probe subsurface changes such as the thinning of the fibrous cap that are critical to identifying vulnerable plaque before rupture or thrombosis has occurred, nor can it provide chemical information about lesion composition [20, 26, 27].
Intravascular ultrasound (IVUS)
IVUS overcomes some of the limitations of angiography and angioscopy [28, 19, 29, 30, 31, 32, 33].
Relying on changes in tissue density, that affect the reflection of sound waves, IVUS can image several features of subsurface plaque architecture, such as fibrous cap thickness and NC depth. However, other key features, such as the presence of inflammation or SFCs, cannot be assessed. Again, this technique cannot provide chemical information. Interestingly, IVUS is frequently used as a reference to evaluate pilot studies for new imaging technologies. For example, comparisons
with IVUS have been made to validate studies using Raman spectroscopy and OCT for arterial imaging [34, 35].
Thermography
Thermography, one of the few imaging techniques specifically targeted to vulnerable atherosclerotic plaques, is based on detection of heat released by inflammatory cells within vulnerable plaque. This technique is still in early stage development [36, 37].
Nuclear magnetic resonance imaging (MRI)
MRI uses radio waves to induce spin flips of (water molecule) protons in a tissue sample placed in a high magnetic field. By applying a spatial field gradient, changes in tissue density can be imaged. Although, in principle, MRI can provide chemical information (by targeting nuclei other than water), in practice this is not feasible because of the relatively low concentrations of other molecules, which translates into inadequate sensitivity. Thus, conventional MRI produces only anatomical images. As with IVUS, MRI angiography has been used to distinguish features of atherosclerotic plaque such as fibrous cap and NC in human cadaveric carotid endarterectomy specimens [38] and patients undergoing carotid endarterectomy [39]. Recent studies indicate that MRI can identify thrombus [40] and intraplaque hemorrhage [41, 42] in carotid arteries. However, imaging coronary arteries has proven to be more difficult, because of cardiac and respiratory motion. New black-blood, contrast-enhanced breath-holding and free-breathing respiratory-gated MRI techniques may help overcome these limitations [43]. However, because of the small caliber and tortuosity of coronary vessels and their close proximity to other cardiac structures, adequate spatial resolution cannot be achieved without the use of extremely high magnetic fields [44]. Recently developed intravascular MRI techniques may provide the spatial resolution required for imaging coronary atherosclerosis
[45,
46].
Computed tomography (CT)
Similar advances have been made in CT imaging of atherosclerosis. Multi-slice spiral CT is a high resolution imaging technique that has recently been applied to anatomic imaging of atherosclerotic plaque in the coronary, carotid and peripheral arteries [47]. Cardiac motion is still a problem but may be overcome by means of electrocardiographic gating. Ultrafast electron beam computed tomography (EBCT) has improved spatial resolution. However, it can only detect calcifications, and thus is blind to non-calcified plaques [12, 48, 49, 50]. As with the other more conventional imaging techniques, it cannot assess key features of vulnerable plaques.
Optical coherence tomography (OCT)
OCT is a promising technique actively being investigated for vascular imaging [51, 52]. It uses singly back-scattered light to obtain subsurface images as a function of depth. Similar to IVUS, which relies on density changes in the vessel wall, OCT relies on changes in refractive index. However, since OCT employs light rather than sound, images with much higher spatial resolution can be achieved, on the order of 10 pm. OCT has been applied successfully in vivo [53] and has shown the promising potential to detect key markers of vulnerable plaque including a thin fibrous cap [54, 53], macrophages [55, 56], calcium nodules [54], and thrombus [35]. However, OCT does not provide chemical information.
Nonlinear optical microscopy
Recently, nonlinear optical microscopy techniques have emerged as means to perform 3-D imaging of tissues, including artery tissue. These nonlinear techniques include two-photon excited
rescence (TPEF), second-harmonic generation (SHG), and coherent anti-Stokes Raman scattering (CARS). TPEF can be used to provide images of elastin fibers (as well as collagen and cellular components), SHG microscopy can probe collagen fibrils, while CARS is particularly sensitive to lipid-rich structures. Several studies have reported using nonlinear optical microscopy to provide high resolution images of human arteries and thus serve to assess the vulnerability of plaque mor-phology [57, 58]. However, as much as these imaging techniques may eventually replace histology, their feasibility as in vivo intravascular modalities is yet to be demonstrated. In addition, these techniques are most promising when they utilize sources of exogenous contrast, which have their own disadvantages.
Optical spectroscopy
Optical spectroscopy is also being studied for evaluation of these critical lesions. Several groups have explored the use of near-infrared spectroscopy (1-2.4 pm) to characterize atherosclerotic plaque, [59, 60], with a recent paper reporting promising results in detecting markers of plaque vulnerability such as a thin fibrous cap, lipid pools, and inflammation [61]. A commercial device using near-infrared spectroscopy has recently obtained FDA approval for intravascular imaging of coronary arteries [62]. In this wavelength range, absorption is due to molecular overtone/combination vibrations and can provide information about tissue composition. This technique is attractive because of the large signals and potentially low cost of the instruments. However, the spectral features are broad and overlapping, which decreases predictive ability. Further, water absorption in this wavelength range can distort the spectral features and reduce sampling depth to well below the intimal thickness.
Other spectroscopic techniques, including [ultraviolet-visible] diffuse reflectance, fluorescence, and Raman spectroscopy, being the subject of the present work, are discussed more thoroughly in
the next section.
0
1.2 Optical properties and spectroscopy
When light interacts with tissue, several physical processes determine how the incident energy is transformed. Some of the light is elastically scattered, either one or many times, before returning to the surface. During this process, some portion of the light may be absorbed by the endogenous absorbers in the tissue, while a portion of the absorbed light may be remitted as fluorescence after interacting with native fluorophores. Lastly, a small fraction of the light can be inelastically scattered through a molecule-specific process called Raman scattering. We now discuss reflectance, fluorescence, and Raman scattering in more detail.
* 1.2.1 Reflectance
Using diffuse reflectance spectroscopy (DRS), we study the spectrum of near UV-visible light (300 - 700 nm) traversing turbid biological tissue. The resulting spectrum exhibits features due to
scattering and absorption of the incident light by the tissue. In atherosclerotic plaque, the structures that account for scattering are the morphological components such as foam cells, collagen matrix, and other structures that spatially vary the index of refraction. The main absorbers are hemoglobin, associated with thrombus or acute intraplaque hemorrhage, and /-carotene, whose absorption has been used previously for spectroscopic detection of atherosclerosis [63, 64]. A recent study of reflectance, in the extended range of 400 to 1700 nm, perhaps overcomes some of the mentioned shortcomings of near-infrared spectroscopy; the said study reported promising results in detecting a large lipid core in plaques, a key feature of vulnerability, using the contributions of 3-carotene and hemoglobin [65].
In our laboratory, we have previously developed a model to analyze DRS spectra based on an analytical expression for diffusion of multiply-scattered light [66]. This expression is an appropriate simplification of a well established formula for diffuse reflectance developed by Farrell et al., who calculated the diffuse reflectance from a narrow beam of light incident on the surface of a semi-infinite turbid medium under the diffusion approximation [67]. This modeling and analysis enables the extraction of the wavelength-dependent coefficients of scattering (p') and absorption (IPa). The
reduced scattering coefficient M' characterizes the scattering properties of tissue by specifying the
number of scattering events that light would, on average, undergo as it traverses the medium, and it takes into account the anisotropy [68]. The absorption coefficient Ma characterizes the absorbers in the tissue by specifying the average number of absorption events that would occur [68]. The diffusion approximation, which is used here, assumes that scattering dominates over absorption,
1s4
>> Pa. A more detailed description of DRS modeling can be found in Sec. 4.3.1.0
1.2.2 Fluorescence
Fluorescence spectroscopy relies on the excitation of molecular electronic energy levels, giving rise to re-emission at wavelengths longer than the exciting light. The spectrum of the emitted light pro-vides information about the fluorescing molecule (fluorophore). In addition, the emission spectrum can vary with excitation wavelength, providing additional molecular information. The primary fluorophores in arterial tissue are elastin, collagen, tryptophan, ceroid [69] and oxidized low density lipoprotein [70]. A number of research groups, including our own, have employed continuous wave [71, 72, 73], and time-resolved [74, 75] fluorescence spectroscopy to diagnose atherosclerosis, includ-ing the detection of a thin fibrous cap [70], lipid-rich lesions [76], disruption [77], and macrophages
However, the broad overlapping spectral features of tissue fluorophores, further confounded by absorption and scattering, are a barrier to extracting spectral information with sufficient accuracy for quantitative analysis of vulnerable plaque. One recent study using fluorescence showed promis-ing results in identifypromis-ing thin fibrous cap atheromas, but a number of samples had to be eliminated from the analysis due to the inability to compensate for the spectral distortions caused by scattering and absorption [70]. Our laboratory has previously developed a method to remove these distortions using the information from the DRS spectrum, and thus extract the intrinsic fluorescence [79, 80], which can be decomposed into a linear combination of the spectra from fluorophores associated with morphological structures in the tissue. Intrinsic fluorescence spectroscopy (IFS) has been successfully employed in our laboratory for cancer diagnosis [81, 82]. A more detailed description of IFS modeling can be found in Sec. 4.3.2.
0
1.2.3 Raman scattering
Raman spectroscopy detects molecules by exciting vibrations amongst bonds which are unique to each molecule, and has been used extensively in biomedicine [83, 84]. Raman spectroscopy is based on a scattering process in which monochromatic light incident on a sample sets the molecules into vibration. The vibrating molecule takes away a small amount of the incident photon energy, shifting the scattered light to lower frequency (i.e. longer wavelength). This frequency shift, usually measured in wave numbers (cm-1), is equal to the molecular vibration frequency. As biological molecules have a number of vibrations, each with characteristic frequency and Raman scattering cross section, the Raman spectrum of a given molecule has a unique pattern. Raman signals are weak, and thus care is required to efficiently collect and optimize them. Note that, unlike fluorescence, the Raman spectrum manifests itself as shifts in frequency from that of the excitation
light frequency. Previous work by our group on Raman spectroscopy of atherosclerosis identified eight key morphological components in arterial pathogenesis that could be identified by their Raman spectral signatures: collagen fibers (CF), cholesterol crystals (CC), calcium mineralization (CM), elastic lamina (EL), adventitial adipocytes (AA), foam cells/necrotic core (FC/NC), beta-carotene crystals (P-CC), and smooth muscle cells (SMC) [851. A diagnostic algorithm, using morphological information extracted with a linear combination model similar to that used for IFS, was able to classify in vitro coronary artery specimens as non-atherosclerotic, non-calcified plaque and calcified plaque with 94% accuracy [86]. The development of a small-diameter, high-throughput, filtered Raman probe [87] has resulted in the first in vivo clinical application of the Raman spectroscopy diagnostic algorithm in real-time [88] during carotid endarterectomy and femoral bypass surgeries
[89].
* 1.3 MMS
One of the goals of the present work is to explore the diagnostic power of DRS, IFS and Raman spectroscopy together, which we term multimodal spectroscopy (MMS). The advantages of MMS are two-fold. First, MMS yields complementary biochemical and morphological information about arterial tissue that no individual modality can provide by itself. Second, the information obtained by these modalities is depth-sensitive, due to the inherently different tissue penetration by the various incident wavelengths employed.
* 1.3.1 Complementarity
The complementary tissue information that can be obtained from MMS is the following. DRS provides information about tissue scattering and absorption, as mentioned earlier, and allows for
the assessment of tissue turbidity. Scattering is indicative of the presence of index varying struc-tures such as foam cells/macrophages while hemoglobin absorption provides information about the presence of blood, clotting, or hemorrhage. DRS is also critical in extracting the IFS signal from fluorescence, which provides relative amounts of tissue fluorophores that are present such as colla-gen, elastin, and low-density lipoprotein (LDL). Raman spectroscopy is very molecule specific and is particularly useful in identifying highly Raman active components such as calcification as well as necrotic core and foam cells. Taken together, the three modalities provides a more complete picture of the tissue state. There are also areas where some modalities overlap and this common information can be used to make the algorithms more robust. For example, both IFS and Raman spectroscopy can detect collagen, while both DRS and Raman are sensitive to hemoglobin.
0
1.3.2 Depth sensing
The depth-sensing aspect of MMS comes from the relationship between tissue turbidity and wave-length. For IFS, typical wavelengths that are used are in the ultraviolet, such as 308 nm and 340 nm excitation. DRS uses the broad visible spectrum 400-700 nm while Raman spectroscopy uses near-infrared 830 nm excitation. Thus MMS information is spanned over a relatively large range of wavelengths, over which tissue properties vary significantly. In Fig. 1-2, the absorption coefficient p,a and the reduced scattering coefficient p' of artery tissue are given in this range of wavelengths, obtained from data published by Keijzer et al. [90]. It is evident that both scattering and absorption decrease with increasing wavelength and thus artery tissue, as with most other tis-sues, is optically more transparent at longer wavelengths. Subsequently, the penetration depth of different wavelengths in artery tissue will increase with wavelength. As a result, the IFS will assess information at the most superficial level, DRS provides information at an intermediate depth, while
E 0 =L nO0 "'30 E C.
...
~
...
'...
. . .,·I...
I...
·
· -- Adventitia
.
Intima
!'
;.
. ..
.
..
..
...
...
M
ed ia
. . ,.. .. .. . . ... ....~
... . . ... .10
400 500 600 700 800 Wavelength (nm) Wavelength (nm)Figure 1-2. The optical properties of arterial tissue on 340-800 nm. Top graph in (a) shows the absorption coefficient
la and (b) shows the reduced scattering coefficient as.
Raman spectroscopy samples deepest in artery tissue. A more detailed and quantitative discussion of sampling depths is given in Sec. 2.2.1.
0
1.4 Data analysis
Real-time analysis of spectroscopic measurements is essential in many applications, including phar-macokinetics [91], bioreactor monitoring [92], and medical diagnosis [93]. In our laboratory [94, 89]
I
to provide clinicians with immediate diagnoses, in lieu of histopathology. In medical applications, the confidence in the measurement of a particular diagnostic parameter can affect the course of disease management, with ramifications to the health of the patient. The uncertainties and the associated confidence intervals of the parameters extracted from spectroscopic measurements serve to assess the accuracy, stability, and diagnostic value of the data. The importance of uncertainty is related to other figures of merit commonly mentioned in the chemometrics field: signal-to-noise ratio, precision, limit of detection, sensitivity, error propagation and selectivity [97, 98]. Note that measurement uncertainty (precision) is different from measurement accuracy.
The most effective way to extract quantitative information from spectral data in a linear system is by utilizing the full spectrum (multivariate analysis) [99]. In this formalism, a spectrum, a series of intensity values at different wavelengths, is mathematically represented as a vector. Consider, for example, measurement of the concentration of a particular species or analyte. This requires a model that, when applied to a measured spectrum, yields the concentration of interest. In most cases, the model can be conveniently expressed in terms of a regression spectrum or "b-vector" for a particular analyte; the analyte concentration (ck) of a prediction sample can then be expressed as the inner product of the measured spectrum (s) and the analyte-specific b-vector (bk):
ck = bTs. (1.1)
When all of the chemical components are known, the model can be based on the constituent spectra, measured directly, and ordinary least squares (OLS) analysis can be applied, yielding a b-vector for every component of interest. If the spectra cannot be measured directly, or if one or more components are not known, a calibration step is required to generate the b-vectors, and a direct
calibration scheme such as classical least squares (CLS) or indirect calibration schemes such as partial least squares (PLS) or principal components regression (PCR) can be used. The calibration step requires a set of spectra with reference concentrations of the analyte(s) of interest. Similar approaches can be used to measure parameters extracted from biological tissue spectra that are used in disease diagnosis [100, 85]. A concept closely related to the b-vector is the net analyte signal (NAS), introduced by Lorber [101], which is the portion of the signal for each analyte that is orthogonal to the other analyte spectra. The NAS is also useful in evaluating the figures of merit mentioned earlier [102].
In principle, one can evaluate the parameter uncertainty by repeating the measurement many times and analyzing the standard deviation of parameters extracted from each of these multiple measurements; however, this is not practical for applications such as medical diagnosis, in which only one or a few measurements can be acquired. Alternatively, one can use chi-squared (X2)
analysis to calculate parameter uncertainties extracted from a single spectrum [103]. X2 analysis is a very useful technique, but it is statistical rather than analytical and provides little insight into the origins of uncertainty.
In addition, various research groups have worked on deriving analytical expressions for uncer-tainty. Lorber and Kowalski have presented a complete and elegant treatment of error propagation associated with multivariate calibration. They derived a prediction error (uncertainty) formula that depends on the noise in the spectrum of the prediction sample and the spectra and concen-trations of the analyte of interest in the calibration set. The formula was successfully tested on near-infrared reflectance data analyzed by PCR [104]. One practical shortcoming of the formula is its complexity and the difficulty in readily applying it to experimental data. Other groups have taken similar approaches to error analysis [105, 106, 107]. One of the goals of the present work is
to develop a simple analytical expression for characterizing uncertainty that can be expressed in terms of physically relevant and understandable parameters and be practically useful for real-time data analysis.
N
1.5 Instrumentation and probes
There has been extensive work, in our group and others, in the areas of instrumentation and probe development relative to the different spectral modalities comprising MMS [108]. This section is broken down into two subsections, the first on previous reflectance/fluorescence instrumentation and the second on previous Raman instrumentation, as the two techniques have been pursued separately in the past. One of the goals of the present work is to develop an integrated clinical MMS instrument that could be used to collect data with a single MMS probe.
N
1.5.1 Reflectance/fluorescence instrumentation and probes
Our laboratory has previously developed a portable clinical instrument to collect fluorescence and reflectance spectra called the FastEEM, for fast excitation-emission matrix (EEM) [109, 110, 111]. A fluorescence EEM is produced by means of a rotating wheel containing laser dyes, pumped by a 308 nm XeCl excimer laser, which generates nine laser pulses at excitation wavelengths ranging from 340 to 500 nm which, including the 308 nm pulses, provides ten laser excitation wavelengths in all. In addition, a Xenon flash lamp produces white light pulses for reflectance. This light is delivered to the tissue via a thin, flexible optical fiber probe that contains a ring of six collection fibers surrounding a single delivery fiber. Spectra are collected with the probe tip in contact with the tissue. The probe tip contains a cylindrical quartz shield shield that provides a well-defined delivery-collection geometry for spectral data acquisition [112], and its length is chosen to
provide substantial overlap between the delivered light spot and the field of view of the collection fibers. Return light from the tissue is transmitted by the collection fibers to a spectrograph/CCD detector for analysis. A rotating filter wheel in the collection beam path, synchronized to the laser excitation pulses, prevents scattered excitation light from entering the spectrograph. Delivery of all 11 excitation light pulses and collection of the resulting 11 emission/reflectance spectra is accomplished in a fraction of a second, and data analysis is performed in real time (2-3 s). Our laboratory has used the FastEEM in clinical settings to collect DRS and IFS spectra for diagnosis of dysplasia in the esophagus, cervix and oral cavity [81, 82, 113].
* 1.5.2 Raman instrumentation and probes
Clinical applications of Raman spectroscopy have been impeded by the lack of suitable optical fiber probes. In recent years, our laboratory has developed an efficient optical fiber Raman probe [87] that can be used together with a compact clinical Raman instrument capable of real-time application [88]. The instrument uses an 830 nm diode laser, delivered through the probe, to excite Raman scattering. The probe delivers to and collects light with the probe tip in contact with tissue. Conventional fluorescence/reflectance probes cannot be used as the tissue Raman signals are weak and are therefore easily be masked by the probe Raman background and the elastically scattered light. In our Raman probes, a central excitation fiber that delivers the light to tissue is surrounded by a ring of collection fibers that connect to the spectrograph. The distal tip of the probe contain specialized filters on both excitation and collection fibers which serve to reject probe (fused silica) background and elastically scattered light, respectively, thus enabling efficient collection of the Raman signals. A sapphire ball lens is tightly secured at the probe tip, and positioned an appropriate distance from the fibers to insure a collimated beam of excitation light