HAL Id: hal-02265578
https://hal.archives-ouvertes.fr/hal-02265578
Submitted on 10 Aug 2019
HAL is a multi-disciplinary open access archive for the deposit and dissemination of sci-entific research documents, whether they are pub-lished or not. The documents may come from teaching and research institutions in France or abroad, or from public or private research centers.
L’archive ouverte pluridisciplinaire HAL, est destinée au dépôt et à la diffusion de documents scientifiques de niveau recherche, publiés ou non, émanant des établissements d’enseignement et de recherche français ou étrangers, des laboratoires publics ou privés.
Adsorption of REE(III)-humate complexes onto MnO2:
Experimental evidence for cerium anomaly and
lanthanide tetrad effect inhibition
Mélanie Davranche, Olivier Pourret, Gérard Gruau, Aline Dia, Martine
Bouhnik-Le Coz
To cite this version:
Mélanie Davranche, Olivier Pourret, Gérard Gruau, Aline Dia, Martine Bouhnik-Le Coz. Adsorption of REE(III)-humate complexes onto MnO2: Experimental evidence for cerium anomaly and lanthanide tetrad effect inhibition. Geochimica et Cosmochimica Acta, Elsevier, 2005, 69 (20), pp.4825-4835. �10.1016/j.gca.2005.06.005�. �hal-02265578�
Adsorption of REE(III)-humate complexes onto MnO
2: Experimental
evidence for cerium anomaly and lanthanide tetrad effect inhibition
Mélanie Davranche*, Olivier Pourret, Gérard Gruau, Aline Dia, Martine Le Coz-Bouhnik
CAREN, Géosciences Rennes, UMR CNRS 6118, Campus de Beaulieu
35042 RENNES Cedex, France
Abstract- Adsorption experiments of rare-earths elements (REE) onto MnO2 have been conducted to evaluate the effects of REE organic complexation on both REE(III) adsorption
kinetics and Ce(III) oxidation rates. Two types of aqueous solutions - NaCl and NaNO3 - were
tested at pH 5 and 7.5. REE(III) adsorption kinetics and Ce(III) oxidation rates is evidenced to
depend strongly on REE speciation. Time-series experiments indicate that a stationary
exchange equilibrium is reached within less than 10 h when dissolved REE(III) occurs as free
species whereas steady state is not reached before 10 d when REE occur as REE-humate
complexes. Humate complexation also results in an inhibition of positive Ce anomalies and
M-type lanthanide tetrad effect development in REE patterns. Monitoring of dissolved
organic carbon (DOC) concentrations showed that ratios of logKREEd organic logKDOCd ratios
were close to 1.0, implying that the REE(III) and humate remained bound to each other.
The lack of Ce anomaly development when REE occurred as REE-humate complexes seems
to arise from the humate shielding of the MnO2 surface and Ce(IV) preferential adsorption
inhibition. The suppression of the lanthanide tetrad effect suggests that REE(III)-humate
complexes is bound to MnO2 by the humate side (anionic adsorption). Thus, Ce cannot be
used as a reliable proxy of redox conditions, in either organic-rich waters, or precipitates
development of strongly oxidizing conditions and the presence of MnO2 in the aquifer, no (or
insignificant) negative Ce anomalies are observed in organic-rich waters.
Key-words-Ce anomaly, REE, humic acid, Mn oxide, scavenging-oxidation, ternary surface
complex.
1. INTRODUCTION
Studies of the behaviour of the rare earth elements (REE) have recently become an
essential part of aqueous trace element chemistry. The reason for this is that REE represent a
very coherent group of elements whose chemical properties vary gradually along the group.
They exhibit similar chemical properties, which vary gradually along the group and are a
highly sensitive to pH, sorption processes changes and strongly influenced by redox
chemistry of Fe and Mn. Thus, they have been used as tracers in studies dedicated to the
geochemistry of rivers, lakes, seawater, groundwater and geothermal fluids (Elderfield and
Greaves, 1982; De Baar et al., 1983, 1985, 1988; Elderfield, 1988; Elderfield et al., 1990;
Smedley et al. 1991; Gosselin et al., 1992; Johannesson and Lyons, 1994, 1995; Johannesson
et al., 1995; Braun et al. 1998; Van Middlesworth and Wood, 1998; Elbaz-Poulichet and
Dupuy, 1999; Dia et al., 2000; Leybourne et al., 2000; Yan et al., 2001; Aubert et al., 2002;
Biddau et al., 2002; Möller et al., 2002). One of the major conclusions of these studies is that
Ce can be fractionated from the remaining dissolved REE as revealed by the widespread
occurrence of negative Ce anomalies in both oceanic and fresh waters. Seawater, for example,
show a strong negative Ce anomaly which is mirrored by a positive anomaly in hydrogenic
ferromanganese nodules (Piper 1974; Elderfield et al., 1981; De Carlo and McMurthy 1992).
1998; Dia et al., 2000; Leybourne et al., 2000). These studies evidence also that REE in
solution (river, ground and soil waters) are generally not truly dissolved REE but correspond
to colloidal-borne REE (Sholkovitz, 1995; Viers et al., 1997).
REE exhibit a (+III) oxidation state in natural environments. However, among REE,
Ce can occur in oxidizing conditions as Ce(IV). Ce oxidation can occur abiotically through
oxidation/scavenging of dissolved Ce(III) by Mn and Fe oxyhydroxides (De Carlo et al.,
1998; Bau, 1999; Ohta and Kawabe, 2001), or biotically by microbially-mediated redox
reactions (i) bacteria oxidize directly Ce(III) into Ce (IV), or (ii) bacteria oxidize Mn(II) into
Mn(IV), the Mn oxyhydroxide formed using as an oxidation surface for Ce(III) (Moffet,
1990). Because Ce(IV) is adsorbed more strongly than the other trivalent REE, the Ce(III)
oxidation/scavenging reaction may result in solutions displaying a negative Ce
anomaly,whereas the solids exhibit positive Ce anomalies. This feature has been largely used
for geochemical fingerprinting of redox conditions and notably in the study of marine
environments (De Baar et al., 1983, 1985, 1988; Elderfield, 1988; Smedley et al. 1991;
Johannesson and Lyons, 1994, 1995; Braun et al. 1998; Leybourne et al., 2000; Kuss et al.,
2001) or paleo-environments (Wright et al., 1987; Macleod and Irving, 1996; Holser, 1997;
Morad and Felitsyn, 2001).
Much attention has also been paid in recent years to the potential application of Ce
anomaly as either, a paleo-oceanographic indicator of widespread marine anoxia, or as a
redox proxy in paleosols (Wright et al., 1987; Macleod and Irving, 1996; Gallet et al., 1996;
Holser, 1997; Morad and Felitsyn, 2001; Picard et al., 2002).
However, many oxidizing waters do not exhibit negative Ce anomalies. In fact,
evidence exists that the occurrence of organic ligands in the solutions may prevent Ce(III)
oxidation. Such evidence was provided by Dia et al. (2000) who reported time series data for
Mn concentrations for organic-rich, shallow groundwater from a small catchments in western
France. Despite the development of temporary oxidizing conditions and neoformation of Mn
oxides, no (or insignificant) negative Ce anomalies were observed ((Ce)>0). Similar results
were reported by Viers et al. (1997) who investigated the major, trace element and REE
chemistry of organic-rich shallow groundwaters from a small tropical catchments in western
Africa. In such organic-rich, shallow groundwaters, the so-called "dissolved" REE pool
generally occurs as REE(III)-humate complexes (Viers et al., 1997). This observation is
consistent with the high conditional stability constants of these complexes (Byrne and Li,
1995; Takahashi et al., 1997, 1999). These studies strongly suggest that complexation of REE
by humic substances might be the key factor that prevents oxidative scavenging of Ce(III) in
these waters.
Understanding the sensitivity of REE(III) sorption properties and Ce(III) oxidation rates
to REE(III) speciation is especially important since Ce anomaly has often been proposed as
paleoredox proxy, both in the ocean and in soils. This application certainly has potential, but
requires a more thorough understanding of the processes that control the oxidation and
reduction of Ce in both the marine and continental environments. The aim of this study is to
compare apparent REE distribution coefficients and apparent Ce(III) oxidation rates from
MnO2 suspensions in which the REE(III) occurred alternatively as REE(III)-humate complex
and free REE(III) inorganic species.
2. EXPERIMENTAL SET UP
All chemicals used in this study were of analytical grade. All solutions were prepared
with doubly de-ionized water (Milli-Q system, Millipore). The polyethylene containers used
rinsed with Milli-Q water for 24 h at 60°C, to remove all possible REE contamination
sources. Synthetic REE solutions were prepared from nitrate REE standards (10 ppm; Accu
TraceTM Reference Standard). REE concentrations were determined by ICP-MS – HP 4500,
Agilent Technologies – at Rennes University (Appendix 1).
2.1. Manganese oxide
Synthetic MnO2 (Aldrich) was used in the adsorption-oxidation experiments. The solid
structure was analyzed by X-Ray diffraction (XRD) on a Siemens D5000 diffractometer. The
principle d spacing indicated a pyrolusite (MnO2) structure. The total surface site number of
MnO2 was estimated using the solid CEC (Cation Exchange Capacity) and determined
following the cobalthexammine method, ISO 11260 (AFNOR, 1994). Ions bound with the
solid surface are exchanged with cobalthexammine ions, and the CEC is the concentration of
cobalthexammine ions eliminated from the solution. Five g of solid MnO2 were mixed with
10 mL of 0.017 M cobalthexammine solution for 3 h. The suspension was then centrifuged
and the concentration of cobalthexammine ion remaining in the solution was measured at 470
nm with a Shimadzu-160 A U.V.-spectrophotometer. These analyses indicate that this MnO2
has a CEC of 70 meq/100g.
Surface acidity constants were determined from potentiometric titrations of 5 g.L-1 of
solid with NaOH (0.1 M) and HNO3 (0.1 M) in 0.1 M NaCl solution as the supporting
electrolyte (Davranche et al., 2002). Titrations were carried out with a Metrohm 794 DMS
Titrino apparatus equipped with a Metrohm combined (3 M KCl) glass electrode. Acidity
constants obtained are pKa1 7.89 and pKa2 3.65 and pHzpc is equal to 5.8, a value that falls
2.2. REE(III)-humate complexes
Humate, referred to below as humate (purified humic acid), was obtained from the
synthetic Aldrich humic acid (Aldrich, H1,675-2) according to the process described by
Vermeer et al. (1998). The humate obtained in this way is ash free and in its protonated form,
with the following elemental composition (in weight percent): C = 55.8%, O = 38.9%, H =
4.6%, N = 0.6%. Purified humic acid has a mean molecular weight of 23 000 Daltons
(Vermeer et al., 1998). Prior to use, the freeze-dried humate was resuspended overnight in a
NaOH solution (pH 10) to ensure complete dissolution of the sample.
Rare-earth element-humate complexes were prepared as follows. Twenty mg of
dissolved humate were enclosed in a 250-mL sodium-acetate dialysis bag with a pore size of
12 000-14 000 Daltons. The bag was introduced into 1000 mL of a 5 ppb REE solution, the
ionic strength being fixed at 10-3 M with NaCl or NaNO3 and the pH adjusted to 7 with HNO3.
Both NaCl and NaNO3 were used as neutral electrolytes. The suspension was stirred for 48 h
(equilibrium time determined from preliminary kinetic experiments), to allow equilibration
and partitioning of the REE between the aqueous solution and the humate suspension. The
dialysis bag was then removed and the REE- humate complexes recovered. The
concentrations of REE in solution both inside and outside the dialysis bag were monitored vs.
time in order to quantify the amount of REE complexed to humate. Possible REE adsorption
onto the dialysis bag was checked by analysing REE content of the membrane (dissolved by
acidic digestion with HNO3 14 N). The results show that complexation rates increase
regularly from the heavy to the light REE, which is consistent with the stability constant order
determined by Takahashi et al. (1997) and Tang and Johannesson (2003) for REE(III)-humate
present in the solution were complexed to the humate. The remaining 25-48 or 5-13 % were
left in solution outside the membrane or adsorbed onto the dialysis bag.
2.3. Adsorption procedure
Five time-series experiments (in duplicate or triplicate) were conducted to assess the
effects of organic complexation on REE(III) adsorption by MnO2. All suspension were
performed with a 100 mg.L-1 MnO2 and allowed to equilibrate with a 10-3 M NaCl or NaNO3
aqueous solution at pH 5 (both inorganic and organic speciation) and 7.5 (organic speciation
only). Experiments were carried out at room temperature, i.e. 20°C2. The pH was monitored
periodically with a pH-meter and adjusted to 5 and 7.5 by addition of HNO3 (4.6 N) or NaOH
(4 N). The 5-pH condition was chosen to promote REE adsorption (but to avoid total REE
sorption that might mask an eventual Ce anomaly development) and 7.5-pH condition to
promote cationic adsorption. The choice of NaNO3 as one of the two tested neutral
electrolytes was imposed by the occurrence of high NO3- concentrations (up to 5.10-3 M) in
the organic-rich, shallow groundwaters studied by Dia et al. (2000). In inorganic experiments,
solutions were made up from 5 ppb REE and in organic experiments, concentrations were 20
mg.L-1 for humate, 3.8-2.6 ppb with NaCl and 4.8-4.3 ppb with NaNO3 for REE,
respectively (concentration obtained after REE/humate complexation).
The first set of experiments carried out with free REE(III) (5 ppb, corresponding to the
molar concentration range of 36 to 29 nM) were conducted to validate the experimental and
analytical set-up used in this study. Data concerning inorganic REE(III) scavenging onto
MnO2 already exists in the literature and could be used for comparison (Koeppenkastrop and
De Carlo, 1992, 1993; Ohta and Kawabe, 2001). In the other time-series experiments,
Here, we quantify the adsorption behaviour of the REE by using the apparent partition
coefficient Kd, expressed as:
solution in REE μg.L oxide Mn g adsorbed REE μg Kd 1 (1)
Ce anomalies are quantified using the (Ce) notation (Grandjean et al, 1987) where:
(Ce) logKCed / logKdLa/ logKP rd 1 ) (2)
Suspension aliquots of about 10 mL were regularly sampled and filtrated through 0.2 m cellulose acetate filters (Sartorius) and the REE concentrations analysed to determined Kd variations through time. Sample aliquots used for REE determination were all immediately
digested with suboiled nitric acid (HNO3 14 N) at 100°C, then resolubilized in HNO3 0.4 N
after complete evaporation, in order to avoid interferences with organic matter during mass
analysis for the organic experiments. Precisions on REE concentrations and logKREEd values
of individual experiments are estimated at 2% (Appendix 1). Duplicate and triplicate
experiments show that the overall reproducibility of the logKREEd values is better than 10%
(Appendix 2).
The adsorption behaviour of the REE(III)-humate complexes was also monitored by
measuring the dissolved organic carbon (DOC) content of the experimental solutions. DOC
measurements can be converted into apparent partition coefficients using Eqn. (3):
solution in DOC μg.mL oxide Mn g adsorbed DOC μg K 1 d (3)
Dissolved organic carbon concentrations were determined at Rennes University using a
Shimadzu 5000 TOC analyzer. Precision and reproducibility are estimated at 1.5% and 10%, respectively (Appendix 2).
3. RESULTS
3.1. Adsorption of inorganic REE(III)(aq)
The experimental results of Log Kd for La, Ce, Pr and Sm are plotted vs. time in Fig. 2.
The values were almost constant over 10 h to 12 d, NaCl run exhibiting a faster adsorption as
compared with those conducted with NaNO3. The data point to the same conclusion to that
reached by Ohta and Kawabe (2001), namely, that steady state is attained within less than one
d (<10 h, here) when REE occur in the solution as free inorganic species, a result which was
already apparent in the works of Koeppenkastrop and De Carlo (1992, 1993). The
discrepancy between the equilibrium Kd values obtained here and those reported by Ohta and
Kawabe (2001) appears to be a direct consequence of the lower MnO2 concentration used in
our experiment: -100 mg.L-1 against 3.2 mg.L-1 in Ohta and Kawabe (2001)-.
All patterns exhibit large positive Ce anomalies (Figs. 3 and 6) as well as convex
tetrad curves or "M" shape, two features already evidenced by Ohta and Kawabe (2001). The
tetrad effect corresponds to small discrete features in REE patterns of geological materials
(Mc Lennan, 1994). In the present study, the low analytical uncertainty on logKREEd values
from adsorption experiments (2%) combined with the large amplitude between logKREEd
values from different tetrad groups (e.g. 8.2% between logKEud inorganicand log KGdd inorganic for
the NaNO3adsorption experiment) suggest that the tetrad effect is effective and not an
artefact.
Ceinorganic anomalies, experessed as (Ce) values, were all positive and almost constant
inorganic
REE d
K values, these values are slightly less than the Ce anomaly values published by Ohta
and Kawabe (2001) for similar pH conditions (around 1.7 time lower).
3.2. Comparison of REE adsorption kinetics and log REEorganic
d
K and log REEinorganic d
K at
pH 5
The experimental results of log KREEd organic for La, Ce, Pr, and Sm are plotted in Fig. 4.
The data show that the complexation of REE(III) by humic acid had large effects on both
REE adsorption kinetics and KREEd equilibrium values. Time series variations of log
organic
REE d
K values reveal that equilibrium was not reached before around 10 d when REE
occurred as REE(III)-humate complexes (Fig. 4), against 10 h when dissolved REE were in
solution as free metal ions (Fig. 2; Ohta and Kawabe, 2001). As regards to the partition
coefficients, log KREEd values were lower in the two organic experiments as compared to the
inorganic case, ranging from 3.4 to 3.5 in the NaNO3 solution experiment and from 3.35 to
3.40 in the NaCl solution experiment against 3.3 to 4.2 in the inorganic run (Fig. 3). Ratios of
DOC d REE
d logK
K
log organic were close to 1.0 indicating that the REE(III) and the humic acid
remained bound to each other during interaction of the REE(III)-humate complexes with the
MnO2 surface.
The patterns of log REEorganic
d
K differ markedly from those recovered during the
inorganic experiments (compare Figs 3 and 5). Firstly, the organic patterns do not show the
same conspicuous tetrad effect or "M" shape (Fig. 3). This general lack of a conspicuous "M"
shape in the organic patterns is highly significant with regards to the adsorption mechanism(s)
conducted so far between REE(III)(aq) and either MnO2 or Fe oxyhydroxides yielded patterns
of log KREEd that showed invariably convex tetrad effects (De Carlo et al., 1998, 2000; Bau,
1999; Ohta and Kawabe, 2001; Fig. 3). Secondly, a significant positive Ce anomaly was not
observed in the patterns corresponding to the REE(III)-humate adsorption (Figs. 5 and 6).
3.3 Comparison of REE adsorption kinetics and log REEorganic
d
K at pH 5 and 7.5
Sorption experiments of REE(III)-humate complexes onto MnO2 at pH 7.5 are
presented in Fig. 5. Adsorption kinetics are faster at pH 7.5 (4 d) than at pH 5 (10 d),
equilibrium log REEorganic
d
K values being lower at pH 7.5 than pH 5. As with the experiments at
pH 5, development of a positive Ce anomaly or tetrad effect is not observed at pH 7.5. Ratios
of logKdREEorganic logKDOCd remained also close to 1.0 suggesting that the rise in pH had
essentially no effect on the stability of the REE(III)-humate complexes upon adsorption
Note that the fairly large relative standard deviations obtained from the triplicate
experiments conducted at pH 7.5 (Table 8; Appendix 2) is due to difficulties in pH regulation
when pH approaches neutrality.
4. DISCUSSION
4.1. Mechanism of Ce anomaly and tetrad effect inhibition
REE adsorption experiments onto MnO2 with REE(III) occurring as REE(III)-humate
complexes evidence the same evolutionary features (i.e. slow-down of REE adsorption
electrolyte (NaNO3 or NaCl). A clear distinction appears between these results and those
stemming out of the inorganic experiments (this study; Ohta and Kawabe, 2001). In this
context, one key question is how does complexation of REE(III) by humic acid inhibit the
development of a positive Ce anomaly at the surface of the MnO2 oxides?
The lack of positive Ce anomalies in log KREEd patterns does not necesseraly mean that
all the adsorbed Ce occurs as Ce(III). In Mn or Fe oxyhydroxides suspensions where REE
occur as inorganic species, the development of a positive Ce anomaly is due to
oxidative/scavenging which is the sum of (i) oxidation of Ce(III) into Ce(IV) and (ii)
preferential sorption of Ce(IV).This decoupling of Ce(IV) from the REE(III) upon adsorption
is due to the change in ionic charge and radius imposed by the oxidation process. However,
cationic adsorption onto oxyhydroxides increases with increasing pH. In strong
pH-conditions, Ce(IV) is present onto the oxyhydroxide surface, but hid in the large amount of
REE(III) adsorbed, any positive Ce anomaly is developed despite the occurrence of Ce(IV).
This effect of pH on Ce anomaly was studied by Bau (1999) for Fe hydroxide and by Ohta
and Kawabe (2001) for MnO2. According to Bau's (1999) results, the amount of extra Ce
scavanged onto Fe hydroxide due to oxidation of Ce(III) to Ce(IV) could not be detected
above a pH of ca. 5 (no occurrence of a mesurable positive Ce anomaly). As regards MnO2, a
positive Ce anomaly was still present at pH 7 - the highest pH value investigated by Ohta and
Kawabe (2001) -, but the size of the anomaly was found to start decreasing above a pH of 6.5.
For REE-humate complex, Ce adsorption mechanism is complicated by the bound of
REE to high molecular weight humate and be their distinct sportive properties - humate
adsorbed at low pH (Avena and Koopal, 1999), aqueous trace metals adsorbed at high pH-.
Humate are large polyfunctionnal macromolecules, potentially able to complex without
selection hundreds of REE. This lack of selectivity among the REE group is consistent with
complexation). Both characteristics of humate – i.e. high complexation capacity; lack of Ce
complexation selectivity – are strong obstacle to the preferential Ce(IV) adsorption necessary
to develop positive Ce anomalies. This could be the main reason (rather than inhibition of
Ce(III) oxidation) why positive Ce anomalies were not observed in experiments where REE
occurred as REE(III)-humate complexes.
This "buffering" effect of humate on Ce/REE fractionation is confirmed by pH 5 and pH
7.5 experiments. Cation ligand complexes, denoted as ML (with M and L representing, the
cation and the ligand respectively) can adsorb onto a solids (S) to form ternary surface complexes. These complexes could exist in two forms (i) S LM (cation linked to the mineral surface over the ligand) or (ii)SOML (ligand linked to the surface over the cation) (Schindler, 1990, Nowack and Sigg, 1996). The formation of both types of complexes
depends on whether the surface groups of the oxide can participate in exchanging their OH
-with the cation-ligand complex. These reactions depend strongly on pH. When pH is lower
than the solid pHzpc (pH for which positive and negative charges occur in equal number)
adsorption is of anionic type (S LM). In pH 5-experiments, pH was slightly lower than the pHzpc of the MnO2 used in this study (5.8). Consequently, anionic adsorption occurred (eq.
4) -OH REE -PHA S PHA -REE OH S
(4)In such a situation Ce was not in contact with the oxidative MnO2 surface and Ce(III)
was consistently not oxidized in Ce(IV) (no possibility of developping a positive Ce
anomaly). In the second series of experiments, however pH was rise at 7.5, i.e. a value well
above the pHzpc of the MnO2 . Under such a situation, cationic adsorption could occur (eq. 5):
S OH REE-PHA S-O-REE-PHA H (5) In this case, Ce(III) could become oxidized, and Ce/REE fractionation could develop.
at pH 7.5. The equilibrium time and logKREEd organic values decrease is meaningful with regards
to the REE-humate complex adsorption. The REE-humate complex seems to have the same
behaviour onto solid surface than an ‘uncomplexed’ humate (decrease of adsorption rate at
high pH). Unlike in the inorganic experiments where Ce and REE can adsorb onto MnO2
surfaces independently from each other, REE (including Ce(IV)) are physically linked
together by the humate molecule in the organic experiments. Ce can thus be oxidized by the
MnO2 surface. However, a positive anomaly cannot develop. The preferential Ce(IV) sorption
cannot proceed due to binding of the entire REE pool to humate.
Finally, we are concerned by the lack of tetrad effect for the log KREEd organicvalues in
the patterns. It was suggested that the growth of convex tetrad effect may reflect the change of
coordination state of the REE(III) adsorbed onto either MnO2 or Fe oxyhydroxides (Bau,
1999; Ohta and Kawabe, 2001). Ohta and Kawabe (2001) hypothesized that REE(III)
adsorbed onto MnO2 are linked with hydroxyl ions, water molecules and oxygen bound with
Mn(IV). According to these authors (op. cit.), this coordination would explain the increase of
convex tetrad effect with pH, by the increasing proportion of hydroxyl ion bonding REE(III).
When REE(III) are complexed by humic acid, interaction of the ternary complex thus formed
with the MnO2 surface occurs dominantly by the humate side, implying that a large part of the
REE(III) pool is probably not directly bound to the MnO2 surface. The presence of the
lanthanide tetrad effect reveals that during the interaction of dissolved REE(III) with MnO2,
the behaviour of these elements cannot fully be described by differences between their ionic
radii, requiring instead changes of the coordination state of the REE(III) adsorbed onto MnO2.
The latter mechanism would be hardly activated since REE (III) cannot directly interact with
the MnO2 surface in the organic experiment.
Moreover, the tetrad effect expresses the differences in Racah parameters for 4f
that Racah parameters in REE(III) ions decrease with increasing covalence of bonding of
REE(III) with ligands. If REE-humate complexes are adsorbed onto MnO2 as
ML O S
(eq. 5, cationic adsoption), Racah parameters are smaller and, consequently, a conspicuous M-type tetrad effect should be observed. Thus, the lack of tetrad effect in the log
organic
REE d
K patterns suggests that REE(III)-humate complexes is bound to MnO2 by the
humate side confirming the chemical mechanism of eq. 4.
4.3. Comparison with natural waters and inferences on the use of Ce anomaly as a redox proxy in paleosols.
Shallow organic-rich waters from several continental areas (e.g. western Europe and
Africa) have been shown to be characterized by no, or only very small negative Ce anomalies
despite the occurrence in these waters of strongly oxidizing conditions and of Mn oxides in
associated aquifers (Viers et al., 1997; Braun et al., 1998; Dia et al., 2000; Gruau et al., 2003).
Figure 8 presents (Ce) vs. Mn and (Ce) vs. DOC plots that illustrate both two
characteristics. Particularly interesting are the data from the Kervidy-Naizin catchment in
western France (Dia et al., 2000). As can be seen, the hydrochemical dataset from this
catchment shows clear evidence of Mn oxidation and MnO2 precipitation at the soil-water
interface as revealed by the marked decrease of dissolved Mn concentrations; yet, (Ce)
decrease only very slightly (Fig. 8).
In their paper, Dia et al. (2000) stated that "it is clear that the lack of Ce anomaly is a
rather surprising feature given the redox sensitive chemistry of this element and the occurrence of seasonal redox variations” in the Mercy wetland (i.e. the precise name of the site from which the Kervidy-Naizin waters were sampled). Taking into account the fact that
dissolved and colloidal organic complexes, Dia et al. (2000) put forward two hypotheses to
account for this lack of Ce anomalies: (i) either Ce precipitation and oxidation became
impossible because of the complexation of Ce(III) by organic matter or, (ii) CeO2 precipitated
onto colloids being then considered as part of the solution. The experimental data reported in
this study favour the first hypothesis, though showing that the true ultimate cause of the lack
of Ce anomly development in these waters is more likely to be inhibition of prefrential Ce(IV)
sorption rather than inhibition of Ce oxidation reaction
Another implication of the results of this study concerns the use of Ce anomalies in
paleosols as paleoclimatic proxies. In the last two decades, many environmental proxies have
been explored on paleaosol sequences, including Ce anomalies (Rankin and Child, 1976;
Gallet et al., 1996; Braun et al. 1998). It was stated that the redox state of a paleosol at the
time of its formation should correlate with climatic factors such as rainfall intensity or/and
ambient atmospheric temperature. From a paleoclimatic point of view, it is indeed possible
that wet periods led to the dominance of oxidizing conditions in paleosols due to the
continuous recharge of the soil solution by oxygen-rich rainwater, a process which would
stabilize Mn oxide phases in the weathering front. Considering solely the inorganic
experimental results of Ohta and Kawabe (2001), one could then consider that both negative
or positive Ce anomalies would be expected to occur in paleosols formed under such
conditions, depending on whether the latter incorporated the stabilized Mn oxide phases
(positive Ce anomaly) or contained secondary mineral phases precipitated from fluids in
equilibrium with the Mn oxide solids (negative Ce anomaly). However, these new
experimental results show that the complexation of REE(III) by humic substances - a process
likely to occur during formation of organic-rich paleosols - could possibly destroy such a
pattern by partially inhibiting the development of a positive Ce anomaly on soil Mn oxides,
studies dedicated to test the occurrence of paleoclimatic proxies in the loess-paleosol
sequences of China, Gallet et al. (1996) and Jahn et al. (2001) showed that the soils from
these sequences yielded variable Ce anomalies, uncorrelated with well-established climatic
proxies such as the magnetic susceptibility or the chemical index of alteration. In their 2001
paper, Jahn and co-workers failed to find any satisfactory explanation for this discrepancy in
term of climatic variability or differences in pedogenetic or alteration intensity. Then, the
interplay between variable redox conditions and REE(III) organic speciation may lead to
complex REE patterns in paleosols which may not unambiguously reflect the climatic
conditions at time of their genesis.
5. SUMMARY
Free REE(III) and REE(III)-humate complexes adsorption behaviour onto MnO2 point
out that humate complexation strongly modified the REE sorptive properties. Time-series
experiments indicate that a stationary exchange equilibrium is reached within less than 10 h
when dissolved REE(III) occurs as free and 10 d when REE occur as REE(III)-humate
complexes. Humate complexation also resulted in an inhibition of positive Ce anomalies and
M-type lanthanide tetrad effect development.
The strong REE complexation capacity of humate coupled to their inability to
preferentially complex Ce prevent the preferential adsorption of Ce(IV) necessary to positive
Ce anomalies development. As regards inhibition of the lanthanide tetrad effect is attributed
the the anions adsorption of the REE-humate complex (eq. 4), REE(III)-humate adsorbed onto
the MnO2 surface by the humate side. Under this condition, the changes in ionic radii
These new experimental data show that Ce anomalies may not be a reliable proxy of
redox conditions in organic-rich waters or in precipitates formed in equilibrium with humic
substances rich waters. These data help to explain why no, or insignificant negative Ce
anomalies may be observed in shallow organic-rich groundwaters despite the development of
strongly oxidizing conditions and the presence in the aquifer of MnO2.
Acknowledgements. We thank the technical staff in Rennes for their assistance during the experimental and analytical work. Thierry Bataille from the XRD laboratory of Rennes
University is acknowledged for his help in determining the MnO2 cristallographic structure.
This research was supported by the INSU-CNRS through Programme PNSE.
REFERENCES
AFNOR: 1994, Qualité des Sols, AFNOR, Paris, 250pp.
Aubert D., Stille P., Probst A., Gauthier-Lafaye F., Pourcelot L. and Del Nero M. (2002)
Characterization and migration of atmospheric REE in soils and surface waters. Geochim.
Cosmochim. Acta 66, 3339-3350.
Avena M. J. and Koopal L. K. (1999) Kinetics of humic acid adsorption at solid-water
interface. Environ. Sci. Technol. 33, 2739-2744.
Bau M. (1999) Scavenging of dissolved yttrium and rare-earths by precipitating iron
oxyhydroxydes: Experimental evidence for Ce oxidation, Y-Ho fractionation, and
Lanthanide tetrad effect. Geochim. Cosmochim. Acta 63, 67-77.
Biddau R., Cidu R. and Frau F. (2002) Rare-earth elements in water from the albitite-bearing
Braun J. J., Viers J., Dupré B., Polvé M., Ndam J. and Muller J. P. (1998) Solid/liquid
fractionation in the laterite system of Goyoum, East Cameroon: The implication for the
present dynamics of the soil covers of the humid tropical regions. Geochim. Cosmochim.
Acta 62, 273-299.
Byrne R. H. and Li B. (1995) Comparative complexation behaviour of the rare earths.
Geochim. Cosmochim. Acta 59, 4575-4589.
Davranche M., Lacour S., Bordas F. and Bollinger J-C. (2003) An easy determination of the
surface chemical properties of simple and natural solids. J. Colloid Interf. Sci. 80, 76-78.
De Baar H. J. R., Bacon M. P. and Brewer P. G. (1983) Rare-earths distributions with a
positive Ce anomaly in the western North Atlantic Ocean. Nature 301, 324-327.
De Baar H. J. R., Bacon M. P., Brewer P. G. and Braland K. W. (1985) Rare-earths in the
Pacific and Atlantic Ocean. Geochim. Cosmochim. Acta 49, 1943-1959.
De Baar H. J. W., German C. R., Elderfield H. and Van Gaans P. (1988) Rare-earths element
distributions in anoxic waters of the Cariaco Trench. Geochim. Cosmochim. Acta 52,
1203-1219.
De Carlo E.H. and McMurthy G.M. (1992) Rare earth element geochemistry of
ferromanganese crusts from the Hawaiian Archipelago. Chem. Geol. 95, 235-240.
De Carlo E. H., Wen X.-Y., and Irving M. (1998) The influence of redox reactions on the
uptake of dissolved Ce by suspended Fe and Mn oxide particles. Aquatic Geochem. 3,
357-389.
De Carlo E.H., Wen X. Y. And Coven J. P. (2000). Rare earth element fractionation in
hydrogenetic Fe-Mn crusts: The influence of carbonate complexation and phosphatization
on Sm/Yb ratios. In Marine authigenesis: From Global to Microbial (Eds. C. R. Glenn, L.
Dia A., Gruau G., Olivié-Lauquet G., Riou C., Molénat J. and Curmi P. (2000) The
distribution of rare-earths in groundwater: Assessing the role of source-rock composition,
redox changes and colloidal particles. Geochim. Cosmochim. Acta 24, 4131-4151.
Elbaz-Poulichet F. and Dupuy C. (1999) Behaviour of rare-earths elements at the
freshwater-seawater interface of two acid mine rivers : the Tinto and Odiel (Andalucia, Spain). Appl.
Geochem. 14, 1063-1072.
Elderfield H. (1988) The oceanic chemistry of the rare-earth elements. Trans. R. Soc. London
A 325, 105126
Elderfield H., Hawkesworth C.J., Greaves M.J., and Calvert S.E. (1981) Rare earth element
geochemistry of oceanic ferromanganese nodules and associated sediments. Geochim.
Cosmochim. Acta 45, 513-528
Elderfield H. and Graves M. J. (1982) The rare-earths in seawater. Nature 296, 214-219.
Elderfield H., Upstill-Goddard R. and Sholkovitz E. R. (1990) The rare-earth elements in
rivers, estuaries, and coastal seas and their signifiance to the composition of ocean waters.
Geochim. Cosmochim. Acta 54, 971-991.
Gallet S., Jahn B.-M. and Torii M. (1996) Geochemical characterization of the Luochuan
loess-paleosol sequence, China, and paleoclimatic implications. Chem. Geol. 133, 67-88.
Goldberg E. D., Koide M., Schmitt R. A. and Schmith R. H. (1963) Rare-earth distribution in
the marine environment. J. Geophys. Res. 68, 4209-4217.
Gosselin D. C., Smith M. R., Lepel E. A., Laul J. C. (1992) Rare-earth elements in
chloride-rich groundwater, Palo Duro Basin, TX, ASA. Geochim. Cosmochim. Acta 56,
1495-1505.
Gruau, G., Dia, A., Olivié-Lauqué, G., Davranche, M., Pinay, G., Petitjean, P., Henin, O. and
Le Coz-Bouhnik, M (2004) Controls on the distribution of rare earth elements in shallow
Holser W. T. (1997) Evaluation of the application of rare-earths elements to
paleooceanography. Paleogeol. Paleoclim. Paleoecol. 132, 309-323.
Jahn B.-M., Gallet S., Han J. (2001) Geochemistry of the Xining, Xifeng and Jixian sections,
Loess Plateau of China: eolian dust provenance and paleosol evolution during the last 140
ka. Earth Planet. Sci. Lett. 178, 71-94.
Johannesson K. H. and Lyons W. B. (1994) The rare-earth elements geochemistry of
Monolake water and the importance of carbonate complexing. Limn. Oceanogr. 39,
1141-1154.
Johannesson K. H. and Lyons W. B. (1995) Rare-earth elements geochemistry of Colour lake,
an acidic freshwater lake on Axel Heiberg Island, Northwest Territories, Canada. Chem.
Geol. 119, 209-223.
Johannesson K. H., Stetzenbach K. J., and Hodge V. F. (1995) Speciation of the rare earth
element neodymium in groundwaters of the Nevada Test Site and Yucca Mountain and
implications for actinide solubility. Appl. Geochem. 10, 565-572
Koeppenkastrop D. and De Carlo E. H. (1992) Sorption of rare-earth elements from seawater
onto synthetic mineral particles: An experimental approach. Chem. Geol. 95, 251-263.
Koeppenkastrop D. and De Carlo E. H. (1993) Uptake of rare earth elements from solution by
metal oxides. Environ. Sci. Technol. 27, 1796-1802.
Kuss J., Garbe-Schönberg C-D. and Kremling K. (2001) Rare-earth elements in suspended
particulate material of North Atlantic surface waters. Geochim Cosmochim. Acta 65,
187-199.
Langmuir D. (1997) Aqueous Environmental Geochemistry. Prentice Hall, Upper Saddle
Leybourne M. I., Goodfellow W. D., Boyle D. R. and Hall G. M. (2000) Rapid development
of negative Ce anomalies in surface waters and contrasting REE patterns in groundwaters
associated with Zn-Pb massive sulphide deposits. Appl. Geochem. 15, 695-723.
McLennan S.M. (1994) Rare earth element geochemistry and the ‘tetrad’ effect. Geochim.
Cosmochim. Acta 58, 2025-2033.
Macleod K. G. and Irving A. J. (1996) Correlation of cerium anomalies with indicators of
paleoenvironment. J. Sedim. Res. 66, 948-955.
Moffet J. W. (1990) Microbially mediated cerium oxidation in sea water. Nature 345,
421-423.
Möller P., Paces T., Dulski P. and Morteani G. (2002) Anthropogenic Gd in surface water
drainage system and the water supply of the city of Prague, Czech republic. Environ. Sci.
Technol. 36, 2387-2394.
Morad S. and Felitsyn S. (2001) Identification of primary Ce-anomaly signature in fossil
biogenic apatite: implication for the Cambrian oceanic anoxia and phosphogenesis. Sed.
Geol. 143, 259-264.
Nowack B. and Sigg L. (1996) Adsorption of EDTA and metal-EDTA complexes onto
Goethite. J. Colloid Interface Sci. 177, 106-121.
Ohta A. and Kawabe I. (2000) Rare earth element partitioning between Fe oxyhydroxide
precipitates and aqueous NaCl solutions doped with NaHCO3: Determinations of rare
earth element complexation constants with carbonate ions. Geochem. J. 34, 439-454.
Ohta A. and Kawabe I. (2001) REE(III) adsorption onto Mn dioxide (-MnO2) and Fe
oxyhydroxide: Ce(III) oxidation by -MnO2.Geochim. Cosmochim. Acta. 65, 695-703.
Picard S., Lécuyer C., Barrat J-A., Garcia J-P., Dromart G., and Sheppard S.M.F. (2002) Rare
earth element contents in Jurassic fish and reptile teeth and their potential relation to
Piper D.Z. (1974) Rare earth elements in ferromanganese nodules and other marine phases.
Geochim. Cosmochim. Acta 38, 1007-1022.
Rankin P.C. and Child C. W. (1976) Rare-earth elements in iron-maganese concretions from
some New Zealand soils. Chem. Geol., 18, 55-64.
Schindler P.W. (1990) Co-adsorption of Metal Ions and Organic Ligands: Formation of
Ternary Surface Complexes. In Mineral-Water Interface Geochemistry (Eds. M. F.
Hochella and A.F. White). Mineralogical Soc. Of Am., Whashington D.C., Vol 23, pp.
Sholkovitz E. R. (1995) The aquatic chemistry of rare earth elements in rivers and estuaries.
Aquat. Geochem. 1, 1-34.
Smedley P. L. (1991) The geochemistry of rare earth elements in groundwater from the
Carnmennellis area, southwest England. Geochim. Cosmochim. Acta 55, 2767-2779.
Tang J., Johannesson K. H. (2003) Speciation of rare earth elements in natural terrestrial
waters/ Assesing the role of dissolved organic matter from the modeling approach.
Geochim. Cosmochim. Acta 67, 2321-2339.
Takahashi Y., Minai Y., Ambe S., Makide Y. and Ambe F. (1997) Simultaneous
determination of stability constants of humate complexes with various metal using
multitracer technique. Sci. Total Environ. 198, 61-71.
Takahashi Y., Minai Y., Makide Y. and Ambe F. (1999) Comparison of adsorption behavior
of multiple imorganic ions on kaolinite and silica in the presence of humic acid using the
multitracer technique. Geochim. Cosmochim. Acta 63, 815-836.
Van Middlesworth P. E., Wood S. A. (1998) The aqueous geochemistry of the rare elements
and yttrium. Part 7. REE, Th and U contents in thermal springs associated with the Idaho
batholit. Appl. Geochem. 13, 861-884.
Vermeer A. W. P., Van Riemdjik W. H. and Koopal L. K. (1998) Adsorption of humic acid to
Viers J., Dupré B., Polvé M., Schott J., Dandurand J-L. and Braun J-J. (1997) Chemical
weathering in the drainage basin of a tropical watershed (Nsimi-Zoetele site, Cameroon):
Comparison between organic-poor and arganic-rich waters. Chem. Geol. 140, 181-206.
Wright J., Schrader H. and Holser W. T. (1987) Paleoredox variations in ancient oceans
recorded by rare-earth elements in fossil apatite. Geochim. Cosmochim. Acta 51, 631-644.
Yan X. P., Kerrich R. and Hendry M. J. (2001) Distribution of the rare earth elements in
porewater from a clay-rich aquitard sequence, Saskatchewan, Canada. Chem. Geol. 176,
151-172.
Yeghicheyan D., Carignan J., Valladon M., Bouhnik-Le Coz M., Le Cornec F.,
Castrec-Rouelle M., Robert M., Aquilina L., Aubry E., Churlaud C., Dia A., Deberdt S., Dupré B.,
Frédier R., Gruau G., Hénin O., De Kersabiec A-M., Petitjean P. and Serrat E. (2002) A
compilation of some trace elements measured in natural river water standard SLRS-4
FIGURES CAPTIONS
Fig. 1. Purification procedure of Aldrich humic substances.
Fig. 2. Equilibrium time of Log KREEd inorganic in the suspension of MnO2 and NaCl(a) or
NaNO3 (b) at pH 5, expressing the partitioning of 5 ppb REE between 100 mg MnO2 and
1000 mL water within 2 weeks
Fig. 3. Log KREEd inorganic patterns between MnO2 suspension and NaCl or NaNO3 aqueous
solution plotted vs. increasing atomic number within REE series. Initial concentration of each
REE was 5 ppb and solid phase concentration was 100 mg.L-1. Errors bars correspond to for
two replicates, some errors bars are within the symbol size.
Fig. 4. Equilibrium time of log KREEd organic in the suspension of MnO2 and NaCl (a),
NaNO3 (b) at pH 5 and NaCl (c) at pH 7.5 aqueous solutions, expressing the partitioning of
REE-humate complexes between 100 mg solid and 1000 mL water within 3.5 weeks
Fig. 5. Log KREEd organic pattern in the suspension of MnO2 and NaCl or NaNO3 at pH 5
and 7.5. Errors bars correspond to for three replicates, some errors bars are within the
symbol size.
Fig. 6. Time variation of (Ce) in the suspension of MnO2 and NaCl or NaNO3 at pH 5
inorganic and three replicates in organic experiments, some errors bars are within the size of
the datum symbol.
Fig. 7. Relationships between (Ce), DOC and Mn concentrations in organic-rich, soil
waters from selected catchments from Western Europe, Pleine-Fougères and Kervidy-Naizin
wetland. The dataset from the Kervidy-Naizin catchments was particularly meaningful as no,
or only slight variation of the (Ce) occurred in these soil waters despite the evidence of Mn
oxidation and precipitation as showed by the marked decrease of dissolved Mn concentrations
*: until the solution resistance equals before and after dialysis
Fig. 1.
10 g Aldrich humic acid
1L Milli-Q water 5 mL HCl 5 mL HF Filtration 10 µm Wash, 1M HCl (3 times) Solubilization NaOH, pH 9 Filtration Precipitation 1M HCl, pH2 Centrifugation 7500 rpm, 1H Dialysis* Dowex 50W-X8 Resin Protonated PHA Fulvic acid Silica Soluble minerals 8 H Stirred 24 H Humine Freezed dry 24 H 1 week 2 weeks
2 3 4 5 0 2 4 6 8 10 12 time [day] log Kd [REE ] La Ce Pr Sm
REE as free, inorganic species NaCl aqueous solution
pH 5 2 3 4 5 0 2 4 6 8 10 12 time [day] log Kd [REE ] La Ce Pr Sm
REE as free, inorganic species NaNO3 aqueous solution
pH 5
Fig. 2.
a
2 3 4 5 La Ce Pr Nd Sm Eu Gd Tb Dy Ho Er Tm Yb Lu log Kd [REE ] NaCl NaNO3
REE as free, inorganic species
Fig. 3.
2 3 4 5 0 2 4 6 8 10 12 14 16 18 20 22 time [day] log K d [REE] La Ce Pr Sm DOC
REE as REE(III)-Humate complexes NaCl aqueous solution
pH 5 2 3 4 5 0 2 4 6 8 10 12 14 16 18 20 22 time [day] lo g K d [RE E] La Ce Pr Sm DOC
REE as REE(III)-Humate complexes NaNO3 aqueous solution
pH 5 2 3 4 5 0 2 4 6 8 10 12 time [day] lo g K d [RE E] La Ce Pr Sm DOC
REE as REE(III)-Humate complexes NaCl aqueous solution
pH 7.5 Fig. 4. a a b c
2 3 4 5 La Ce Pr Nd Sm Eu Gd Tb Dy Ho Er Tm Yb Lu log K d [REE ]
NaCl, pH5 NaNO3, pH 5 NaCl, pH 7.5
REE as REE(III)-Humate complexes, pH 5 and 7.5
Fig. 5.
-0.2 0 0.2 0.4 0 5 10 15 20 25 Time [day]
organic (NaCl) organic (NaNO3)
inorganic (NaCl) inorganic (NaNO3)
Fig. 6.
(C
-0.2 0 0.2 0.4 0 10 20 30 40 50 60 70 Mn (mM) 0 100 200 300 400 Eh (mV) Pleine-Fougères Eh Mn oxidation -0.4 -0.2 0 0.2 0.4 0 0.5 1 1.5 2 2.5 3 Mn (mM) 0 100 200 300 400 Eh (mV) Kervidy-Naizin Eh Mn oxidation -0.4 -0.2 0 0.2 0.4 0 20 40 60 DOC (mg.L-1) Pleine-Fougères Kervidy-Naizin Fig.7. a b c (C e) (C e) (C e)
Appendix 1 – Mass analyses and instrumental errors
Rare earth concentrations were determined using an Agilent TechnologiesTM HP4500
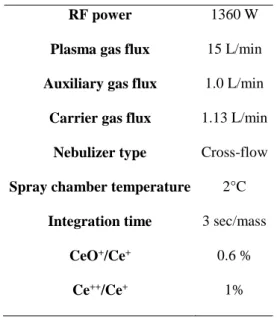
ICP-MS Normal plasma conditions were used, with the instrumental parameters reported in Table 1.
Table 1. Instrumental and data acquisition parameters
RF power 1360 W
Plasma gas flux 15 L/min
Auxiliary gas flux 1.0 L/min
Carrier gas flux 1.13 L/min
Nebulizer type Cross-flow
Spray chamber temperature 2°C
Integration time 3 sec/mass
CeO+/Ce+ 0.6 %
Ce++/Ce+ 1%
Quantitative analyses were performed using a conventional external calibration procedure.
Three external standard solutions displaying REE concentrations similar to those of the samples
analysed in this study were prepared from a multi-REE standard solution (Accu TraceTM
Reference,10 mg.L-1, USA). Indium was added to all samples as an internal standard at a
concentration level of 0.87 M (100 ppb) to correct for instrumental drift and possible matrice
effects. Indium was also added to external standard solutions. Calibration curves were calculated
from measured REE/Indium intensity ratios.
Detection limits (DL) of the Agilent Technologies ICP-MS set up at Rennes University
B S C SD L pmol DL 3 . ) . ( 1 (5)
where SD is the standard deviation obtained during instrumental blank measurements, C the
REE concentration of a standard solution (between 29 and 36 pM depending of the REE), S and
B, the ion counts obtained during standard solution and instrumental blank analyses,
respectively.
Table 2. Detection limits and chemical blanks (in pM) measured during the course of this
study Isotope DL Chemical Blanks La 139 1.15 4.37 Ce 140 3.21 5.71 Pr 141 0.64 2.35 Nd 146 3.54 7.28 Sm 147 5.52 0.64 Eu 153 0.92 0.76 Gd 158 2.67 2.07 Tb 159 0.38 1.50 Dy 163 1.29 2.76 Ho 165 0.49 1.08 Er 166 1.26 0.88 Tm 169 0.59 1.27 Yb 174 1.44 1.14 Lu 175 0.51 0.85 DL: detection limits
Chemical blanks of individual REE were all lower than 10 pM which is negligible (Table
2), being by three to four orders of magnitude lower than concentrations measured in the
synthetic solutions used in the adsorption experiments.
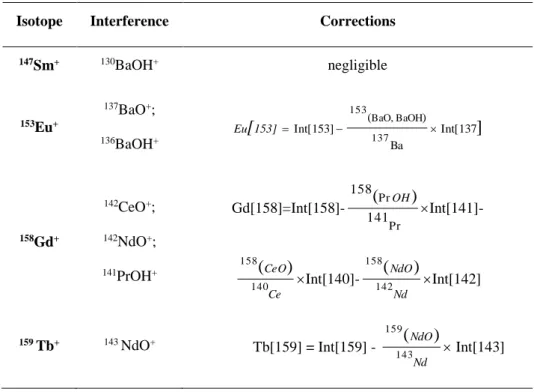
Isobaric interferences due to the formation and ionisation of oxides and/or hydroxides in
given in Table 3 along with the equations used in our laboratory to correct REE concentrations
from this potential error source. Note that Ce and its neighbours La and Pr - and thus the
calculation of the Ce anomaly - are not affected by isobaric interference problems. There was no
need for BaO and/or BaOH corrections onto Eu and Sm as our synthetic solutions did not
contain any Ba.
Table 3. Summary of isobaric interferences encountered during REE analysis and correction
equations used at Rennes University to correct measured concentrations from this effect
Isotope Interference Corrections
147Sm+ 130BaOH+ negligible 153Eu+ 137BaO+; 136BaOH+ ] Int[137 Ba ) ( Int[153] 137 BaOH BaO, 153 153] Eu[ 158Gd+ 142CeO+; 142NdO+; 141PrOH+ Gd[158]=Int[158]-Pr Pr 141 158 ) ( OH Int[141]-Ce CeO 140 158 ) ( Int[140]-Nd NdO 142 158 ) ( Int[142] 159 Tb+ 143 NdO+ Tb[159] = Int[159] - Nd NdO 143 159 ) ( Int[143]
Amplitude and efficiency of the Gd and Tb corrections can be evaluated from Table 4
where measured and corrected concentrations of Gd and Tb obtained for the SLRS-4 water
geostandard are pooled together. Correction amplitudes are moderate, being 6% for Gd and only
2% for Tb, with the corrected values being in both cases by 2.5% within the range of the
reference values published for the SLRS-4 water geostandard (Yeghicheyan et al.. 2001). These
[Interfering Element]/[Interfered Element] are close to unity in our synthetic solutions against 10
to 65 in the SLRS-4 geostandard.
Table 4. Amplitude and efficiency of oxyde and hydroxide corrections on Gd and Tb during
analysis of SLRS-4 water standard. Concentrations are in nM.
Isotope Reference values* Measured values Corrected values Correction (%) Gd 158 0.210 0.228 0.213 6.4 Tb 159 0.026 0.026 0.026 2.4 * Yeghicheyan et al. (2001)
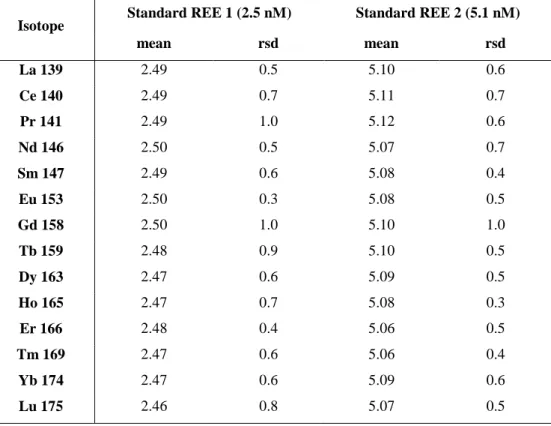
Table 5. Replicates analyses (n=10) of multi-REE standard solution (Accu TraceTM
Reference, USA). Concentrations are in nM.
Isotope Standard REE 1 (2.5 nM) Standard REE 2 (5.1 nM)
mean rsd mean rsd La 139 2.49 0.5 5.10 0.6 Ce 140 2.49 0.7 5.11 0.7 Pr 141 2.49 1.0 5.12 0.6 Nd 146 2.50 0.5 5.07 0.7 Sm 147 2.49 0.6 5.08 0.4 Eu 153 2.50 0.3 5.08 0.5 Gd 158 2.50 1.0 5.10 1.0 Tb 159 2.48 0.9 5.10 0.5 Dy 163 2.47 0.6 5.09 0.5 Ho 165 2.47 0.7 5.08 0.3 Er 166 2.48 0.4 5.06 0.5 Tm 169 2.47 0.6 5.06 0.4 Yb 174 2.47 0.6 5.09 0.6 Lu 175 2.46 0.8 5.07 0.5
Finally, the overall validity of the analytical procedure can be checked from Table 5 where
replicates analyses (n=10) of multi-REE standard solution (Accu TraceTM Reference, USA) are
reported and from Table 6 where concentrations of the SLRS-4 standard measured during the course
of this study are compared with published reference values (Yeghicheyan et al., 2001). Altogether,
these two tables show that the instrumental error on REE analysis in our laboratory is < 2%.
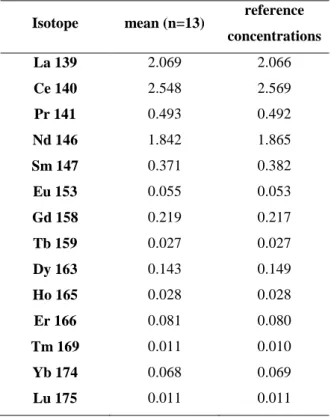
Table 6. Comparison of the analytical accuracy of the Agilent Technology HP4500
ICP-MS set up at Rennes University against published reference values of the SLRS-4 water
geostandard. Concentrations are in nM.
Isotope mean (n=13) reference
concentrations La 139 2.069 2.066 Ce 140 2.548 2.569 Pr 141 0.493 0.492 Nd 146 1.842 1.865 Sm 147 0.371 0.382 Eu 153 0.055 0.053 Gd 158 0.219 0.217 Tb 159 0.027 0.027 Dy 163 0.143 0.149 Ho 165 0.028 0.028 Er 166 0.081 0.080 Tm 169 0.011 0.010 Yb 174 0.068 0.069 Lu 175 0.011 0.011
Appendix 2 – Reproducibility of adsorption experiments
Equilibrium log KdREE values obtained during duplicate and triplicate experiments
this study are presented in Tables 7 (REE(III) occurring as free, inorganic species) and 8
(REE(III) as REE(III)-Humate complexes). The two tables show that the overall experimental
uncertainties on the Log KdREE values discussed in this paper is better than 10%.
Equilibrium log KdDOCvalues were also monitored in the adsorption experiments using
REE as REE(III)-humate coomplexes. Table 9 shows that the overall analytical uncertainties
obtained on this parameter as determined from triplicate run results is better than 10%.
Table 7. Reproducibility of log Kd(REE, inorganic) at pH 5.
inorganic, NaCl, pH 5 inorganic, NaNO3, pH 5
A B mean rsd A B mean rsd La 3.15 3.50 3.32 7.46 3.32 3.29 3.30 0.45 Ce 4.07 4.22 4.14 2.62 4.14 3.96 4.05 3.23 Pr 3.54 3.71 3.63 3.48 3.55 3.51 3.53 0.71 Nd 3.57 3.73 3.65 3.16 3.55 3.53 3.54 0.43 Sm 3.71 3.86 3.79 2.85 3.67 3.66 3.66 0.19 Eu 3.73 3.86 3.80 2.54 3.68 3.68 3.68 0.02 Gd 3.59 3.76 3.68 3.40 3.58 3.56 3.57 0.38 Tb 3.58 3.75 3.67 3.35 3.55 3.55 3.55 0.03 Dy 3.60 3.76 3.68 3.07 3.56 3.57 3.56 0.28 Ho 3.49 3.70 3.59 4.15 3.49 3.49 3.49 0.14 Er 3.50 3.71 3.61 4.07 3.52 3.50 3.51 0.26 Tm 3.52 3.73 3.62 3.98 3.53 3.51 3.52 0.40 Yb 3.57 3.75 3.66 3.55 3.57 3.56 3.56 0.25 Lu 3.56 3.76 3.66 3.77 3.56 3.55 3.56 0.07
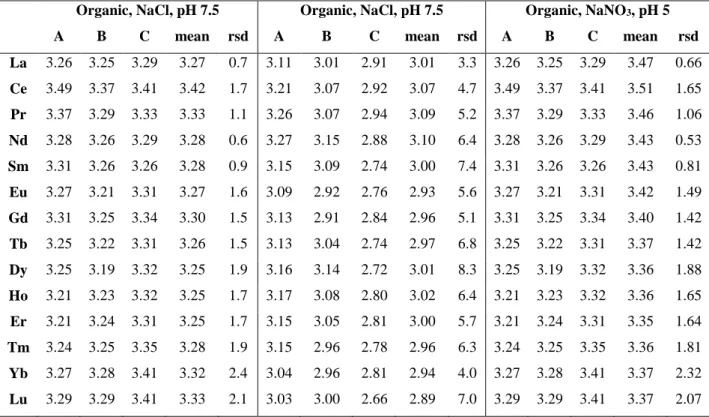
Table 8. Reproducibility of log Kd(REE, organic) at pH 5 and 7.5
Organic, NaCl, pH 7.5 Organic, NaCl, pH 7.5 Organic, NaNO3, pH 5
A B C mean rsd A B C mean rsd A B C mean rsd
La 3.26 3.25 3.29 3.27 0.7 3.11 3.01 2.91 3.01 3.3 3.26 3.25 3.29 3.47 0.66 Ce 3.49 3.37 3.41 3.42 1.7 3.21 3.07 2.92 3.07 4.7 3.49 3.37 3.41 3.51 1.65 Pr 3.37 3.29 3.33 3.33 1.1 3.26 3.07 2.94 3.09 5.2 3.37 3.29 3.33 3.46 1.06 Nd 3.28 3.26 3.29 3.28 0.6 3.27 3.15 2.88 3.10 6.4 3.28 3.26 3.29 3.43 0.53 Sm 3.31 3.26 3.26 3.28 0.9 3.15 3.09 2.74 3.00 7.4 3.31 3.26 3.26 3.43 0.81 Eu 3.27 3.21 3.31 3.27 1.6 3.09 2.92 2.76 2.93 5.6 3.27 3.21 3.31 3.42 1.49 Gd 3.31 3.25 3.34 3.30 1.5 3.13 2.91 2.84 2.96 5.1 3.31 3.25 3.34 3.40 1.42 Tb 3.25 3.22 3.31 3.26 1.5 3.13 3.04 2.74 2.97 6.8 3.25 3.22 3.31 3.37 1.42 Dy 3.25 3.19 3.32 3.25 1.9 3.16 3.14 2.72 3.01 8.3 3.25 3.19 3.32 3.36 1.88 Ho 3.21 3.23 3.32 3.25 1.7 3.17 3.08 2.80 3.02 6.4 3.21 3.23 3.32 3.36 1.65 Er 3.21 3.24 3.31 3.25 1.7 3.15 3.05 2.81 3.00 5.7 3.21 3.24 3.31 3.35 1.64 Tm 3.24 3.25 3.35 3.28 1.9 3.15 2.96 2.78 2.96 6.3 3.24 3.25 3.35 3.36 1.81 Yb 3.27 3.28 3.41 3.32 2.4 3.04 2.96 2.81 2.94 4.0 3.27 3.28 3.41 3.37 2.32 Lu 3.29 3.29 3.41 3.33 2.1 3.03 3.00 2.66 2.89 7.0 3.29 3.29 3.41 3.37 2.07
rsd: relative standard deviation
Table 9. Reproducibiliy of log KdOC at pH 5 et 7.5. See text for explanations
A B C mean rsd
NaCl, pH 5 3.46 3.53 3.56 3.52 1.4
NaNO3, pH 5 3.56 3.74 3.52 3.61 3.2 NaCl, pH 7.5 3.36 3.00 2.96 3.11 7.2