Development and Testing of Microscale Silicon Heat Exchangers for the MIT Micro Gas-Turbine Engine
by Shaun Sullivan
B.S. Mechanical Engineering (1998) Rensselaer Polytechnic Institute
Submitted to the Department of Mechanical Engineering in Partial Fulfillment of the Requirements for the Degree of
Master of Science in Mechanical Engineering. at the
Massachusetts Institute of Technology September 30, 2000
C 2000 Massachusetts Institute of Technology All rights reserved
Signature of Author... Certified by. BARKER MASSACHUSETTS INSTITUTE OF TECHNOLOGY JUL 16 2001 LIBRARIES ...
Department of Mechanical Engineering September 30, 2000
... John G. Brisson Professor of Mechanical Engineering Thesis Supervisor
Accepted by... ...
Ain A. Sonin Chairman, Department Committee on Graduate Students
Development and Testing of Microscale Silicon Heat Exchangers for the MIT Micro Gas-Turbine Engine
by Shaun Sullivan
Submitted to the Department of Mechanical Engineering on September 30, 2000 in Partial Fulfillment of the Requirements for the Degree of Master of Science in
Mechanical Engineering.
Abstract
Micro-scale silicon heat exchangers were designed, modeled using conventional heat transfer and fluid mechanics correlations, fabricated in the MIT Microtechnologies Laboratory, and tested as part of the MIT micro-gas turbine engine project.
Heat transfer and pressure drop experiments were carried out to measure the performance of these heat exchangers, and to validate the predictions of the model. The tested heat exchanger was 2 centimeters by 3 centimeters by 4 mm in size, and housed 220
individual heat transfer passages (110 in each direction). The heat transfer passages were rectangular in cross-section, with lengths of 7mm, widths between 100 and 150
micrometers, and depths of about 190 micrometers.
In actual microengine application, the heat exchangers might experience temperatures as high as 1400K. In the tests conducted for this project, the temperatures were limited to 350K. Results demonstrated a heat transfer rate of about 0.5 watts. Under the test conditions, this corresponds to a heat exchanger effectiveness of about 52%, which is within the experimental margin of error of the 50.5% value predicted by the model. These results indicate that the addition of a recuperative heat exchanger to the MIT micro gas turbine engine could provide a benefit to the fuel efficiency of the engine cycle. Thesis Supervisor: John G. Brisson
Acknowledgements
My sincere and heartfelt thanks go out to those individuals (whether mentioned here or inadvertently forgotten), who have given me the support and encouragement needed to produce this work: to Professor Brisson, for his time, assistance, direction, and patience; to Amit Mehra, for his assistance and experience at the beginning of my project; to my parents, who years ago gave me motivation and taught me the value of fulfilling one's own potential; to my sister, who has been my constant friend her entire life; to my friends, for their support and their diversions; and above all to the one who shared every day of this undertaking with me, Lauren Nicole, for her understanding, patience,
Table of Contents
Abstract ... 2
A cknow ledgem ents ... 3
T able of C ontents ... . 4
L ist of F igures ... 6
List of Tables ... 8
L ist of Sym bols ... 9
C hapter 1: Introduction ... 10
1.1 Counterflow Heat Exchangers ... 11
1.2 Practical A pplications ... 13
1.3 Application to the Microengine ... 13
1.4 Contributions of this Thesis ... 19
1.5 Thesis O rganization ... 20
C hapter 2: M odeling ... 2 1 2.1 Modeling and Design Overview ... 21
2.2 Linear Design Modeling ... 23
2.3 Radial Design Modeling ... 28
2.4 Correlation V alidation ... 28
2.5 M odel O verview ... 29
2.6 Pressure Considerations ... 32
2.7 Structural Considerations ... 34
2.8 Cycle Im plications ... 35
2.9 Modeling Results and Design ... 37
C hapter 3: Fabrication ... 42 3.1 Fabrication Process ... 42 Chapter 4: Experimentation ... 54 4 .1 L ay out ... 5 5 4.2 Effectiveness Measurements ... 56 4.3 Pressure Measurements ... 60
4.4 Experim ental Error ... 61
4 .5 P ackaging ... 62
4.6 Instrum entation ... 70
4.7 D ata A cquisition ... 72
4.8 System Flexibility ... 74
4.9 Experimental Procedure ... 75
4.10 Verification of Experimental Setup ... 75
Chapter 5: Experimental Results ... 77
5.1 Preliminary Pressure Drop Results ... 77
Table of Contents, continued
5.3 Additional Heat Transfer Results ... 82
Chapter 6: Parallel Investigations ... 85
Chapter 7: Summary and Future Work ... 88
7.1 Modeling Summary ... 88
7.2 Fabrication Summary ... 89
7.3 Experimental Apparatus Summary ... 90
7.4 Experimental Testing Summary ... 90
7.5 Summary of Parallel Investigations ... 91
7.6 Challenges, Recommendations, and Future Work ... 91
7.7 C onclusions ... 93
Appendix A: Linear Recuperator Computer Model ... 94
Appendix B: Radial Recuperator Computer Model ... 96
Appendix C: Experimental Error Example ... 102
Appendix D: Experimental Data Set ... 107 R eferen ces ... 10 8
List of Figures Figure 1.1 Figure 1.2 Figure 1.3 Figure 1.4 Figure 1.5 Figure 1.6 Figure 2.1 Figure 2.2 Figure 2.3 Figure 2.4 Figure 2.5 Figure 2.6 Figure 2.7 Figure 2.8 Figure 2.9 Figure 2.10 Figure 2.11 Figure 3.1 Figure 3.2 Figure 3.3 Figure 3.4 Figure 3.5 Figure 3.6 Figure 3.7 Figure 3.8 Figure 4.1 Figure 4.2 Figure 4.3 Figure 4.4 Figure 4.5 Figure 4.6 Figure 4.7 Figure 4.8 Figure 4.9
Counterflow Heat Exchanger Design ...
Schematic Diagram of an Unrecuperated Gas Turbine Engine .... T-s Diagram of an Unrecuperated Brayton Cycle ...
Schematic Diagram of a Recuperated Gas Turbine Engine
T-s Diagram of a Recuperated Brayton Cycle ... Design Sketch for the Recuperated Microengine ...
Schematic Radial and Linear Recuperators ... Recuperator Passageway Cutaway Diagram ... Axial Conduction Effects ... PR and e vs. Channel Depth ... PR and e vs. Passage Width ... PR and e vs. Coverplate Thickness ... B uckling M odels ... TSFC vs. Thrust, PR, and e ... PSFC vs. Power, PR, and e ... Linear Recuperator Exploded View ... Close-up of Linear Recuperator Passages ... Recuperator Fabrication Steps ... Channel Deep Etching ... Contaminated Level 2 Wafer ... Two-Mask Method of Channel Etching ... Level 3 Wafer with Undercut Walls ... Infrared Photographs of Recuperator Wafer Stacks ... Completed Recuperators Prior to Packaging ... SEM Photographs of Recuperator Features ... Experim ental Setup ... Schematic Diagram of Experimental Apparatus ... Control Volume for Measuring e using Heater 2 ... Heat Loss Correlation Data ... G lass Sealing M ethod ... Fractured G lass Seals ... Recuperator Sealing Assembly, Exploded View ... Kovar Tube Finning Model ... Fin Effectiveness of Kovar Tubing ...
11 14 15 16 17 18 23 24 27 31 31 32 34 36 37 39 40 44 45 47 47 48 49 50 52 54 55 57 60 63 64 66 67 68
List of Figures, continued Figure 4.10 Figure 4.11 Figure 4.12 Figure 4.13 Figure 4.14 Figure 4.15 Figure 4.16 Figure 4.17 Figure 5.1 Figure 5.2 Figure 5.3 Figure 5.4 Figure 5.5 Figure 5.6 Figure 6.1 Figure 6.2 Figure 7.1
Braze Wetting to Stainless Steel ... Fully Packaged Recuperators ... Nested Instrumentation Technique ... Instrumentation Extraction Technique ... Feedback Control Loop Diagram ... Labview Program Diagram ... Labview Control Environment ... Experimental Setup Validation Data ... Pressure Drop Test Results ... Kovar Mounting Methods ... Current Kovar Mounting Scheme ... Steady State Effectivness Test ... Temperature Values During Test ... Effectiveness vs. Time, t=74 to t=78.5 ...
Silicon Dioxide Deposition Process ... Hybrid Silicon-Silicon Dioxide Structures ...
Suggested Kovar Mounting Scheme ...
69 69 71 71 72 73 74 76 78 79 79 81 82 83 85 86 92
List of Tables
Table 1.1 Benefits of Recuperating ... 18
Table 2.1 Baseline Conditions ... 30
Table 2.2 Design Specifications for Linear Recuperators ... 40
Table 2.3 Design Specifications for Radial Recuperators ... 41
Table 3.1 Completed Recuperator Feature Dimensions ... 51
Table 4.1 Instrum ent Error ... 61
Table 4.2 Range of Recuperator Inlet Flow Properties ... 74
Table C. 1 Error Calculation Variables ... 104
Table C.2 Effectiveness Measurements and their Uncertainties ... 104
Table C.3
Q,.
Variables and their Uncertainty ... 105Table C.4 and its Uncertainty ... 105
Table C.5 Q Variables and their Uncertainty ... 105
Table C.6 and its Uncertainty ... 106
Table C.7 Effectiveness Variables and their Uncertainties ... 106
List of Symbols
q Heat or energy transfer
rh Mass flow rate
CP Specific heat at constant pressure
C thc,
T Temperature
F, Effectiveness
P Pressure
PR Pressure Ratio = Pout/Pin f Friction Factor Dh Hydraulic Diameter p Density v Velocity p Kinematic Viscosity pam Micrometers Re Reynold's Number A Area w Width H Height
t Channel wall thickness Num Number of Channels NTU Number of Transfer Units
Kroeger's deterioration coefficient h Convection Coefficient
k Thermal Conductivity
r Spatial variable -radius
Pressure Multiplier W Watts m Meter K Degree Kelvin P Power V Voltage I Current
P
Bulk radiation coefficient a Boltzman's constant F View factore emissivity P Perimeter
1.0 Introduction
The fabrication techniques used to manufacture integrated circuits have seen new application as a means for creating miniature mechanical and electromechanical devices out of silicon. These processes can achieve tolerances that are much smaller than what is currently attainable using conventional techniques. This precision has given birth to a whole new breed of mechanical and electromechanical devices which are an order of magnitude smaller than any of their antecedents.
Work is currently being done at MIT to develop a miniature gas turbine engine. The engine is fabricated entirely out of silicon using microfabrication methods. All of the engine's 3-dimensional features, including the combustion chamber, compressor blades, and turbine blades, are etched directly into silicon. Functional microbearings have already been built and spun up to 1.5 million RPM (design speed is 2.25 million RPM),
and the combustion chamber has been shown to support continuous burning of hydrogen fuel [1]. Eventually running on hydrocarbon fuels, these devices may be used as jet
engines for micro air vehicles and as portable electric power sources in place of batteries. The design, fabrication, and testing of small-scale heat exchangers is a part of the
microengine project. First generation engines will be tested without these miniature heat exchangers, but their inclusion in later generations of microturbines could significantly improve the overall fuel efficiency of the engine cycle.
Although there is a growing collection of work on the subject of miniature heat exchangers, this project is characterized by several new aspects. The heat exchangers under investigation here have feature sizes of ten micrometers or less, which are
considerably smaller than those found in previously published studies. Additionally, the flow temperatures are measured directly within the heat exchangers themselves, near the inlets and outlets to the actual heat transfer passages; other investigations have inferred the temperatures using less-direct techniques. Finally, this investigation is closely tied to a practical application, the MIT micro gas turbine engine. As a result, once its
performance has been evaluated, the anticipated benefit of utilizing a heat exchanger with the system can be determined quickly.
1.1 Counterflow Heat Exchangers
In essence, a heat exchanger is designed to allow the exchange of heat energy between two fluids at different temperatures. In the case of the heat exchangers being considered for the microengine project, the intent is to extract heat from one gas flow and transfer it to another gas flow. Typically, this is accomplished by running the two flows in close proximity to one another, such that heat energy can conduct through a wall separating them.
A counterflow heat exchanger is characterized by the two flows running parallel to each other, but in opposite directions. Consequently, the two flows enter the heat exchanger at opposite ends. If the product of the mass flow rate and the specific heat is the same for each flow, the flows are said to be balanced. With perfect heat transfer and zero losses, each flow in the balanced case exits the heat exchanger at the same that he other one enters at. That is, the exit temperature of each flow would correspond to the inlet temperature of the other flow. Any real heat exchanger cannot live up to the ideal, however, and so there is a figure of merit used to quantify the performance of a heat exchanger as compared to this ideal. This figure of merit is the effectiveness, which is
described as the ratio of the heat that is actually transferred from one flow to the other flow, to the maximum amount of heat that could be transferred if the system were perfect.
...
FIGURE 1.1 - Counterflow Heat Exchanger Design [2] - Two streams are passed in close proximity to each other, running in opposite directions. Thermal energy from
This maximum is associated with the ideal case, in which the temperature changes from one flow's inlet temperature to the inlet temperature of the other flow:
qmax =:--T3~ M~-TI) 1.1
where T, is the inlet temperature of the colder flow, T3 is the inlet temperature of the
hotter flow, and both the mass flow and specific heat value correspond to the whichever flow has the smaller value of the product rhcp; this product may also be written Cmin. The effectiveness, assuming constant cp, is defined as:
qactuai rCp(Toutlt - Tinlet ) either stream 1.2
qmx Cm Mm(T - T)
where Cmin is (hc,)ho, flow or (thc,) codflowI whichever is smaller. The flow with a smaller value of rhc, will experience the greater temperature change per unit of heat transferred than a flow with a larger value of rhc, ; therefore, the flow characterized by Cmin could reach its final temperature, equal to the inlet temperature of the other flow, prior to the end of the heat exchanger. In this situation there would be no additional heat transferred in the remaining length of the heat exchanger. Since no additional temperature change will take place, this value represents the maximum heat transfer possible.
The effectiveness, as a ratio, is a dimensionless number between 0 and 1. An
effectiveness of zero corresponds to a heat exchanger which does not convey any energy from one stream to the other. An effectiveness of one corresponds to an ideal heat exchanger, in which the maximum heat transfer possible is achieved.
The other figure of merit that is useful when describing the performance of a heat exchanger is the pressure drop. When used in conjunction with other components, the pressure losses in the heat exchanger can have a dramatic impact on the overall
performance of a system. Some applications, such as the microengine, are sensitive to even very small pressure drops.
These pressure drops can also be expressed as ratios of the outlet pressure to the inlet pressure.
P t P -AP 1.3
PR-= '
Pi Pn
This Pressure Ratio, like the effectiveness, is a dimensionless number between 0 and 1, with 1 being an ideal case with no pressure drop. Therefore, a 0.95 or 95% pressure ratio corresponds to a 0.05 or 5% pressure drop.
1.2 Practical Applications
Although the emphasis of this project has been on recuperator designs intended for use in a power cycle, heat exchangers can be used in a variety of other applications. Any system in which a fluid needs to be heated might possibly benefit from a heat exchanger, provided that there is an available source of heat somewhere else in the system. Rather than supply additional heat to raise the flow temperature, recovering excess heat from another area in the system can result in reduced energy costs. Other applications which make use of heat exchangers include space heating, air-conditioning, refrigeration, chemical processing, and automotive cooling.
As mentioned previously, the intent in the MIT Microengine project is to produce a functioning microscale silicon gas turbine engine that is contained in a 2-centimeter square package. The use of a recuperative heat exchanger is a common practice in gas turbine engine cycles. By making use of the energy in the high temperature exhaust gases, the overall fuel efficiency of the system can be improved.
Proposed uses for this engine are numerous. Among the proposals are: as a jet engine for a six-inch-long semi-autonomous reconnaissance airplane for use by the army, and as a portable electrical power source capable of producing 50 Watts by burning a hydrocarbon fuel [3].
One of the added benefits of devices this size is that they have very little mass. The mass is proportional to the size of the engine cubed, while surface area is only proportional to the size of the device squared. Therefore the smaller then engine is, the greater the ratio of surface area to mass. High values of heat transfer per unit mass can therefore be effected in miniaturized designs.
Conventional aircraft engines do not use recuperators, since their addition would significantly increase the mass of the plane. A silicon microrecuperator, on the other hand, is extremely light, and can be fabricated as part of the engine design itself. The size and weight of the added recuperator are both small, and do not preclude its inclusion in a micro air vehicle or other lightweight application.
1.3 Application to the Microengine
A schematic diagram of the gas turbine Brayton Cycle is shown in Figure 1.2. Incoming air passes through the compressor (1-+2), where its pressure is increased. This high pressure air enters the combustor (2-+3), at which point fuel is added and the mixture is
burned. The heat addition from the burning fuel increases the internal energy of the air; expansion of the hot air through the turbine blades (3-+4) causes the shaft to rotate. Finally, the gas, now at relatively low pressure, is vented to the atmosphere (4-+1). Shaft power not used by the compressor can be applied to a generator in power systems;
alternatively, the high-enthalpy gas can be vented through the aft end of the engine, providing the thrust necessary in jet-engine applications.
The same ideal process can be represented on a T-s diagram, as shown in Figure 1.3. Incoming air is isentropically compressed from point 1 to point 2. Heat is added from point 2 to point 3, which represents the burning of fuel in the combustion chamber. The hot gases are then passed through a turbine to extract the power needed to run the compressor; this is represented by the isentropic expansion from point 3 to point 4. Finally, the hot exhaust gases are vented to the atmosphere, rejecting heat from point 4 to point 1. These hot exhaust gases can be used to supply more power to the turbine and operate a generator system, or they can be vectored for thrust.
The exhaust gas is vented at a temperature that is elevated relative to the environment. This higher-temperature gas contains thermal energy that is discarded by the engine, but which could be used to increase the engine efficiency. This thermal energy is reclaimed
Q
0- Combustor
Exhaust
Intake Air
-o Compressor Turb ne
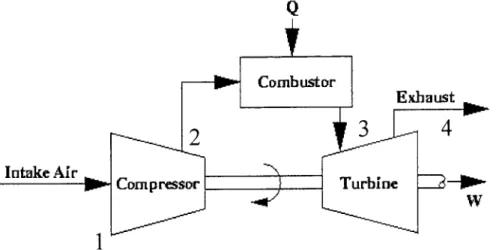
FIGURE 1.2 - Schematic Diagram of an Unrecuperated Gas Turbine Engine. Inlet air is compressed (1-*2), fuel is added and the resulting mixture is burned in the combustor (2-+3), the hot gases are expanded through the turbine (3-+4) and finally vented to the atmosphere (4-+1).
3 T Qadded 2 Qrejected 1 S
FIGURE 1.3 - T-s Diagram of an Unrecuperated Brayton (Gas Turbine Engine) Cycle. Gas is inentropically compressed from point 1 to point 2, heat is added (through combustion) from point 2 to point 3, the gas is isentropically expanded through the turbine from point 3 to point 4, and finally exhausted to the atmosphere (point 4 to point 1).
by the recuperator by taking the exhaust gases and passing them in close proximity to the compressed air before it enters the combustion chamber. Energy from the exhaust stream is transferred into the compressed gas flow, raising its temperature. When this preheated compressed gas stream enters the combustion chamber, less heat needs to be added to bring it up to combustion temperature; consequently less fuel needs to be burned by the engine.
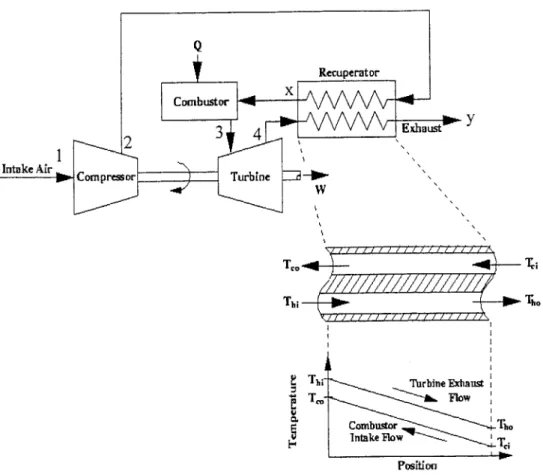
Figure 1.4 shows a diagram of a recuperated gas turbine system. The system looks similar to the unrecuperated cycle, with the addition of the heat exchanger between the compressor and the combustor (between points 2 and 3). Also depicted in the diagram is a schematic representation of the heat exchanger itself, showing the two streams passing by each other. A typical temperature profile that might be found in the system is also shown. Note that the inlet temperature of the exhaust gas stream enters the heat exchanger at a much higher temperature than the pre-combustor gas stream does; however, at the exits, the pre-combustor gas stream exiting the recuperator has a higher temperature than the exiting exhaust stream.
Q
Recuperator Combustor
3 4 Exhaust
Intake Air Compressor Turbine ~~
Turbin
Thi -- Th.
SThr Turbine Exhaust
L
CL Combustor Inak Flow Tb
Position
FIGURE 1.4 - Schematic Diagram of a Recuperated Gas Turbine Engine. The hot exhaust gas entering the recuperator heats the cooler compressed gas flow. After exiting the recuperator, the compressed gas has a higher temperature than the exhaust flow.
Figure 1.5 shows the T-s diagram of this recuperated Brayton cycle. The exhaust gas is passed through the recuperator, which extracts heat from the flow prior to venting it to the atmosphere. This cooling takes the exhaust gas from point 4 to point y, reducing the amount of waste energy discarded to the environment. Simultaneously, the removed heat energy is added to the compressed gas flow prior to entering the combustion chamber, which brings the gas from point 2 to point x. As a result, the gas temperature only needs to be raised from point x to point 3, which requires less fuel.
By transferring this heat energy, the recuperator has the potential to benefit the overall cycle fuel efficiency. However, in order to have a net positive impact, the recuperator cannot introduce a major pressure drop to the gas flows. Any pressure drop in the recuperator will reduce the combustion and turbine efficiencies, possibly harming the performance of the engine more than the heat transfer improves it.
3 Qadded T 4 X 1 Q rejected S
FIGURE 1.5 - T-s Diagram of a Recuperated Brayton (Gas Turbine Engine) Cycle. After compression, the gas is heated from point 2 to point x while passing through
the recuperator, and then heated from point x to point 3 in the combustor.
Similarly, after expansion, the gas cools from point 4 to point y in the recuperator (by transferring its energy to the pre-combustor flow), and then exhausts to the atmosphere
Determining whether a particular recuperator design will improve the engine's
performance or not requires the use of cycle analysis data. The MIT Microengine Group has already developed models which predict the performance of the engine based on gas
conditions throughout the engine; using the recuperator performance model, the gas
conditions entering the combustor can be predicted, and the effects of these changes on the overall cycle can be analyzed. By comparing the relative impact of various
recuperator designs, a geometry can be selected which provides the greatest benefit to the engine cycle.
Table 1.1 shows the performance of the unrecuperated microengine, and the potential for performance improvement with the addition of a recuperator [4]. While the thrust (or power) is decreased when a recuperator is added, the amount of fuel needed by the system is reduced by up to 75%.
Unrecuperated Recuperated VtEngine pEngine (Ideal)
Pressure Ratio 1.8 1.8
Thrust (grams force) 11 8
Power (Watts) 17 8
Fuel Bum (H2) (grams/hour) 16 4
Fuel Bum (HC) (grams/hour) 40 10
Air Flow (grams/second) 0.36 0.36
Turbine Inlet Temp. (K) 1600 1600
Exhaust Gas Temperature (K) 1243 800
Thermal Efficiency (%) 3 6
TABLE 1.1 - Operating characteristics of the unrecuperated microengine and an ideally recuperated microengine. The addition of a recuperator decreases the overall useful output (thrust or power) of the engine, but simultaneously reduces the amount of fuel needed by the engine.
In its original conception, shown in Figure 1.6, the recuperator was located on the aft end of the microengine. The static engine structure is shaded gray in the figure, the rotating compressor and turbine spool is hatched, and the recuperator is shown shaded black. The compressed air, prior to entering the combustor, is distributed into radial passages in the recuperator. This air then flows radially towards the center of the engine, before
doubling back to enter the combustor. After passing through the turbine, the hot exhaust gases enter the recuperator as the second flow, traveling radially outwards from the center of the recuperator. The exhaust gases transfer heat energy to the pre-combustor gases as
5
FIGURE 1.6 - Design Sketch for the Recuperated Microengine. The Recuperator (colored black) is attached to the aft end of the engine. Radial flow passages alternate pre-combustor compressed gas and exhaust gas flows.
I ... ... ... ... ... . ... .... ....... ... ... [7- 7 W MOM 111*':.- i
the flows pass alongside each other in alternating channels. This design utilizes the fact that the compressed air flow is already annularly distributed, and can be easily delivered into a series of axisymmetric heat transfer passages. Most of the work done for this project was performed with the assumption that the final recuperator geometry would be similar to this design.
1.4 Contributions of this Thesis
This thesis makes four significant contributions to the study of microscale heat exchangers. The first is proof of principle of the feasibility of fabricating silicon
recuperators with geometries like the ones considered here. Heat exchangers with feature dimensions of this scale, and composed entirely of diffusion-bonded layers of silicon, are a relatively new concept. Significant work was needed in order to demonstrate that such a recuperator could be built. The fabrication processes, challenges, and results are presented in a level of detail which could easily be adapted to similar heat exchanger
geometries.
The second contribution is the development of first-order modeling tools which can be used to anticipate the performance of this type of recuperator. The microengine design is
evolving rapidly, and a recuperator geometry designed for use with the current layout might not be the optimum design in the future; having a modeling tool such as this
facilitates the development of recuperators to be used with future generations of the microengine. Given information about a heat exchanger's geometry, the model calculates the effectiveness and pressure drop that can be expected in the device; this information
can then be used to predict the impact on the engine cycle. The models take into account losses due to axial conduction along the direction of the flows, a phenomenon which is typically negligible in macroscale systems.
The third contribution is in the development and assembly of an experimental system which can be used to evaluate a microscale heat exchanger's effectiveness and pressure
drop. Issues such as instrumentation and packaging have been addressed, and the
solution that has produced demonstrable results is described. The results of heat transfer experiments are presented, which validated the modeling effort.
The fourth contribution is in the description of parallel projects that were undertaken during the course of this project. Several novel concepts that might find application in microrecuperator designs were investigated, including various techniques for
parallel technologies provided a good deal of useful information, which in some cases was directly applicable to the microscale heat exchanger project.
1.5 Thesis Organization
This thesis is divided up into five major sections beginning with Chapter 1, the Introduction. Chapter 2 presents an in-depth discussion of the counterflow heat exchangers that were designed and fabricated, and the criteria by which they were developed. Additionally, a discussion of the analytical and numerical models that were developed to evaluate the recuperators' performance will be presented. This discussion will highlight the important details and characteristics of the device
Chapter 3 provides an overview of the fabrication process used to produce these silicon heat exchangers. Details about the dimensions, preparations, and actual etching process are provided.
Chapter 4 describes the experimental setup that was designed and built in order to test the recuperators. There are a number of sections in this chapter, which cover the full range of important issues that were considered: these include the basic concept, experimental accuracy, experimental component performance, the control and data acquisition system, the flexibility of the system, packaging, and instrumentation.
Chapter 5 presents the experimental and computational results of the recuperator testing. Effectiveness and pressure drop data for actual recuperators will be presented, as will a comparison to the results of the computational models. Important considerations for
future recuperator designs will also be highlighted. This chapter also validates the model on the basis of the experimental results.
Chapter 6 describes some of the parallel work that was undertaken during the course of this research. Work done to develop a technique for fabricating silicon dioxide structures
is highlighted.
2.0 Modeling and Design
This chapter describes the efforts made to develop a model that could, given a specific geometry, accurately predict or reproduce the performance of a microscale heat exchanger. Each microscale device fabricated in the clean room represents a large investment in time and materials. By analyzing a design using the models, the overall amount of labor and machine time needed to determine the final layout of a heat exchanger can be reduced. The chapter also describes some of the analyses that were used to define the feature sizes eventually used in the recuperator designs.
The model discussed here can be used as a design tool in future generations of the microengine. Since the specific details of the microengine are rapidly evolving at the present time, it is impossible to select the final design for the recuperator. At any time during the engine's development, however, these models can be used to design a recuperator that will provide the maximum benefit to the cycle.
2.1 Modeling and Design Overview
Based on the material characteristics, the geometry of the recuperator, and the
performance of the compressor, the model should accurately predict the heat transfer and pressure drop within the recuperator. With that information, the temperatures and
pressures of the gas flows exiting the recuperator can be predicted; those gas flows become the combustor inlet flows. This information is then used to determine the overall combustor and turbine efficiencies, and therefore the performance of the overall
microengine.
The model predictions can be used to indicate how the recuperator design might be changed to improve the overall cycle efficiency. Information from experiments may be used to further refine the model.
Kohata performed a series of analyses to determine what form the first generation of recuperators should take in order to achieve the goals of the microengine project [5]. During the course of this investigation, several orientations and configurations were
considered and evaluated. Comparative models of their performances indicated which designs were functionally superior and should be pursued further.
Based on Kohata's work, the radial channel configuration recuperator, shown in Figure 2.1, was selected as the focus of this project. In the radial channel design one gas stream enters the recuperator centrally and travels radially outwards through channels with a rectangular cross section. The other flow enters the recuperator at the outer radius and travels radially inwards towards the center. Each radial channel has its flow traveling in the opposite direction of it two neighbors; viewed from the top, the channels alternate flow direction around the circumference of the design.
In actual microengine application, a radial flow recuperator such as this could be added as a single additional wafer layer to the aft end of the engine. Air exiting the compressor could be delivered into half of the passages in the recuperator, while the exiting high-temperature exhaust gases could travel along the remaining passages in the opposite direction. By having the flow channels alternate which flow is being carried, heat transfer can occur between the two flows, cooling the exhaust flow and heating the compressed air prior to entering the combustor.
The radial flow design introduces some interesting geometric considerations; specifically, the changing cross sectional flow area along the radius complicates the modeling process. In order to simplify the initial model and verify that the results were reasonable, a linear recuperator configuration was also designed. The linear design simulates all of the important characteristics of the radial design; however, the cross sectional area does not change as a function of radius. By first fabricating and experimentally evaluating the
simpler linear design, the validity of the model could be ascertained. The absence of geometric complications between experiment and the model simplifies comparison of the two. Understanding any deviations from the expected results would therefore be
simplified as well.
The overall design of the recuperator was constrained by four objectives; maximizing the heat transfer, minimizing the pressure drop, remaining within the limitations of
fabrication, and limiting the overall size of the device to that of the current microengine design. The latter constraint requires that the footprint of the recuperator fit inside that of the engine, simplifying any packaging and mounting efforts. Typically, improving the
heat transfer increases the pressure drop, and improving the pressure drop increases the heat transfer. Furthermore, in each design decision, there are limitations as to whether or
FIGURE 2.1 - Schematic Representation of the Linear (a) and Radial (b)Flow Designs
not a feature with the desired characteristics can be fabricated using the available equipment and techniques.
2.2 Linear Design Modeling
The pressure drop was modeled based on the straightforward pipe-flow equation [6]: Li1
AP =f - u2 2.1
Dh
2
where f is a friction factor, and the hydraulic diameter corresponds to the channel being considered. For the mass flow rates and the geometric sizes being considered, the Reynolds number
_
=D P 2.2
ReD-P
is less than 2500, indicating that the flow is laminar at all points. Substituting the Darcy laminar internal flow correlation for the friction factor
64
f
= ,h 2.3Re D.
substituting the velocity with
V - r 2.4
AC phw
and finally by substituting the hydraulic diameter with
D 4wH 2.5
h ~ 2(w+H)'
where w refers to the width of the passage and H its height, the pressure drop is equal to 8 p L h (w + H)2
Figure 2.2 shows the local geometry of the linear recuperator heat transfer passages. All of the variables depicted correspond to those used in the equations. Note that the mass flow listed in Equations 2.4 and 2.6 is the mass flow per channel - this corresponds to the total mass flow divided by the total number of channels in each direction.
Since the recuperator must eventually operate as part of the microengine, the fluid (gas) properties are predetermined; that is, the density, and viscosity are all constrained by the compressor and turbine exit flow properties. The pressure drop in the recuperator can be tailored through the selection of the geometry; it can be reduced by decreasing the channel length, or by increasing the height or width of the channels. The length of the channels is limited by the recuperator's radius, and the height is limited by the fabrication capabilities. The width of the passages can be varied by selecting the number of channels in each direction; increasing the number of channels decreases the width of each channel, which decreases the mass flow per channel. The average passage width, as a function of the number of channels, obeys the equation:
Channel Width = W oo recup 2ttside wall - (2N - I)t. 2.7
2N t Jtb Iow pressure high flow pressure flow
FIGURE 2.2 - Cutaway Diagram of Recuperator Passages. tw is the wall thickness,
tb is the thickness of the top and bottom coverplates, h is the channel height, 1 is the
channel length, wip is the width of the low-pressure gas flow channels, and whp is the width of the high-pressure gas flow channels.
This indicates that the average width of each channel is equal to the total width of the recuperator (wt), minus the thickness of the outside wall (toutside wall), divided by the
number of channels (N) in each direction. This equation holds true only if all channel widths are to be the same size. In the case of the tested recuperators, however, the pressure drop in each channel was to be identical. Therefore, the low-pressure channels needed to be wider than the high pressure ones, with the factor of difference between them being equal to the ratio of their pressures. Equation 2.7 is multiplied by
low
2.8a
1+ high
to obtain the low pressure channel width, and by 1
+ (h2.8b
to obtain the high pressure channel width. Therefore, the low pressure channel width, 4, becomes equal to
(Phigho
1P.) Woalru - 2toutside wall ( 2N -1I)t. 2.9a
1 + (hi ) 2N
and the high pressure channel width,
C,
becomesI Wotal recup -2outside wall -(2N -)t"
29b
.2 .b
1+~ 2N
To model the heat transfer, standard heat exchanger correlations were used as a starting point. However, an important consideration in the development of this model is the fact that silicon is a material with a relatively high thermal conductivity. This fact, coupled with the small length scales associated with the recuperator, can produce an effect typically negligible in macroscale heat exchangers; that is, the ineffectiveness due to axial conduction. In this device, heat being transferred between the two streams can easily conduct along the walls in the direction of flow. Due to the limits on fabrication, the cross-sectional area of silicon structure compared to that of flow passage is quite large. This communication blurs the overall temperature profile of the wall along its length towards the average value, which produces less overall transfer of heat between the flows.
Kroeger performed a detailed analytical investigation of this effect, and presented equations that account for the ineffectiveness due to this phenomenon [7]. The results were originally intended for application to extremely high-effectiveness systems designs such as cryogenic heat exchangers, in which even small sources of ineffectiveness are important. They can also be applied to structures such as silicon heat exchangers, where axial conduction is important even in designs of moderate effectiveness. The resulting device ineffectiveness with balanced flow (Cmin = Cmax), given here without derivation, is
. 1
1 =
1+ A 2NTU/(l+ A NTU) 2.10
1+ NTU
1+ A NTU
where NTU refers to the number of transfer units and
= ksiA 2.11
l(IhCp)min
The cross sectional area, AC, refers to the cross sectional area of actual heat exchanger structure material (in this case silicon) through which axial conduction can occur. From the equation for heat conduction
q = k A T, 2.12
L
it is clear that the axial conduction in the silicon is much larger than that through the air flow; the thermal conductivity of the gas is about three orders of magnitude less than that of the silicon, and the cross sectional flow area and the cross-sectional area of silicon available for axial conduction are comparable in magnitude. Clearly, the axial conduction in the silicon is the dominant contributor to the overall recuperator effectiveness, and the axial conduction through the air can be neglected.
For modeling purposes, the recuperator was assumed to have balanced flow. One reason for this assumption is that the same gas stream is used in both flows of the recuperator. Assuming that there are no leaks in the system between the compressor outlet flow and the final exhaust to the atmosphere, the mass flow in each recuperator stream will be the
same. The specific heat only changes by at most 10% in the temperature ranges considered. This deviation was assumed to be low enough to neglect the change altogether. Even more significantly for the purposes of modeling, balanced flow is the worst case scenario for axial conduction losses, as explained by Kroeger. This is due to the fact that with balanced flow designs, the temperature difference between the fluids is further decreased. This decreased temperature difference reduces the amount of heat transferred between the two streams. Imbalanced flow heat exchangers suffer from the same effects, but to a lesser degree since the decrease in the temperature difference is proportionally less. Figure 2.3 shows this schematically.
1.0 ,1.0 , 01
''Z 02
x 1.0 x--* 1.0
FIGURE 2.3 - A schematic representation indicating the deterioration of heat exchanger performance as a result of axial conduction through the walls [7]. (a) A balanced flow heat exchanger, wherein the decrease in the temperature difference is large compared to the difference itself, and the heat transfer is reduced signficantly. (b) An imbalanced flow heat exchanger; the decrease in the temperature difference is smaller compared to the
temperature difference itself.
Note that this ineffectiveness equation (Equation 2.10) is simply a modified version of the standard equation
1
1+ NTU
with the NTU term multiplied by what Kroeger calls a "deterioration" coefficient that is in itself a function of the NTUs. Clearly, in cases in which there is no axial heat
conduction (X goes to zero), Equation 2.13 simplifies to Equation 2.10. Finally, the NTUs is calculated from
NTU = UA 2.14 Cmm and 1 UA= 2.15 I ) ( si w,7 +.15
h1 Awa ksi AwaI h, Awai
The wall areas described here refer to the area of the channel wall separating the two flows, or the channel depth times the length of the channel. The convection coefficients are estimated with the equation
h = Nu k 2.16
Dh
b.
Since the flow is laminar (see Equation 2.2), a Nusselt number of 4.36 is used, corresponding to the uniform surface heat flux in laminar flow. A balanced flow recuperator will have a constant temperature defect between the two streams along its entire length, and the fluid properties are not changing drastically within the temperature range being considered. Therefore a constant heat transfer coefficient is a reasonable assumption.
2.3 Radial Design Modeling
For the radial flow design, the models need to account for the fact that the cross sectional area changes as a function of radius. The equations used for the linear system were adapted in order to reflect this. All radius-dependent dimensions were written as
functions of the radius, and the equations were integrated over the length of the channels. Therefore, the pressure drop was calculated by integrating Equation 2.6 along the length of the channel.
r 8 u uh (w(r)+h)2 dr 2.17
I p har )
The passage width function w(r) was derived from the total area available for gas flow:
W~r) 02 ir r - (2N -1I)t,,21 w(r)=< 2fr(N$ ~wj 2.18 2N where high 2.19a 1+ high + P
for the low pressure channels and
1
p +2.19b
for the high pressure channels. The heat transfer equations were treated similarly to account for the radial variations in the circular geometry.
2.4 Correlation Validation
One vital assumption that is being made in these models is that macroscale correlations can be applied to these microscale gas flows and geometries. Demonstrating that the gas
flows is not behaving as a rarified gas would validate this assumption. Therefore the gas flows in question were examined to see if any Knudsen effects would be present.
Knudsen Effects occur when the relevant geometric feature dimensions being considered are of the same scale as the mean free path of the gas flow molecules [8]. If this is the case, the conventional continuum heat transfer and fluid mechanics models no longer apply. In the case of these recuperators, the question is whether or not the mean free path of the nitrogen gas is comparable in length to the passage widths or depths.
The mean free path of the gas molecules was calculated using the formula
2=1.26 P 2.20
p VRT
In the worst case scenario, characterized by low (1 atm) pressure and high (1200K) temperatures, the mean free path was on the order of 0.5 tm. The smallest relevant dimension in these recuperators was a passage width of 45 tm, which is almost 100 times larger than the mean free path. Based on this result, it is reasonable to assume that the gas flows are in the continuum limit.
2.5 Model Overview
Based on the equations used to model the recuperator, it is clear that increasing the depth of the channels benefits both the pressure drop (by increasing the cross sectional flow area, the pressure drop is decreased) and the heat transfer (a higher wall provides more surface area for heat transfer). Increasing the passage width, on the other hand, improves the pressure drop, but reduces the overall heat transfer (with wider passages, less
channels fit in the recuperator footprint, reducing the number of channel walls, which reduces the total amount of heat transfer area). As mentioned before, structural considerations had to be investigated to ensure that the design would survive during operation. Furthermore, there are also limitations on what can be successfully fabricated; etching an array of high thin passage walls becomes increasingly difficult as the walls become higher and more closely packed.
Figure 2.2 clearly depicts each of the dimensions in the recuperator geometry that can be tailored to improve the overall device performance.
On the basis of the models, the effects of each geometric feature on device performance can be ascertained and plotted as trends. An initial baseline design was selected, and its performance was predicted. A series of design graphs were then constructed, each of which displayed the effect that the changing of one feature dimension had on the overall
recuperator performance. The baseline design characteristics are shown in Table 2.1; the labels in parentheses refer to the dimensions shown in Figure 2.2. All changes are referenced to this baseline design.
The mass flow rate used in the baseline recuperator design is half that of the microengine (see Table 1.1). Initial calculations indicated that the pressure drop in a single-layer high-effectiveness recuperator design would always be prohibitively high, unless the channels could be etched to a depth in excess of 600 micrometers. This goal is, at present,
unattainable due to fabrication constraints. Therefore, at least two layers of recuperator channels would be needed in actual microengine application. Additional layers would each function identically to the first. As a result, the mass flow per recuperator level would be half of the total, which is represented in the operating conditions shown here. Figure 2.4 shows the effects of changing the passage height on the effectiveness and pressure ratio of the linear recuperator design. This graph was produced by changing the passage height parameter in the model for the linear recuperator. The resulting
effectiveness and pressure ratio values were then plotted as a function of the changing passage height. Clearly, maximizing the passage depth is crucial to the performance of the device. With increasing channel depth, both the pressure ratio and the effectiveness improve. Also shown on the graph is a vertical line corresponding to the current
fabrication limit, and a horizontal line corresponding to the minimum pressure ratio
Mass flow rate 0.18 g/s
Flow 1 Inlet Temperature 600 K Flow 2 Inlet Temperature 900 K Flow 1 Inlet Pressure 1.8 atm Flow 2 Inlet Pressure 1.2 atm Channel Wall Thickness (tw) 10 pm
Top/Bottom Thickness (tb) 100 tm
Channel Depth (h) 500 tm
Small Passage Width (whp) 60 tm
Number of Passages 187
TABLE 2.1 - The baseline conditions used for comparing recuperator features. These operating conditions and the geometric feature dimensions were selected as being achievable. The labels in parentheses refer to the dimensions shown in Figure 2.2. The pressure drop and effectiveness resulting from a recuperator with these characteristics were then used as the basis of comparison for potential changes to the design.
needed to benefit the microengine cycle. Since the design space is currently beyond the capabilities of fabrication, the dual-layered recuperator design mentioned above is needed. Although it adds another conduction path between the flow inlets and outlets, it effectively doubles the available channel depth. Also shown is a graph of the
effectiveness and pressure ratio as a function of the number of channels in the recuperator design (see Figure 2.5). This graph was also generated using the computer model to arrive at pressure ratios and effectiveness ratings for each geometry.
0 U) LU 100% 80% 60% 40% 20% 0% 0
Pressure Ratio, Effectiveness vs. Channel Depth h
__________________ ffectiveness
I I II I
100 200 300 400 500 600
Channel Depth (microns)
FIGURE 2.4 - A graph of the recuperator effectiveness and pressure ratio versus the depth of the heat transfer passages. The horizontal line is the minimum
pressure ratio needed to benefit the engine cycle, and the vertical line is the current
limit of fabrication.
Pressure Ratio, Effectiveness vs. Channel Width t, a) C: 100% 80% 60% 40% 20% 0% 0 100 200 300
Channel Width (microns)
400
FIGURE 2.5 - A graph of the recuperator effectiveness and pressure ratio versus
The axial conduction through the silicon was a large contributor to the ineffectiveness of these designs, and therefore the focus of a great deal of effort. This can be seen in graphs of the effectiveness versus the thickness of the top and bottom coverplates to the heat transfer passages. These coverplates are the greatest contributor to axial conduction, since they represent the largest fraction of the silicon cross-sectional area along the direction of flow. The extent of this effect can be seen in Figure 2.6.
A graph showing the effect of t, is not included. Although making the passage walls thinner improves the heat conduction from one stream to the other, and reduces the cross sectional area for axial conduction in the direction of flows, these effects are small. The thermal resistance through the walls is already much smaller than the convective
resistance in the gas streams, so thinning the walls further doesn't significantly improve the heat transfer. Furthermore, the effect of reducing the cross sectional area is
negligible, since the coverplates are already so large by comparison.
Pressure Ratio, Effectiveness vs.
Coverplate Thickness tb 100% 100% Pressure Ratio 80% U) D 60% Effectiveness . 40%- 20%-0% 0 100 200 300 400 500 600
Coverplate Thickness (microns)
FIGURE 2.6 - A graph of the effectiveness and pressure ratio as a function of the thickness of the top and bottom coverplates to the heat transfer passages.
2.6 Pressure Considerations
In addition to optimizing the performance of the engine, physical constraints imposed by the operating conditions had to be observed. For example, while the wall thickness had to be as thin as possible in order to maximize the heat transfer across the wall and to minimize the cross sectional area for heat transfer in the direction of flow, they also had to be large enough to sustain the pressure differences across them without rupturing. Furthermore, the limitations of fabrication had to be taken into account.
A first-order structural analysis indicated that a 10-micron thick wall 500 microns tall could easily contain the high pressure gas without failing. This analysis considered the wall as a plate with fixed end condition at the top and bottom, and an evenly distributed pressure load acting along the surface. Using standard beam calculations [9], the maximum force on the beam is equal to
Vmax =wL, 2 2.21
where L is the length of the beam (or, in this case, the height of the wall) and w is the force per unit length. The corresponding maximum moment experienced is equal to
wL2
Mmax = 8 ' 2.22
and the corresponding maximum stress is
IMI c 2.23
Umax- I
Given the anticipated pressure conditions to be found in the recuperator (2-4 atmospheres on the high pressure side, -1 atmosphere on the low pressure side), the stress in the wall
is about 100 kPa. This is less than 0.5% of the maximum allowable stress, which was
calculated as
Call Sy =27.5 MPa. 2.24
2 y
In summary, the pressure differential across the 10 Vtm wall produces stresses well below the maximum allowable stresses. Although the maximum allowable stress decreases with increasing temperature, the value listed above was calculated at the average of the two stream inlet temperatures.
Under pressurized conditions, the walls can be expected to bow slightly due to the pressure differential. At a pressure differential of 1 atmosphere across the wall, the
maximum calculated deflection was about 1.5 micrometers. The minimum passage width
found in any of the recuperators is 40 micrometers; the change in passage width due to bowing was therefore considered negligible.
2.7 Structural Considerations
In selecting the feature dimensions, the threat of buckling in the walls of the
microengine-compatible radial design recuperator also had to be studied. In microengine applications, the exhaust gases will heat up the center region of the recuperator design, while the outside edges are kept cool by the ambient environment and the pre-combustor gas flow. Any thermal expansion of the thin engine walls will be constrained by the outside edges, inducing buckling forces in the walls.
Several analyses were performed on the heat transfer walls to investigate this concern. The first analysis considered the walls as thin (10 micron) rectangular structures that were free standing and derived no benefit from being affixed to the top and bottom coverplates. This model is shown in Figure 2.7a. The temperature conditions that were applied in this analysis were consistent with a high-effectiveness device performance, corresponding to a AT of 600-800 K along the length of the walls. The stress seen by the beam would then be
a-=-=- Ea AT ~ 351 MPa. 2.25
A
where cx is the coefficient of thermal expansion. Under these conditions, this value is over 1000 times larger than the critical buckling stress, determined by
Pcr = EI ~ 250 kPa. 2.26
Le
However, the system constraints used here are not representative of the actual recuperator design. In an effort to more accurately model the actual effective geometry, the heat transfer channels were then modeled as thin-walled hollow boxes (see Figure 2.7b). Under these conditions, the critical buckling force is slightly more than the applied stress. An even more accurate axisymmetric model is shown in Figure 2.7c, with a constrained top and bottom to simulate the support provided by the rest of the engine. In this model, the applied stresses were estimated at about half of the critical buckling stresses,
indicating that the recuperator would survive the thermal variations along its radius.
a. b. c.
Figure 2.7 - (a) initial buckling analysis, considering walls independently (b) secondary buckling analysis, considering walls as thin hollow boxes (c) final buckling analysis, considering walls as linked I-beam structures.
As an added level of insurance, the experimental devices were designed so that the hot gases could be located along the outer radii of the recuperators, and the cooler gases in the central regions; this arrangement allows for the free expansion of the recuperator, thus eliminating buckling concerns altogether.
In retrospect, it is doubtful that the recuperators will ever see a thermal variation along their length as large as this model anticipated. The large top and bottom plates will conduct heat easily, and blur the profile of the heat transfer walls. Furthermore, in microengine application, the engine itself will act as a structural support. Nevertheless, it was worthwhile performing the analysis in order to demonstrate that the test designs would not fail due to buckling during experimentation.
2.8 Cycle Implications
The models indicated that is was possible to have designs characterized by extremely high heat transfer rates, or extremely low pressure drops, but not both in the size and
structural constraints being considered. The final designs have combinations of pressure drops and heat transfer rates that optimize the performance of the engine cycle.
The effects of adding a recuperator with a given performance could be predicted using cycle analysis data provided by other members of the MIT microengine team [10]. As shown in Figure 1.4, the gas properties at the compressor and turbine exits correspond to the conditions at the recuperator inlets. Given the recuperator's effectiveness and
pressure drop, the recuperator's outlet conditions can be predicted. The outlet conditions correspond to the combustor inlet and exhaust flow conditions. This data is then used to evaluate the combustor efficiency and the thrust or power that the engine produces. These new combustor inlet and exhaust properties may change the compressor and turbine exit conditions, so an iterative process must be used. The result is an understanding of the effect of adding a recuperator with a given performance to the engine.
Figure 2.8 shows this information in graphical format. The x-axis represents the power that can be extracted from the engine shaft, and the y axis represents the power specific fuel consumption. Plotted directly on the graph is a map of recuperator performance; the numbers on the left side of the map are recuperator effectiveness, and those along the top are the pressure ratio (defined as the ratio of the outlet pressure to the inlet pressure of either of the recuperator gas streams). The point labeled A corresponds to an
0 0 Q I.. 0 8 7 6 5 4 3 2 1 0 U 2 4 ci Power (W) 1 14
FIGURE 2.8 - Power Specific Fuel Consumption and Power Recuperator Effectiveness and Pressure Ratio
a as I .1 .2 .90 .4 .5 PR .7 9 2 .6 - __ --- - -___ _- -- ______ .8 . 4 .9 . - -.-- ..
unrecuperated microengine - the effectiveness is nearly zero (no heat transfer from the exhaust gases to the pre-combustor gas flow), and no pressure drop associated with that heat transfer (pressure ratio equals 1.0).
Any combination of effectiveness and pressure ratio that lies below the horizontal line passing through point A improves the efficiency of the engine. In each case, the total power output decreases, but more importantly the power specific fuel consumption decreases. That is to say, the engine produces less power, but the fuel it is expending per
unit ofpower goes down.
Figure 2.9 gives the same information with respect to the thrust that the engine could produce.
For example, assume that an unrecuperated engine produces 13.8 watts of power (this corresponds to the anticipated performance of the current engine as designed). This engine is burning 1.2 grams of fuel per hour to provide this output. Now consider the addition of a recuperator that has an effectiveness of 0.7 and a pressure ratio of 0.98. One of these recuperated engines produces 11.3 watts of power, but for only half of the fuel, 0.6 grams per hour (see Figure 2.8). By using two recuperated engines, 22.6 watts of power can be produced for the same amount of fuel required by the unrecuperated engine to produce half as much thrust.
Pressure Ratio PR 0.90 - 1.00 Recuperator Effectiveness E 0.10 -1.00 6 Functions of I2
![FIGURE 2.3 - A schematic representation indicating the deterioration of heat exchanger performance as a result of axial conduction through the walls [7]](https://thumb-eu.123doks.com/thumbv2/123doknet/14732087.573205/27.918.123.766.123.344/figure-schematic-representation-indicating-deterioration-exchanger-performance-conduction.webp)