1 INTRODUCTION
As a result of repair or protection of the building structure at least two component system: concrete substrate in contact with repair material is produced. An adhesion in this system is one of the most im-portant factors that affect the durability of repair (Czarnecki & Emmons, 2002). The adhesion de-pends on many phenomena taking place at interface zone (Courard 2005, Silfwerbrand & Beushausen 2006, Garbacz et al. 2005, Courard et al. 2011): presence of bond-detrimental layers, wettability of concrete substrate by repair materials, roughness and microcracking of concrete substrate, moisture con-tent in concrete substrate versus repair material (i.e. cement or polymer mortar).
The above factors imply that according to the many standards and guidelines, e.g. European Standard EN 1504-10 and ACI Concrete Repair Manual, the both bond strength and bond quality should be evaluated. The pull-off test is recom-mended for assessment of a bond strength. The use of pull-off test, due to its semi-destructive character, is restricted by owners and managers. Therefore, the elaboration of reliable nondestructive method for an adhesion mapping is one of the most important tasks. A majority of NDT methods mentioned in EN 1504-10 and ACI Concrete Repair Manual (2003) for assessment of concrete structures are based on propagation of stress waves. Particularly ultrasonic
methods (UPV), impact echo (IE) and impulse-response (IR) methods are recommended for evalua-tion of repair quality. However, these investigaevalua-tions are rarely focused on evaluation of bond strength.
To select the appropriate NDT method for repair quality control, the following factors should be taken into account (Carino 1997, Garbacz 2005) :
− type and size of defects at the interface zone to be investigated;
− thickness of overlay;
− type of repair material (cement based or polymer composites);
− quality of concrete substrate (roughness, microcracking, saturation level).
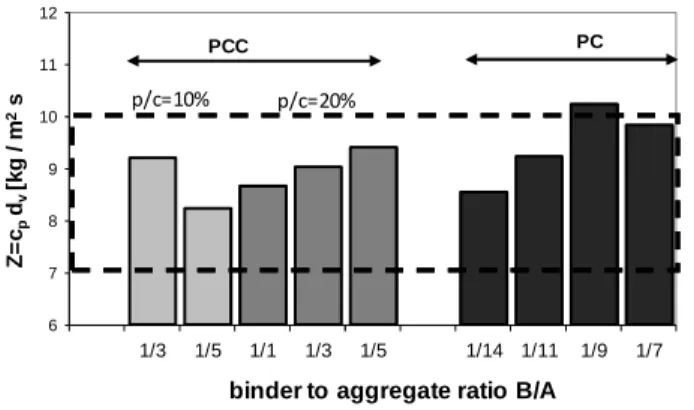
First two factors depend mainly on NDT method used. Type of repair material could affect a reflec-tion coefficient. In the case of multilayer system the propagation of stress waves depends on differences in acoustic impedances of the both repair material and concrete substrate (Carino 1997). The reflection coefficient for concrete/air interface is equal nearly to 1.0 - there is almost total reflection at the inter-face. Experimental investigations with I-E method have shown that usually an interface is “visible” if absolute value of R coefficient is higher than +0.24 (Sansalone & Carino 1989). Garbacz (2015) showed that in the case of many commercial PCC and PC repair mortars it can be assumed that repair material and concrete substrate have similar acoustic imped-ances (Fig.1).
The above conclusions allow to assume that detec-tion of flaws at the interface overlay - concrete sub-strate can be performed with procedures developed
A repair quality control with elastic waves based methods vs. substrate
quality
A.Garbacz & T. Piotrowski
Warsaw University of Technology, Warsaw, Poland
L. Courard
University of Liege, Liege, Belgium
B.Bissonnette
CRIB – Dept. of Civil Engineering, Laval University, Quebec (QC), Canada
ABSTRACT: An adhesion in repair system is one of the most important factors that affect the repair efficien-cy. The elaboration of reliable nondestructive method for an adhesion mapping is one of the most important tasks. A majority of NDT methods mentioned in EN 1504-10 and ACI Concrete Repair Manual for assess-ment of concrete structures are based on propagation of stress waves. However, these investigations are rarely focused on evaluation of bond strength. Repair system is difficult to test with NDT methods because of many factors influencing stress wave propagation. In this paper the effect of a quality of concrete substrate on prop-agation of stress waves in repair system and their influence on possibility of estimation of the bond strength is discussed..
6 7 8 9 10 11 12 1/3 1/5 1/1 1/3 1/5 1/14 1/11 1/9 1/7 Z = cp dv [k g / m 2s
binder to aggregate ratio B/A
PC PCC
p/c=10% p/c=20%
for “solid” concrete structures. The effect of inter-face should be taken into account in the case of overlays with acoustic impedance different than that for concrete substrate. eg. polymer coating, asphalt pavements, etc.
Figure 1. The acoustic impedance of tested polymer-cement and polymer (w/o Portland cement) mortars and concretes rep-resentative for commercial repair mortar; dotted line - typical range of acoustic impedances for cement concretes and mortars (adopted from Garbacz, 2015)
The aim of this paper is analysis of the effect of a quality of concrete substrate on propagation of stress waves in repair system and their influence on possi-bility of estimation of the bond strength.
2 REPAIR SYSTEM AS AN OBJECT OF NDT ASSESSMENT
Repair system is difficult to test with NDT meth-ods because of many factors influencing stress wave propagation (Fig.2).
Figure 2. Sketch of possible defects in repair system and ex-ample of surface geometry of concrete substrate after milling
Two main types of defects can occur in this sys-tem that can affect stress wave propagation (Adams & Drinkwater 1997):
− adhesion type (at the interface zone: over-lay - substrate): various types of “non-zero” volume disbands (e.g., voids, de-laminations) and “zero-volume” disbands - weak adhesion areas (e.g. due to a pres-ence of dust, oil, etc.);
− cohesion type (in repair material or/and concrete substrate): porosity, cracks, hon-eycombing, partially non-hardened resin in the case of polymer material.
Above defects are often resulted from operations that have to perform prior a repair as well as an ap-plication of repair material. Surface concrete treat-ment is used to remove deteriorated and carbonated concrete and any type of layer that causes the de-crease of adhesion and to enlarge the area of contact surface by increasing surface roughness. The tech-nique and the energy chosen induce many different profiles.
It has been widely demonstrated that a surface preparation of concrete substrate prior repair can in-fluence significantly on the microcracking level and surface roughness, the substrate saturation level and, as a consequence, it may affect the bond strength be-tween repair material and concrete substrate.
The effect of concrete surface roughness on the adhesion is not quite clear. Some authors found a correlation between adhesion strength and some “roughness parameters” (e.g. Fukuzawa et al. 2001). Courard et al., (2014) have shown, using multiple regression approach, that roughness is a statistically significant variable influencing bond strength. From other hands, a few authors (Silfwerbrand & Beushausen 2006, Garbacz et al. 2005, Bissonnette et al. 2006) conclude that surface roughness itself does not have significant influence but microcracks induced by surface treatment mainly contribute to the deterioration of the quality of the bond.
The effect of a bond coat is also discussed. Ac-cording to one opinion (Silfwerbrand & Paulsson 1998), the bond coat should be avoided because of creation of an extra plane of weakness. Moreover, bond coat could have a negative effect with very rough surfaces because it could limit a good inter-locking effect between substrate and repair material. However, some authors have shown that a presence of bond coat can significantly increase the adhesion (Austin et al. 1995, Pretorius & Kruger 2001. Gar-bacz et al. 2005).
Using stress waves based methods for evaluation of bond strength needs to find answers whether the interface quality affects the stress wave propagation and if is it possible to extract from the signal any in-formation related to the bond strength.
3 TESTED REPAIR SYSTEMS
In the framework of several project conducted at Warsaw University of Technology in cooperation with the University of Liege various repair systems, differing in concrete surface and interface quality, were tested. In the first stage, a commercial poly-mer-cement repair mortar containing glass
microfi-bers was applied on relatively weak concrete sub-strate (C20/25) subjected, prior to repair, to surface treatments with different aggressiveness levels. As result concrete substrates with different roughness and microcracking levels (Tab.1) were obtained. Surface roughness was characterized by parameters of the waviness profile (high frequency filtration of profile) determined with a mechanical profilometer (Garbacz et al. 2005).
Table 1. SEM observation and profile analysis of the concrete substrate C20/25 after various surface preparation
Example of surface view SEM - magnification 100x
Waviness profiles obtained with profilometer and selected
parameters No treatment Wa = 5 µm; Wt = 39 µm Grinding Wa = 32 µm; Wt = 219 µm Sandblasting Wa = 49 µm; Wt = 434 µm Shotblasting Wa = 215 µm; Wt = 1086 µm Milling Wa = 179 µm; Wt = 867 µm
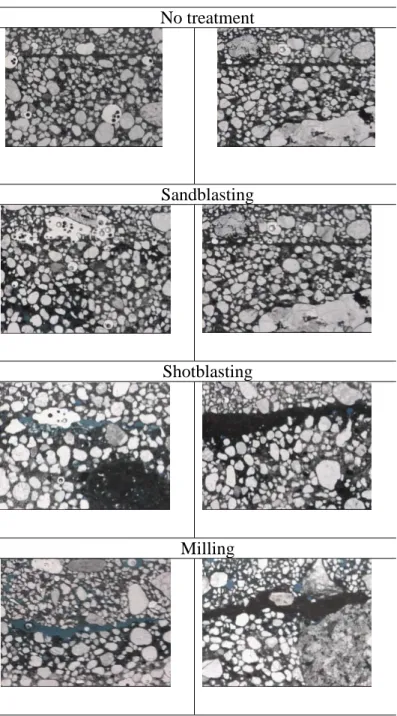
According to the manufacturer’s technical data sheet, this mortar should be used with a polymer-cement bond coating because of its low workability (the details are given in Garbacz et al. 2005). The overlay (thickness 10 mm) was applied on the con-crete substrate with and without a bond coat to
ob-tain different air void contents and levels of compac-tions at the interface (Fig.3).
No treatment
Sandblasting
Shotblasting
Milling
Figure 3. View of the interface between repair material and concrete substrate after various way of surface preparation without (left) and with (right) bond coat
4. NDT MEASUREMENTS
After 28 days of hardening, the IE and ultrasonic measurements were carried out. The IE measure-ments were performed with Docter test system using the impactor of 2 mm in diameter to generate a stress wave. The same repair systems were tested further with ultrasonic pulse echo method using commercial digital ultrasonic flaw detector ULTRA CUD20 and a pair of transducers with nominal fre-quency of 500kHz. This method are expected to be more sensitive to the presence of voids at interface because of shorter waves are generated. Each
re-[µµµµ
m
0.0 0.5 1.0 1.5 2.0 2.5 0 100 200 300 400 500 p u ll -o ff s tr e n g th , M P a Wa, µµµµm BC no BC 0.0 0.5 1.0 1.5 2.0 2.5 0 500 1000 1500 2000 2500 p u ll -o ff s tr e n g th , M P a Wt, µµµµm BC no BC
ceived A-scan consisted of characteristic peaks cor-responding to the reflection from the interface.
Afterwards, the adhesion between the repair ma-terial and the concrete substrate was determined with the pull-off test (acc. EN 1542]). Additionally, the quality of interface was observed on the cross-sections with light microscope.
The results of investigations can be summarized as follows. As the surface roughness increased (Fig.4), the pull-off strength for the systems without bond coat decreased and more air voids at the inter-face zone were observed (see Fig.3). In the case of system with bond coat the bond strength in repair systems were less sensitive on concrete substrate quality.
a) b)
Figure 4. Pull-off strength vs. waviness parameter Wa (a) and
Wt (b) for different repair systems with and without bond coat (BC)
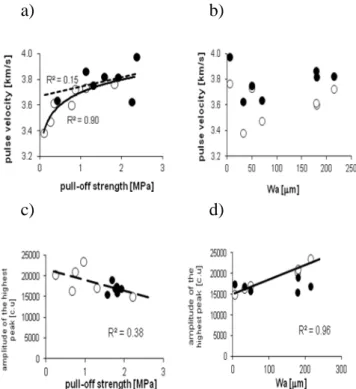
The test results indicate that there is no correla-tion between the pull-off strength and the P wave ve-locity for the repair system with bond coat (Fig.5a). The bond coat filled properly irregularities of con-crete substrate and air voids at the interface were not observed. The statistically significant relationship was obtained for systems without the bond coat - the P wave velocity increased as the pull-off strength in-creases. In this case, the fraction of air voids at the interface increases when the roughness increases. In both types of repair systems the pulse velocity was not correlated with the substrate roughness (Fig.5b). The following trend was found in studying the rela-tionship between the amplitude of maximum fre-quency peak and the pull-off strength (Fig.5c): as the pull-off strength increases, the amplitude value of peak decreases. Statistical significance of the rela-tionship between the amplitude value of the highest peak and the mean waviness of surface profile (Fig.5d) was found for the repair systems without the bond coat, essentially because the fraction of air voids increased with the surface roughness.
The results obtained indicates that for the IE method, the roughness of the concrete substrate does not affect significantly the P wave propagation through the repair system if the bond quality is suffi-cient (absence of large voids at the interface). The ultrasonic method is more sensitive on the bond quality.
a) b)
c) d)
Figure 5. Relationships between parameters describing stress wave propagation and parameters describing repair system quality: pulse velocity IE vs. a) pull-off strength, b) mean wav-iness of profile, Wa; amplitude of the highest peak of frequen-cy spectrum of ultrasonic signal (c.u. – conventional unit) vs. c) pulse velocity IE and d) mean waviness of profile, Wa, (concrete substrate C20/25, overlays with (●) and without (o) the bond coat; adopted from (Garbacz 2015)
The above relationship was investigated for stronger concrete, C40/50 (Garbacz et al. 2006). Four types of surface preparation techniques were used: polishing, sandblasting, scabbling and very high pressure water-jetting. The concrete slabs (600 x 800 x 130 mm) have been covered by a self-compacting commercial PCC mortars (3-cm thick). For the repair systems, two specific ranges of the IE frequency spectrums were analyzed: around the bot-tom peak frequency and around frequencies corre-sponding to the interface. The lowest mean values of bottom peak were obtained for polishing and hydro-demolition. The amplitude of interface peak was the highest for polished samples. Scabbled and hydro-demolished samples present similar values of inter-face peak. The relationships between amplitudes of either bottom or interface peaks and parameters de-scribing quality of repair systems were not statisti-cally significant for any of the tested repair systems (Fig.6).
Additionally the normalized frequency spectrums were characterized with RugoDS program using 3D surface profile analyzing approach (Courard et al. 2007). The number of I-E measurement from 1 to 10 was the third axe parameter (Fig.7a) and all the sta-tistic parameters (Fig.7b) for 3D distribution of fre-quency spectrum were calculated.
0 0.01 0.02 0.03 0.04 0.05 0 50 100 length of cracks, mm re la ti v e a m p lt u d e 0 20 40 60 80 100 120 140 160 180 200 0.0 0.5 1.0 1.5 2.0 2.5 3.0
pull-off strength [MPa]
W m * 1 0 3, W t Wm Wt r = 0,60 0 20 40 60 80 100 120 140 160 180 200 0.0 0.5 1.0 1.5 2.0 2.5 3.0 3.5 4.0 4.5 5.0 5.5 SRI [mm] W m * 1 0 3, W t Wm Wt r = 0,61 0 20 40 60 80 100 120 140 160 180 200 0 10 20 30 40 50 60 70 80 90
total length of microcracks [mm]
W m * 1 0 3, W t Wm Wt 0 0.01 0.02 0.03 0.04 0.05 0 1 2 3
pull-off strength, MPa
re la ti v e a m p lt u d e 0 0.01 0.02 0.03 0.04 0.05 0 2 4 6 SRI, mm re la ti v e a m p lt u d e a) b) c)
Figure 6. Amplitude of bottom (●) and interface (∆) frequency peaks versus: a) pull-off strength, b) surface roughness index, SRI, c) length of crack (adopted from Garbacz et al. 2006)
a) b)
Wa: arithmetic mean deviation; Wt: max height of amplitude Wp, Wm: max. and min. amplitude level respectively
Figure 7. Example of 3-D frequency distribution and defini-tions of IE frequency spectrum amplitude parameters applied for characterization of impact-echo signal
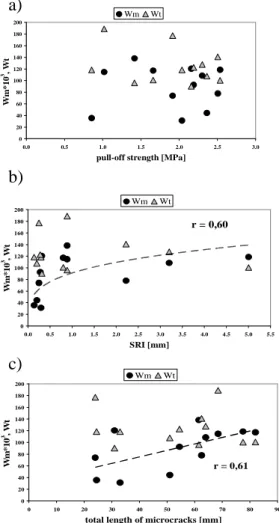
There were no statistically significant relation-ships between the amplitude parameters of I-E fre-quency spectrum and the pull-off strength (Fig.8). The relations between statistical these parameters of frequency spectrum and parameters describing con-crete substrate quality show some tendencies. Roughness and cracking influenced the minimum amplitude level, Wm, of the I-E frequency profile. It was observed that as the roughness (Fig.8b) and cracking (Fig.8c) increased the minimal amplitude of frequency profile increase, too. This tendencies could be interpreted as an increase of noise level in the I-E frequency spectrum due to roughness and cracking of concrete substrate. Similar results were obtained by Santos et al. (2011). Their FEM simula-tions indicated also that the roughness of a concrete substrate had relatively low influence on the result-ing ultrasonic signal amplitude. However, they
ob-served that the pulse decreases in the presence of rough interfaces, due to a greater wave dispersion.
a)
b)
c)
Figure 8. Maximum height of amplitude Wt, and minimum amplitude level, Wm, of 3D frequency distribution versus (see Fig.7): (a) pull-off strength, (b) surface roughness index SRI, c) total length of cracks (adopted from Garbacz et al. 2006)
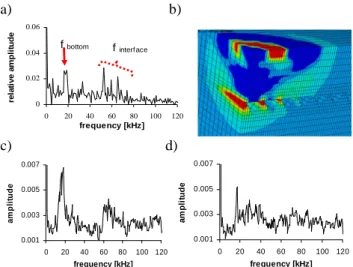
The effect of substrate roughness and presence of air voids at the interface on stress wave propagation were also investigated using FE model of repair sys-tem (Kwaśniewski & Garbacz 2008). The simula-tions were performed for system with the same ge-ometry like that used in the experiment and for two extreme cases of filing of surface irregularities: completely filled and non-filled surface irregulari-ties. The surface geometry corresponded to real sur-faces roughness obtained after sandblasting and hy-dro-demolition under high pressure of previously described concrete substrate. The material; proper-ties (E modulus and density) of the both concrete substrate and overlay were determined experimental-ly. The results of simulations indicate that the pres-ence of larger air voids at the interface can signifi-cantly influence the stress wave propagation. This was observed in the both of experimental (Fig.9a) and FEM (Fig.9b-d) frequency spectra. If surface profile irregularities are filled, the surface roughness does not significantly influence the resulting fre-quency spectrum (Fig.9d).
a) b)
c) d)
Figure 9. Typical frequency spectra for repair systems with concrete substrate after hydrodemolition: a) experimental re-sults for plate; FEM simulations: b) examples of disturbance in wave propagation in the case of air voids presence at interface, c) frequency spectrum for substrate irregularities unfilled – presence of air voids at the interface, d) frequency spectrum for substrate irregularities completely filled (adopted from Kwaśniewski & Garbacz 2008)
5. SUMMARY
The multi-variants investigations showed that for the both IE and ultrasonic methods, the roughness and microcracking of the concrete substrate does not affect significantly the P wave propagation through the repair system if the bond quality is sufficient - absence of large voids at the interface. However, pa-rameters describing roughness and microcracking of concrete substrate can be considered as important for improvement of reliability of the bond strength eval-uation using stress wave based NDT methods. For example Sadowski & Hoła (2014) showed that sub-strate roughness is an important factor for the pre-diction of bond strength between the concrete layers in concrete floors using the nondestructive acoustic techniques together with artificial neural networks.
Acknowledgements
This paper was elaborated in the framework of the research jects carried out in the framework of the scientific cooperation pro-grams between foreign agencies of Wallonia-Brussels International (Belgium) and (MNiSW) Poland.
4 REFERENCES
Adams R.D., Drinkwater B.W. 1997. Nondestructive testing of adhesively bonded joints, NDT&E International, 30, 93-98. Austin, S., Robins, P. and Pan, Y. 1995. Tensile bond testing of
concrete repairs., Mater. Struct. (28): 249 - 259.
Bissonnette, B., Courard, L., Vaysburd, A., Bélair, N. 2006. Concrete removal techniques: influence on residual crack-ing and bond strength. Concrete International, 28(12), 49-55.
Carino N.J. 1997. Nondestructive Test Methods, Concrete Construction Engineering Handbook, ed. E.G.Nawy, CRC Press, 19.1-19.67.
Concrete Repair Manual. 2003. ACI International, Farmington Hills, MI, USA, pp.862.
Courard, L. 2005. Adhesion of repair systems to concrete: in-fluence of interfacial topography and transport phenomena,
Mag of Concr Res, 57(5). 273-282.
Courard, L. Schwall, D. Piotrowski, T. 2007. Concrete surface roughness characterization by means of optomorphology technique, Adhesion in Interfaces of Building Materials: a Multi-scale Approach, Advances in Materials Science and
Restoration AMSR No. 2., Aedificatio Publishers, 107-115.
Courard, L., Lenaers, J.-F., Michel F., Garbacz A. 2011. Satu-ration level of the superficial zone of concrete and adhesion of repair systems, Constr.Build.Mat., 25, 2488–2494. Courard, L. Piotrowski, T. Garbacz, A. 2014. Near-to-Surface
properties affecting bond strength in concrete repair. Ce-ment.Concrete Comp., 46, 73-80.
Czarnecki, L and Emmons, P.H. 2002. Repair and protection of concrete structures (in Polish). Polski Cement, Cracow. Fukuzawa, K., Mitsui, M. and Numao, T. 2001. Surface
rough-ness indexes for evaluation of bond strengths between CRFP sheet and concrete. In: ICPIC 2001, Xth Internation-al Congress on Polymers in Concrete, USA, p.12 (CD) Garbacz, A. 2005. Non-destructive assessment of repair
effi-ciency with impact-echo and ultrasonic methods – an over-view, in Concrete Repair, Rehabilitation and Retroffiting, Taylor&Francis, 1319-1326.
Garbacz, A. 2015. Application of stress based NDT methods for concrete repair bond quality control. Bull.of the Polish
Academy of Sciences: Techn.Scien., 63 (1) (in press).
Garbacz, A., Gorka, M., and Courard, L. 2005. On the effect of concrete surface treatment on adhesion in repair systems.
Magazine of Concrete Research. 57, 49-60.
Garbacz, A. Piotrowski, T. Courard, L. 2006. An analysis of stress wave propagation in repair systems using wavelet approach, RILEM PRO 51 (CD): Advances in Concrete through Science and Engineering, Canada.
Kwaśniewski, L., Garbacz, A., 2008, Characterization of stress wave propagation in impact-echo method using FEM mod-els of repair systems, Challenges for Civil Construction, FEUP, Portugal, 92-93 + CD.
Pretorius, J. and Kruger, D. 2001. The influence of surface roughness on the bond strength of concrete repairs. In: ICPIC 2001, Xth International Congress on Polymers in Concrete, USA, p.13 (CD).
Sadowski Ł, Hoła J. 2014. New nondestructive way of identi-fying the values of pull-off adhesion between concrete lay-ers in floors, Journal of Civil Engineering and
Manage-ment, 20 (4), 561-569
Sansalone M., Carino N.J. 1989. Detecting delamination in concrete slabs with and without overlays using the impact-echo method, ACI Materials Journal 86.
Santos, P., Júlio E., Santos, J. 2011. Towards the development of an in situ non-destructive method to control the quality of concrete-to-concrete interfaces, Eng.Struct., 32(1), 207-217.
Silfwerbrand, J. Paulsson, J. 1998. Better bonding of bridge deck overlays. Concrete International. 20 (10): 56-61. Silfwerbrand, J. Beushausen, H. 2006. Bonded concrete
over-lays – bond strength issues, Concrete Repair, Rehabilitation and Retrofitting (Eds. H. Beushausen, F. Dehn and M.G. Alexander), Taylor & Francis Group, London, 61-66. 0 0.02 0.04 0.06 0 20 40 60 80 100 120 frequency [kHz] re la ti v e a m p li tu d e
f bottom f interf ace
0.001 0.003 0.005 0.007 0 20 40 60 80 100 120 frequency [kHz] a m p li tu d e 0.001 0.003 0.005 0.007 0 20 40 60 80 100 120 frequency [kHz] a m p li tu d e