The MIT Faculty has made this article openly available. Please share how this access benefits you. Your story matters.
Citation Marmar, E.S., S.G. Baek, H. Barnard, P. Bonoli, D. Brunner, J. Candy, J. Canik, et al. “Alcator C-Mod: Research in Support of ITER and Steps Beyond.” Nuclear Fusion 55, no. 10 (July 30, 2015): 104020. As Published http://dx.doi.org/10.1088/0029-5515/55/10/104020
Publisher IOP Publishing
Version Author's final manuscript
Citable link http://hdl.handle.net/1721.1/108746
Terms of Use Creative Commons Attribution-Noncommercial-Share Alike Detailed Terms http://creativecommons.org/licenses/by-nc-sa/4.0/
December, 2014
Plasma Science and Fusion Center Massachusetts Institute of Technology
Cambridge MA 02139 USA
This work supported in part by US Department of Energy, DE-FC02-99ER54512-CMOD, DE-AC02-09CH11466, DE-FG02-96ER-54373, DE-FG02-94ER54235.
Reproduction, translation, publication, use and disposal, in whole or in part, by or for the United States government is permitted.
Disclaimer: The views and opinions expressed herein do not necessarily reflect those of the ITER Organization.
Submitted for publication in Nuclear Fusion.
Alcator C-Mod: Research in support of ITER
and steps beyond
ES Marmar1, SG Baek1, H Barnard1, P Bonoli1, D Brunner1, J Candy2, J Canik3, RM Churchill4, I Cziegler5, G Dekow1, L Delgado-Aparicio4, A Diallo4,
E Edlund4, P Ennever1, I Faust1, C Fiore1, Chi Gao1, T Golfinopoulos1, M Greenwald1, ZS Hartwig1, C Holland5, AE Hubbard1, JW Hughes1, IH Hutchinson1,
J Irby1, B LaBombard1, Yijun Lin1, B Lipschultz6, A Loarte7, R Mumgaard1, RR Parker1, M Porkolab1, ML Reinke6, JE Rice1, S Scott4, S Shiraiwa1, P Snyder2,
B Sorbom1, D Terry1, JL Terry1, C Theiler8, R Vieira1, JR Walk1, GM Wallace1, A White1, D Whyte1, SM Wolfe1, GM Wright1, J Wright1, SJ Wukitch1
and P Xu1
1Plasma Science and Fusion Center, Massachusetts Institute of Technology,
Cambridge, MA, USA,
2General Atomics, San Diego, CA USA
3Oak Ridge National Laboratory, Oak Ridge, TN, USA 4Princeton Plasma Physics Laboratory, Princeton, NJ, USA 5University of California San Diego, San Diego, CA 6University of York, York, United Kingdom 7ITER Organization, St. Paul lez Durance, France
ES Marmar1, SG Baek1, H Barnard1, P Bonoli1, D Brunner1, J Candy2, J Canik3, RM Churchill4, I Cziegler5, G Dekow1, L Delgado-Aparicio4, A Diallo4, E Edlund4, P Ennever1, I Faust1, C Fiore1, Chi Gao1, T Golfinopoulos1, M Greenwald1, ZS Hartwig1, C Holland5, AE Hubbard1, JW Hughes1, IH Hutchinson1, J Irby1, B LaBombard1, Yijun Lin1, B Lipschultz6, A Loarte7, R Mumgaard1, RR Parker1, M Porkolab1, ML Reinke6, JE Rice1, S Scott4, S Shiraiwa1, P Snyder2, B Sorbom1, D Terry1, JL Terry1, C Theiler8, R Vieira1, JR Walk1, GM Wallace1, A White1, D Whyte1, SM Wolfe1, GM Wright1, J Wright1, SJ Wukitch1 and P Xu1
1Plasma Science and Fusion Center, Massachusetts Institute of Technology, Cambridge, MA, USA,
2General Atomics, San Diego, CA USA
3Oak Ridge National Laboratory, Oak Ridge, TN, USA 4Princeton Plasma Physics Laboratory, Princeton, NJ, USA 5University of California San Diego, San Diego, CA 6University of York, York, United Kingdom
7ITER Organization, St. Paul lez Durance, France
8Centre de Recherches en Physique des Plasmas, Lausanne, Switzerland
Abstract. This paper presents an overview of recent highlights from research on Alcator C-Mod. Significant progress has been made across all research areas over the last two years, with particular emphasis on divertor physics and power handling, plasma-material-interaction studies, ELM-suppressed pedestal dynamics, core transport and turbulence, and RF heating and current drive utilizing Ion
Cyclotron and Lower Hybrid tools. Specific results of particular relevance to ITER include: inner wall SOL transport studies that have led, together with results from other experiments, to the change of the detailed shape of the inner wall in ITER; runaway electron studies showing that the critical electric field required for runaway generation is much higher than predicted from collisional theory; core tungsten impurity transport studies reveal that tungsten accumulation is naturally avoided in typical C-Mod conditions.
1. Introduction
Alcator C-Mod combines high magnetic field, advanced shaping and divertor configurations, and the ability to operate with solid all-metal plasma-facing components. Because of its relatively compact size, C-Mod accesses regimes of extreme edge power density (1 MW/m2 average through the surface of the plasma); SOL power widths are of order of a few mm, implying mid-plane parallel power flows >1 GW/m2, matching and even surpassing the design for ITER, and reaching the levels envisioned in DEMO power plants. Significant progress has been made across all research areas over the last two years, with particular emphasis on divertor physics and power handling, ELM-suppressed pedestal dynamics, core transport and turbulence, and RF heating and current drive utilizing Ion Cyclotron and Lower Hybrid tools.
2
I-mode, a naturally ELM-suppressed enhanced energy confinement regime, has been extended both to lower and higher magnetic fields. The window for entering and remaining in I-mode (between L- and H-mode) clearly widens at high field, important for consideration of extrapolation to ITER and high field reactors. Lower Hybrid frequency range microwaves have been used to modify the edge plasma, leading to increased pedestal pressure and improved confinement in H-modes. Studies of inter-ELM pedestal stability and fluctuations reveal an edge mode with many of the characteristics of Kinetic Ballooning, and direct correlation with pedestal saturation is directly observed. New tools are applied to yield detailed characterization of edge/SOL fluctuations: the mirror Langmuir probe, gives local measurements of Te, ne, p and their fluctuations, from a single probe, with msec time resolution, revealing unprecedented detail of the Quasi-Coherent Mode responsible for particle transport regulation in the EDA H-mode pedestal. Active MHD probing of the QCM, using a dedicated antenna (“shoelace”), shows that the mode can also be driven during ELM-free H-mode, where the QCM is not driven naturally by the free-energy in the plasma edge. Gyrokinetic simulations, which for the first time combine ion and electron scale turbulence, with realistic mass ratio, indicate that electron scale turbulence plays an important, even dominant role, in the core electron heat flux for L-mode plasmas, and may explain the under-prediction of experimentally observed e seen in the more standard, ion-scale simulations. A detailed series of studies of the phenomena across the change from Linear Ohmic Confinement (LOC, tEn) and Saturated Ohmic Confinement (SOC) reveals strong correlations between the LOC-SOC transition and changes in core intrinsic rotation, core temperature response to edge cooling perturbations, and up-down asymmetries in impurity densities at the edge plasma. Many of the observations appear consistent with transport being dominated by ion temperature gradient (ITG) modes above a critical collisionality, with trapped electron modes (TEM) prevalent at below this critical collisionality. Results from an ICRF antenna which is aligned with the total local magnetic field, show that this modification can completely eliminate RF induced impurity sources local to the antenna and its protection limiters, the first demonstration of a reactor compatible antenna constructed entirely of high-Z metal. The important role of edge parametric decay instability (PDI) at high density has been documented in Lower Hybrid Current Drive studies. PDI is a significant player in the observed roll-off in current drive efficiency seen at high edge electron density. The first in-situ, between-shot surface analysis system, which can interrogate large regions of the plasma facing wall, has been successfully implemented, and used to study effects of wall conditioning and plasma-surface interactions during tokamak pulses.
Specific results of particular relevance to ITER, described in Section 6, include: inner wall SOL transport studies that have led, together with results from other experiments, to changes in the detailed shape of the inner wall in ITER; runaway electron studies showing that the critical electric field required for runaway generation is much higher than predicted from collisional theory; core tungsten impurity transport studies which reveal that tungsten accumulation is naturally avoided in typical C-Mod conditions, and extrapolation to ITER indicates that the situation should be similar there.
3 2. Pedestal Dynamics
2.1 I-Mode, a Naturally ELM-Suppressed Regime
I-Mode is a promising ELM-suppressed regime that combines H-mode-like energy confinement with L-mode-like particle and impurity transport[1]. The key defining feature of the regime is the appearance of an edge temperature pedestal, similar to that in H-mode, while the edge density profile remains unchanged from L-mode. Hence, particle and thermal transport are decoupled, an important feature for studying pedestal physics. High particle transport has a number of potentially important advantages for fusion energy over the H-mode regime, including lower intrinsic impurity and radiation levels which do not build up over time, less accumulation of helium ‘ash’ from fusion reactions, and compatibility with seeding to reduce divertor heat loads. Without a particle barrier, densities can also be more readily controlled by fueling or pumping[2]. Another key advantage is that the regime is naturally ELM-free, giving stationary conditions for many E without the need for active means to suppress ELMs.
The I-mode regime has been most extensively and routinely studied in Alcator C-Mod[1]. As reported in the IAEA FEC 2012[3], stationary I-mode plasmas with energy confinement reaching or often exceeding the ITER H98,y2 scaling have been demonstrated over a wide range of plasma conditions. Experiments in the 2014 campaign have further extended the range of parameters, and improved the characterization of profiles and fluctuations. The lower field range has been extended to 2.8 T, using second harmonic D(H) heating, and some examples of I-mode have been noted in earlier 8 T experiments with D(3He) ICRH. I-modes have also been maintained in near double-null configurations, with dRsep as low as 1.5 mm, where dRsep is the distance between the primary and secondary x-point flux surfaces at the outboard midplane.
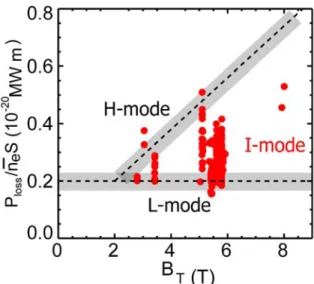
A recent experiment was carried out on C-Mod to assess the toroidal field dependence of the power range in I-mode. Discharges at 2.8 T, 550 kA, were heated using second harmonic D(H) ICRH. The observed power and density ranges for I-mode were much lower than for 5.4 T discharges with the same q95 and shape; L-I transitions occurred with Ploss=1.46 MW, while discharges transitioned to H-mode at only Ploss=1.54MW. This very narrow (5%) power range contrasts strongly with the much wider range seen at 5.6 T, and is closer to that observed on DIII-D[4]. Figure 1 shows normalized power Ploss/ne S vs. BT. It appears that the lower bound of L-I thresholds has a weak BT dependence, less than linear, and perhaps even independent of B; a value of P/nS=0.15-0.25x1020MW-m is consistent with the transition data. For comparison the L-H threshold scales ~B0.8[ 5]. The upper bound of I-mode powers increases strongly with BT; we note that many of the I-mode discharges with BT > 5 T, and all at 8T, are limited by available
Figure 1: Normalized power Ploss/neS, vs BT.
Experimental points (solid circles) are for I-mode discharges.
4
heating power; the 8 T discharges used a D(3He) ICRF scheme with low single pass absorption, hence the loss power may be overestimated. More experiments are required to confirm this trend of increasing power range for I-mode with higher BT, and to understand the underlying physics; we also note that some L to H transitions also occur within the “I-mode” window. However, these results are also consistent with observations from the low field DIII-D and ASDEX-U devices, where, to date, the window for obtaining I-mode is significantly smaller than it is on C-Mod with BT>5T. This may well explain the different experience in terms of robustness of the regime on C-Mod (at B > 5 T) [4]. Additional experiments to study and optimize I-mode at 8 T are planned on C-Mod.
In addition to the suppression of broadband turbulence seen in the I-Mode edge/pedestal region, core turbulence is also suppressed. Recent studies using reflectometry and Correlation ECE[6] show that long wavelength (ks<0.5) density fluctuations decrease from L-mode levels by up to 30% in I-mode, while long wavelength (ks<0.3) Te fluctuation levels decrease by up to 70%. This reduction in core turbulence is correlated with the increases in E in I-mode compared to L-mode. As the pedestal temperature increases across the L-I transition, core density fluctuations (0.40<<0.95) are reduced prior to the onset of the edge-localized (~0.99) weakly coherent mode (WCM)[1] and prior to the reduction of low frequency turbulence turbulence at this extreme edge radius, but simultaneous with the reduction near the pedestal top (~0.95). This result helps add to our understanding of the dynamics of confinement transitions such as I-mode, particularly compared to H-mode where changes in edge turbulence are more typically observed to occur prior to changes in the core.
In addition to its highly favorable scalings of pedestal structure and overall performance, I-mode operation appears to have naturally occurring suppression of large ELMs. Extensive study of ELMy H-mode has led to the development of the EPED model, which utilizes calculations of coupled peeling-ballooning MHD modes and kinetic-ballooning mode (KBM) stability limits to predict the pedestal structure preceding an ELM crash[7,8]. In contrast, MHD calculations using ELITE indicate that I-mode pedestals are strongly stable to edge peeling-ballooning instabilities. Numerical modeling of the KBM turbulence onset, and scalings of pedestal width with p indicate that I-mode pedestals are not limited by KBM turbulence – both features identified with the trigger for large ELMs, and consistent with the observed absence/suppression of large ELMs in I-mode. Analysis of structure and scaling of C-Mod I-mode pedestals reveals favorable scalings for extrapolation to large tokamaks[2] –pedestal temperature scales strongly with power per particle, Pnet/ne, and pedestal pressure increases as net heating power, consistent with the observed weak degradation of confinement with heating power and consistent with pedestals which are not saturating near stability limits[1]. Discharges matched in current, field and shaping demonstrate the decoupling of energy and particle transport in I-mode, and with increased fueling, can span nearly a factor of two in density while maintaining matched pedestal temperatures at constant power/particle. H-mode density pedestals, in contrast, respond only weakly to fueling or pumping [9].
5
2.2 Lower Hybrid Pedestal Modifications to Improve H-mode
Injecting Lower Hybrid Range of Frequencies (LHRF) waves into Alcator C-Mod’s high-density H-mode plasmas has enhanced global energy confinement by increasing pedestal temperature and pressure gradients, while at the same time decreasing the separatrix density, modifying the pedestal radial electric field and rotation, and decreasing edge turbulence[10]. These experiments indicate that edge LHRF can be used as an actuator in these plasmas to increase energy confinement via modification of boundary quantities. Ray-tracing modeling and accessibility calculations for the LH waves indicate that they do not penetrate to the core region and are not driving current in these plasmas, and indeed neither of the two main diagnostics for detecting the presence of fast electrons accelerated by LH waves (the multi-chord hard x-ray array and the electron-cyclotron emission system) sees changes indicative of current-drive. Instead the LH power modifies the pedestal by increasing electron and ion temperatures at the pedestal top, reducing the density there slightly with a much larger reduction of the density at the separatrix. As a result, the electron pressure gradient in the pedestal increases significantly. The major changes to the core plasma temperatures and densities, responsible for the increased stored energy and confinement, are consistent with their responding via profile stiffness to the changes occurring in the pedestal.
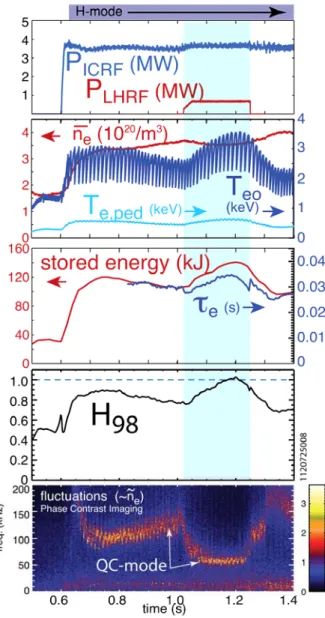
When moderate amounts of LH power (PLH/Ptot~0.15) are applied to high-density EDA H-modes ( ~3.5x10²⁰ m-3) with H-factors (H98) less than 1, we observe that the global energy confinement is improved such that H98 increases to ~1 (from as low as 0.75). There is a trend that the improvement is reduced when the confinement quality of the target H-mode plasma into which the LHRF is injected is higher. However, in a minority of cases the H98-factor is raised significantly above 1 with the LHRF. In addition to the changes to Te,ped, Ti,ped, ne,ped, the improvement is accompanied by the following effects in the edge: co-current pedestal rotation
Figure 2: During the injection of modest power Lower Hybrid RF (shaded period), the H98-factor
increases significantly. Pedestal pressure gradients rise substantially and edge turbulence is further suppressed during the same period.
6
velocities increase[11]; power to the (outer) divertor target increases promptly with an increment that is ~1/2 of the injected LH power, qualitatively consistent with the inaccessibility of the LH waves; the central frequency of the edge-localized Quasi-Coherent Mode (QCM) down-shifts, becomes more coherent, and becomes more constant in time; and the broadband mid-frequency (100-300 kHz) density fluctuations in the pedestal region decrease. Some of these effects are shown in Figure 2. There is good correlation between the confinement improvement and increased pedestal pressure gradients, as well good correlation between the confinement improvements and decreases in mid-frequency pedestal fluctuations.
7 2.3 Inter-ELM Pedestal Stability and Fluctuations
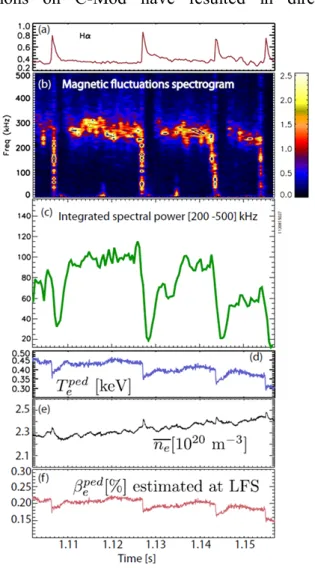
Experiments studying inter-ELM edge fluctuations on C-Mod have resulted in direct observations of relatively coherent edge
density fluctuations, and there is strong evidence that they are responsible for clamping the pedestal pressure prior to the ELM crash [12]. The fluctuations are absent immediately following an ELM crash and show a clear onset following the rebuild of edge Te. An example of some of the measurements is shown in Figure 3. Once the coherent fluctuations turn on, edge Te saturates, as does the amplitude of the fluctuations, suggesting that they are responsible for an increase in edge transport which limits the growth of Te. Stiff mode onset at a critical edge electron beta value is consistent with expectations for KBM turbulence. Characterization of the fluctuations in frequency and wavenumber shows that the mode propagates in the electron diamagnetic direction in the lab frame, with ks ~ 0.04. Due to uncertainties in the measured ExB velocity, and in the radial localization of the mode, it is not possible to determine with certainty the plasma frame propagation direction. However, measurements are compatible with an ion-directed mode propagating at less than 10km/s. This would be consistent with a KBM, although we cannot rule out that the mode propagates in the opposite direction, consistent with electron modes such as micro-tearing. Linear gyrokinetic calculations with the code GS2 indicate ion-directed (in plasma frame) modes with KBM properties are most
unstable in a wavenumber range consistent with that measured in experiment [13]. Altogether these results are consistent with a pedestal that is limited by both KBMs and peeling-ballooning modes, as assumed by the EPED predictive model.
Figure 3: a) ELMs as seen in edge D b)
Magnetic fluctuation spectrogram showing inter-ELM fluctuations; c) Spectral amplitude
integrated from 200 to 500 kHz; d) Edge Te
evolution from ECE; e) line-average ne; f)
8
2.4 Passive and Active Tools for Probing Edge Fluctuations
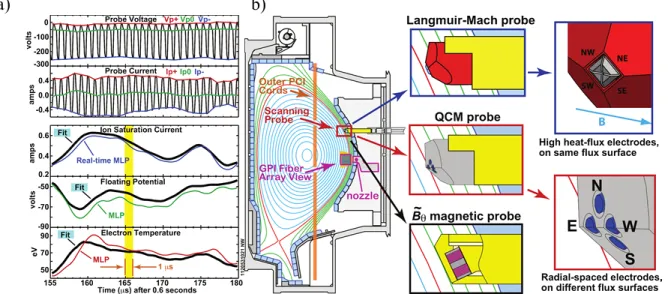
Two new research tools – a Mirror Langmuir Probe[14-16] and a “Shoelace” antenna ([17-19]) – have been employed to diagnose and actively perturb fluctuations in the Alcator C-Mod tokamak edge plasma. Both tools elucidate the physics associated with the Quasi-Coherent Mode (QCM, cm−1, f∼50−200 kHz), the edge fluctuation responsible for the increased particle flux which sustains the steady-state, ELM-free Enhanced Dα H-mode. In particular, the MLP has been used to characterize the QCM with unprecedented detail, showing it to be primarily a drift wave, with curvature also playing an important role. In addition, the Shoelace antenna [17] inductively drove a fluctuation localized in the edge plasma and resonant at the QCM k and frequency, representing the first time a drift-wave-like fluctuation has been driven actively in the tokamak edge.
2.4.1 Mirror Langmuir Probe
The Mirror Langmuir Probe (MLP) approach uses an individual electrode as a triple probe [14-16]. This is accomplished by rapidly switching the probe bias voltage between a large negative (ion saturation), a near-floating, and a large positive (electron collection) state, with the entire cycle through all three states completed in 0.9 μs for a 1.1 MHz sampling rate. This is fast enough to resolve turbulent and coherent fluctuations in the edge, typically band-limited below 500 kHz on Alactor C-Mod. The three voltage set points are selected via real-time feedback by an analog computer which “mirrors” the actual I/V characteristic of the Langmuir probe, adjusting and optimizing the three parameters in the probe current model,
1 , (1)
where Ip is the current through the MLP, Is is the saturation current, Vf is the floating potential, Te is the electron temperature (in eV), and V is the applied voltage. The direct parameters of this model are Is, Vf, and Te. The electron density, ne, is extracted from the saturation current using the Bohm sheath condition, while the local plasma potential, Φ, is calculated from the plasma sheath drop model [20].
Figure 4 summarizes the operation of the probe, showing the rapid scanning of the probe voltage and the corresponding I/V curve parameters. The current through the probe is also shown. The MLP circuitry ensures that the voltage bias set points are optimized for rapid and well-conditioned assessment of the entire I/V characteristic. The resultant characteristic, which is made available every 0.9 μs, can be fit to yield the floating potential, saturation current, and temperature. These fitted values are shown as the thick black traces in the bottom three panes of the figure, where they are compared with the real-time output computed by the MLP circuitry (thin, colored lines). While the fitted values are preferred for data analysis, the comparison reveals the high-quality of the MLP system’s real-time determination of I/V parameters.
Two probe geometries used in conjunction with the MLP circuitry are shown in Figure 4(b). Both configurations employ four tungsten probes, closely-spaced to resolve the wave numbers associated with the turbulent and coherent fluctuations typical to the C-Mod edge. Each probe is
9
driven by a separate MLP circuit, yielding four independent sets of measurements of ne, Te, and Φ. The electrodes of the Langmuir-Mach probe sit on a single flux surface, and are designed for high heat flux. The other probe design, with radially-spaced electrodes, allows separate measurements of fluctuations and profiles at the front and in the wake of the plunging probe head, helping to determine whether the probe perturbs the local plasma. A pneumatic driver inserts and retracts the head though an in-going and out-going scan of ∼15 mm lasting about 20 ms.
The unique feature of the MLP is that it provides simultaneous measurements of ne, Te, and Φ of both fluctuations and the background profiles in which they are immersed. The resulting data set is ideally suited to diagnose the plasma edge. The relative phases between fluctuating quantities provide an excellent discriminant for the underlying mode physics, while also giving a direct estimate of the particle and energy transport associated with the disturbances. Because there is no ambiguity in how the fluctuation and profile measurements align, the data allow for robust, spatially-resolved comparison between experimental fluctuation measurements and theoretical models, which use the high-fidelity experimental profiles from the MLP as input. In addition, the data across multiple electrodes constrain the fluctuation dispersion relation in both the laboratory and plasma frames.
Figure 5 shows data from the MLP obtained in a discharge bearing a QCM [16]. The plot shows the total ne, Te, Φ, and Is signals gathered from one of the four available electrodes, plotted against distance from the last-closed flux surface (LCFS). It is important to note that the rapidly-varying components of the signals are not noise, but direct measurements of the plasma fluctuations, themselves; the smoothed, time-averaged profiles are also plotted. Based on the measured Te profile, power balance considerations require that the electron temperature at the LCFS be in the range of 50 to 60 eV; i.e., this produces a power loss via electron parallel conduction on open field lines that accounts for the power entering into the scrape-off layer (ohmic input power minus radiation). In Figure 5, the profiles are shifted so that = 0 corresponds to the location where the time-averaged Te (black curve) is 50 eV, placing the peak in the Isat fluctuation power profile roughly at the LCFS. Shifting the profiles to align Te = 60 eV at = 0, would place the peak fluctuation power about 2 mm into the scrape off layer. In any case, these data tell us that the QCM lives at the location where Te is ~50 eV and occupies a 3 mm (full-width at half-maximum) layer which spans the LCFS, commensurate with the well-established role played by the QCM in regulating the pedestal. The radial electric field – supplied by the MLP’s Φ profile – points outward at this location, making the directions of the electron diamagnetic and E×B drift velocities oppose one another. This means that the mode rotates in the electron diamagnetic drift direction not only in the laboratory, but also the plasma frame, an insight not demonstrated prior to the availability of these results, and only achieved by the simultaneous measurements of profile and fluctuations afforded by the MLP.
The MLP registered strong fluctuations on the order of ne/ne ~30% and
% 45 ~ / ~ / e e e T T T
for the QCM. Crucially, around the separatrix, the phase difference between potential and density fluctuations was also determined, with ~ lagging ñe by ∼16°, as demonstrated in Figure 5(b). This near-Boltzmann response is nonetheless large enough to produce an outward radial flow at 10 m/s, corresponding to a particle flux of ~1.4x10²¹m-2s-1. The small phase lag between ~ and ñe establishes the identification of the QCM as
drift-wave-10
like. At the same time, MLP measurements, combined with Mirnov coil data, indicate a significant interchange component in the mode drive, and recent data suggest that further up the pedestal, the phase difference between ~ and ñe may increase. The importance of curvature in the QCM physics is also expected given the QCM’s ballooning shape [21].
11
a) b)
Figure 4: (a) MLP operation. Top trace shows voltage applied to Mach-probe tip. Underneath, the probe current trace, followed by Is, Φ, and Te, showing both real-time outputs of the MLP circuitry (thin colored lines) and values fitted to the I/V characteristic (thick black lines). (b) Probe geometries employed on C-Mod with MLP drive: Langmuir-Mach and radial “QCM” probe heads. A Mirnov coil head may also be fitted. From [16].
a) b)
Figure 5: (a) Profiles of ne, Te, and Φ, as well as Is fluctuation power, obtained by the MLP from a discharge with a QCM. (b) “Lissajous” figure plotting the ñe and ~ signals against one another. The signals are almost co-linear on the plot, indicating a small relative phase angle (ñe leads ~ by ∼16°). From [16].
12
2.4.3 Shoelace Antenna
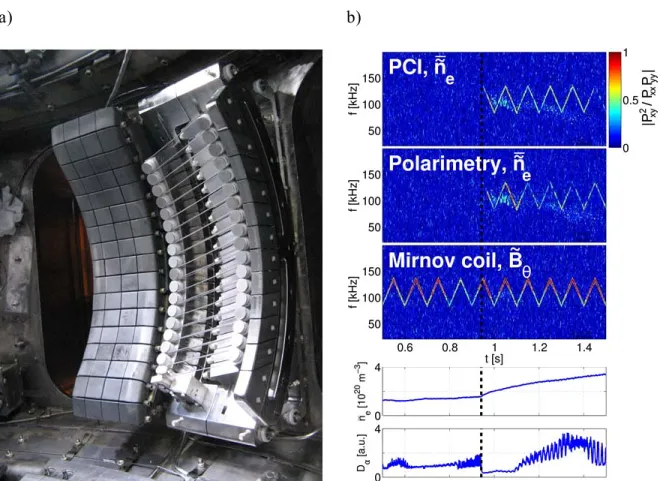
Complementing the MLP’s passive diagnosis of the QCM is an attempt to drive the mode directly using a “Shoelace” antenna [17,19]. The inspiration for exciting the mode inductively derives from the fact that the QCM possesses a magnetic signature [22]; the Shoelace antenna induces a current pattern that mimics this signature in the hope that it may couple to the QCM. Figure 6a shows a photograph of the antenna mounted inside the Alcator C-Mod vacuum vessel. The single molybdenum winding zigzags back and forth across the support structure like a shoelace, climbing upward once and then back down to form 19 “rungs” in each of two layers. The rungs are nominally field-aligned, and are spaced to reproduce the measured perpendicular wave number of the QCM, k =1.5 cm−1 [16, 21, 22, 23].
a) b)
Figure 2: (a) Profiles of ne, Te, and Φ, as well as Is fluctuation power, obtained by the MLP from a discharge with a QCM. (b) “Lissajous” figure plotting the ñe and ~ signals against one another. The signals are almost co-linear on the plot, indicating a small relative phase angle (ñe leads ~ by ∼16°). From [Error! Reference source not found.].
a) b)
Figure 6: (a) The Shoelace antenna mounted inside Alcator C-Mod. (b) Short-time magnitude squared
coherence between the antenna current and PCI, polarimeter, and Mirnov coil fluctuation signals. The en and
Dα traces are reproduced from[17].The time of the L- to H-mode transition is shown by the vertical dashed lines.
13
The antenna vacuum field falls off rapidly, with a radial e-folding length ∼k−1= 23 cm,
necessitating a very narrow gap between the plasma and the antenna, only ∼3 mm away from the LCFS at closest approach. The rapid spatial attenuation of the vacuum field also necessitates high coupling efficiency between the RF power supply and the antenna to maximize the induced perturbation. This is accomplished with a custom matching network; in the experiments presented here, it coupled ∼2 kW of RF source power at an end-to-end efficiency of 85% or better, resulting in an antenna current ≥80 A, at an arbitrary and rapidly tunable frequency in the band between 45 and 300 kHz [18]. A phase lock system also provides the ability to lock to the fluctuation signal of a QCM in real time.
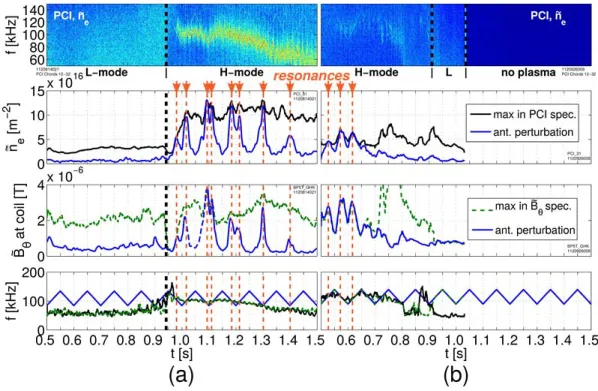
Figure 7: From top to bottom: a PCI spectrogram, a comparison of the estimated coherent fluctuation magnitude, IAHxy, versus the peak amplitude in the fluctuation spectrum for a PCI chord signal; the same analysis for a Mirnov coil signal, and the location of the PCI and Mirnov peak frequencies plotted with the antenna frequency. Figure 7a shows data from a forward field discharge with a strong background QCM, while Figure 7b shows data from a reversed field discharge without a pronounced QCM. Despite the lack of a QCM in Figure 7b, the antenna response is still peaked. Adapted from [17].
Figure 6(b) shows short-time cross-coherence spectra – the cross-power between the antenna current and a diagnostic signal, normalized by the product of the autopowers of the two signals, Cxy=Pxy/ PxxPyy – from a discharge in which the antenna was energized. The spectra are given for three fluctuation diagnostics: a phase contrast imaging (PCI)[24] chord measuring ñe, a polarimetry chord [25] with signal primarily ∝ , and a Mirnov coil sensitive to B~ . The
14
antenna is energized for the duration of the discharge’s 1 s current flattop; its frequency is swept between 85 and 135 kHz in a triangular waveform with a 100 ms period. It excites a B~
fluctuation throughout the discharge that is coherent with the antenna current; however, immediately after the transition to H-mode, a coherent density response is also observed. The density response first appears prior to the onset of an intrinsic QCM, and is maintained throughout the EDA phase of the H-mode.
Analysis of the coherent ñe and B~ responses shows that they are approximately field-aligned, k ≫k∥, and exhibit the same k =1.5 cm−1 as that imposed by the antenna. Moreover, while the antenna has no structurally-preferred perpendicular launch direction, the driven mode selects a laboratory-frame phase velocity in the electron diamagnetic drift direction.
The plasma response to the antenna is strongly peaked at the QCM center frequency,
indicating a resonance with a weak normalized damping rate, γ/ω=5−10%. Figures 7a and b show this peaked response by comparing the peak amplitude in the background spectrum to the
amplitude of the coherent perturbation, estimated from the product of the antenna current, IA, with the transfer function, Hxy=Pxy/Pxx, between IA and the fluctuation signal; the fluctuation amplitudes are comparable. It is noteworthy that the antenna also drives a resonant fluctuation of smaller, but similar, magnitude in discharges without an intrinsic QCM (Figure 7b). This might suggest that a similar damped drift-wave resonance is available both in EDA and ELM-free H-modes, and that the plasma enters the EDA H-mode when a source of free energy is coupled to this mode. From the ballooning nature of the QCM, we may speculate that this free energy derives from a curvature-driven instability appearing further up the pedestal, coupling to and exciting the damped drift-wave at the LCFS, which, in turn, is responsible for expelling particles across the plasma boundary and sustaining the H-mode. However, additional experiments are needed to determine whether such a scenario is, in fact, the mechanism underlying the QCM. 2.5 Poloidal Variation of Pedestal Parameters
On C-Mod, the operating regimes with differing combinations of pedestals in edge density and/or temperature (L-, I-, and H-mode) provide a unique testbed for the effects of strong gradients on plasma transport in the pedestal region.
15 Measurements at two separate poloidal locations on C-Mod show that, in plasmas with edge density and/or temperature pedestals, significant poloidal asymmetries can arise in density, temperature, and electric potential in the confined edge region[26-28]. These asymmetries are especially pronounced in plasmas with strong electron density gradients (i.e. H-mode).
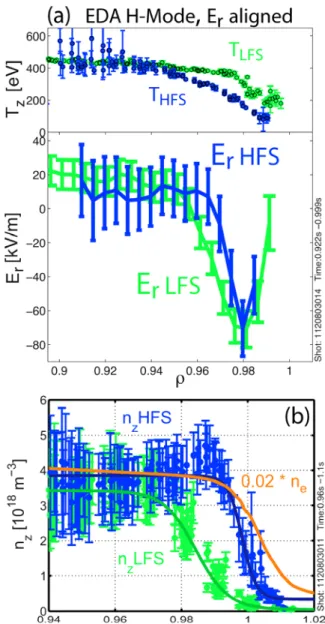
Example measurements from an EDA H-mode are shown in Figure 8. Part (a) shows measurements of impurity temperature and radial electric field measured across the pedestal region at both the HFS and LFS midplane. Constraining the uncertainty in the relative alignment of HFS and LFS profiles, by requiring total pressure to be a flux function, results in an approximate alignment of the Er wells. As shown in Figure 8 (a), the impurity ion temperature in the steep gradient region is then nearly 125 eV larger at the LFS, corresponding to a factor ~1.7. These variations in ion temperature were quantitatively reproduced by the total-f gyrokinetic neoclassical code XGCa, and further revealed variations in electron density of the same order (~1.7), being higher at the HFS [28]. The poloidal variations in main ion density and temperature can potentially have an effect on the impurities in the pedestal region. Indeed, large in-out impurity density asymmetries on the order of ~6x are observed in the H-mode pedestal region (see Figure 8(b)), but are absent in L- and I-mode plasmas [26]. This suggests that retaining non-local transport effects due to steep gradients, including resulting poloidal variation in main ion
density and temperature, are important for understanding pedestal impurity transport. We note that the I-mode results separate the n and T pedestal effects, since both go up in tandem for H-mode, while only the temperature gradient is modified in I-mode.
Figure 8: Inboard-outboard asymmetries in the EDA H-mode pedestal. (a) shows HFS and LFS profiles of impurity temperature and radial electric field. (b) shows HFS and LFS profiles of impurity density together with the profile of electron density (rescaled).
16 3. Core Transport and Turbulence
3.1 Realistic Mass, Multi-Scale Gyrokinetic Simulations of an Alcator C-Mod Discharge
Despite decades of research, electron heat transport in the tokamak core remains both poorly understood and extremely important for the success of ITER and future fusion devices. It is generally assumed that long wavelength (ion-scale: ks ~1.0) turbulence accounts for almost all heat and particle transport in the tokamak core. However, recent gyrokinetic simulations performed on the Alcator C-Modtokamak suggest that long wavelength turbulence may be insufficient for describing electron heat transport in the core of some standard tokamak discharges[29-32]. In particular, long wavelength turbulence simulations have demonstrated up to ~3x under-predictions of the experimental electron heat flux that cannot be explained within the uncertainties in input parameters[32].
In an attempt to resolve this discrepancy, nonlinear gyrokinetic simulations that simultaneously capture both the ion (ks ~1.0) and electron (ke ~1.0) spatio-temporal scales have been performed in the core (r/a = 0.6) of a standard, Alcator C-Mod L-mode discharge[33]. These multi-scale simulations, performed using the GYRO code[34], capture ion and electron-scale turbulence up to ks = 48.0; ke = 0.8 and are the first to utilize realistic experimental
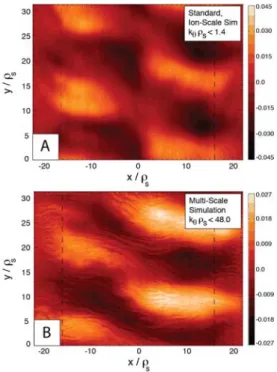
profiles, magnetic geometry, impurities and realistic electron mass ratio ((mD/me)1/2 = 60.0), allowing for the first quantitative comparison of multi-scale simulation with experiment. The high fidelity of these simulations makes them amongst the most computationally expensive gyrokinetic simulations performed to date, requiring 20 Million CPU hours on the NERSC Hopper supercomputer for the completion of two simulation conditions. As demonstrated in Figure 9, electron-scale turbulence was found to play a significant, even dominant role in the core of a standard L-mode discharge, driving experimentally-relevant levels of electron heat flux in the form of radially elongated ETG “streamers” (with ks ~ 6.0) that coexist with large, ion-scale (with ks ~ 0.4) turbulent eddies. The effect of these ETG streamers is two-fold. In addition to driving heat flux at small scales, the inclusion of the electron-scale physics and instabilities is demonstrated to enhance both the electron and ion heat fluxes arising from long wavelength (ion-scale) turbulence. The increase in long wavelength heat fluxes implies cross-scale coupling between the ion and electron-cross-scales and is the subject of ongoing work. When compared with the standard, long wavelength simulation, a ~150% increase in the simulated electron heat flux was found in the multi-scale simulation. This drastic increase in electron heat flux appears to explain the well-documented discrepancy between ion-scale simulation and
Figure 9: (A) Turbulent potential fluctuations from a long wavelength, ion-scale simulation. (B) potential
fluctuations from a first of a kind, coupled short and long wavelength, multi-scale turbulence simulation.
17
experimental electron heat fluxes, and represents an important step towards the development of a predictive transport model.
18
3.2 Non-local Heat Transport and the Transition from the Linear Ohmic to the Saturated Ohmic Regime
There are several longstanding mysteries in tokamak research, including: explanation of the observed edge up/down impurity density asymmetries[35], the mechanism governing the
linear Ohmic confinement (LOC, also known as neo-Alcator scaling) regime and the transition to saturated Ohmic confinement (SOC, L-mode)[36], and the underlying cause of `non-local electron heat transport' following cold pulses[37]. A recent mystery to add to this list is the rotation reversal
process[38-40], in which the core toroidal rotation abruptly switches direction, with negligible effect on other macroscopic plasma parameters.
Rotation reversals constitute a novel form of momentum transport
bifurcation and have been induced by changes in the collisionality through the density, plasma current and magnetic field. Recently, the connection among rotation reversals, the transformation from LOC to SOC, saturation of electron density profile peaking and changes in turbulence characteristics has been demonstrated[39-42]. This connection has been extended to include `non-local electron heat
transport' and up/down impurity density asymmetries[43,44]. A working
hypothesis suggests that many of these observations are consistent with transport dominated by ion temperature gradient (ITG) modes above a critical collisionality, with trapped electron modes (TEMs) prevalent below the critical collisionality.
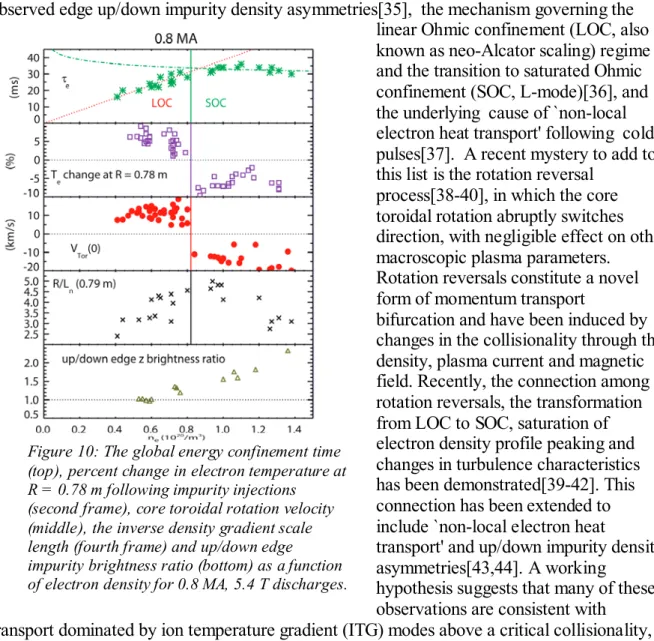
Figure 10: The global energy confinement time (top), percent change in electron temperature at R = 0.78 m following impurity injections (second frame), core toroidal rotation velocity (middle), the inverse density gradient scale length (fourth frame) and up/down edge
impurity brightness ratio (bottom) as a function of electron density for 0.8 MA, 5.4 T discharges.
19 The relationship among energy confinement, non-local heat transport, core toroidal
rotation reversals and particle confinement (including edge up/down impurity density asymmetries) is demonstrated in Figure10, obtained from shot-by-shot scans of the electron density in 0.8 MA, 5.4 T, (q95~4.2) discharges. For this value of q95, there is an abrupt change in the direction of the core toroidal rotation velocity (middle frame) from co-current below an electron density of 0.82x10²⁰m-3, to counter-current above. The vertical line indicates this critical density. Also shown is the global energy confinement time (top frame) and the related transition from LOC (shown by the dotted line, neo-Alcator scaling) to SOC (dash-dot line, L-mode scaling) is clear[39, 40 42]. Near this same critical density there is also a saturation of electron density profile peaking [40, 41], as seen in the fourth frame. Shown in the second frame is the percentage change of the
electron temperature just inside of the profile flex point (R~0.79 m, r/a~0.5 for these conditions), evaluated 10 ms following the edge cold pulse. The temperature inside of this radius increases for densities below the rotation reversal and LOC/SOC threshold, and
decreases above the critical density; a critical `non-local' cut-off density has been observed in many experiments. This emphasizes the intimate relationship among `non-local' heat
transport, rotation reversals and confinement saturation. The rotation reversal seems to be the most sensitive indicator of the LOC/SOC transition, since it is easy to detect a change in rotation direction, and this can be determined in a single discharge. In contrast, to ascertain the LOC/SOC transition density, a complete shot-by-shot density scan of the kinetic profiles is required. In the bottom frame of Figure10 is shown the ratio of the Ar16+ forbidden line, z, with brightnesses taken along lines of sight which are tangent to r/a=0.9 from the top and bottom of the plasma. This brightness ratio is indicative of the edge up/down impurity density asymmetry. For low density LOC plasmas, the impurity densities are up/down symmetric, and become asymmetric at higher electron densities, with an impurity density surplus in the direction opposite to the ion BxB drift direction. The threshold for this behavior is
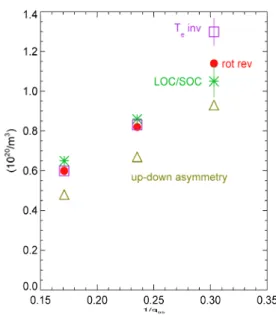
somewhat lower (~0.6x10²⁰m-3) than the reversal, LOC/SOC and Te inversion (non-local cut-off) density, perhaps because this effect is only seen at the plasma edge (r/a~0.9), well outside of the Te profile flex and rotation reversal anchor points. Similar density scans have been carried out for 5.4 T plasmas at 0.55 MA (q95~ 5.8) and 1.1 MA (q95~3.3). The results are summarized in Figure11, showing the critical densities for rotation reversal, non-local cut-off (transient eITB formation), the LOC/SOC transition and edge up/down impurity density profile asymmetry formation, which all increase with plasma current. These effects all occur at a fixed collisionality, ∗neq95= constant). The rotation reversal and LOC/SOC transition are well correlated[39-42], as is the electron temperature non-local cut-off at the lower
Fig 11: The density for rotation reversal (dots), electron temperature inversion (boxes), LOC/SOC transition (asterisks) and up/down impurity brightness
20
currents. The up/down impurity density asymmetry follows the same trend but appears systematically at a lower density. This may be because this effect transpires near r/a~0.9, while the rotation reversal and transient eITB occur more towards the plasma interior. Rotation reversals on C-Mod occur with nq95=constant[39, 40, 42]. Confinement saturation on many devices (with similar aspect ratio) appears to occur with the product nq95constant [42], which is consistent with ∗~constant, since for C-Mod at least, Zeff/Te2 is constant at the transition. These results suggest a unified explanation of several seemingly disparate elements of Ohmic L-mode confinement phenomenology. Central to this unification is the idea that above a critical collisionality, electron-ion collisional thermal coupling will become sufficient to trigger the excitation of ion temperature gradient (ITG) modes, causing a transition from collisionless TEM (CTEM) to ITG dominated turbulence. For this to occur, the coupled power must be comparable to the power transported by CTEMs. Evidence for this CTEM to ITG transition includes changes in both macroscopic parameters and in fluctuation characteristics, and the explanation of several other results follows directly. First, the
disappearance of electron 'non-locality' phenomena in SOC is a consequence of the fact that electron thermal power transfer exceeds power transport, effectively eliminating any electron transport dynamics. In the SOC regime, the power is carried by neo-classical processes and by ITG modes, so that any non-locality should appear in the ion channel. Second, rotation reversal results as a consequence of a change in the sign of the turbulent residual stress, res, the gradient of which sets the intrinsic torque. res is predicted to change sign with the turbulent propagation direction[45] (i.e. electron to ion diamagnetic, as CTEM goes to ITG), consistent with the observation of reversal. Third, an up/down impurity density asymmetry develops with SOC. This may be a consequence of the appearance of robust ITG turbulence driven zonal flows which develop in the SOC regime. Gyro-kinetic simulations suggest that ITG driven zonal flows are larger scale, and more temporally coherent, than CTEM zonal flows. In the SOC case, a coherent zonal ExB shear should develop, and then cause a coherent eddy shift and tilt (in position space), and thus an up/down asymmetry (in ballooning space). An up/down asymmetry in turbulence intensity should then leave a footprint as an up/down asymmetry in impurity density.
21 4. Radio Freqency Heating and Current Drive
4.1 Ion Cyclotron RF Heating
In present day devices, ion cyclotron range of frequency (ICRF) heating and current drive actuators utilize low Z armor and coatings on the antenna and machine to ameliorate RF sources and impurity contamination. In fusion reactors, neither of these techniques is likely to be compatible with reactor conditions. Since the core wave physics issues have been experimentally established and the results scale favorably to reactor plasmas without density wave penetration issues, we attempt to address RF impurity sources and contamination through antenna geometry.
A classic ICRF antenna can be characterized by current straps that are perpendicular to the
toroidal magnetic field. In C-Mod, we have observed that the core molybdenum contamination and antenna molybdenum impurity sources are correlated with ICRF power from the classic antennas[46]. Furthermore the scrape off layer (SOL) transport, SOL density and potential profiles, and SOL temperature are modified during operation of the classic antennas[47]. For a field aligned (FA) ICRF antenna shown in Figure 12, the antenna current straps are perpendicular to the total magnetic field and the symmetry along the total magnetic field line is expected to reduce the RF plasma interaction[48].
To characterize the local antenna impurity source, the molybdenum I and titanium I lines are monitored using four views to cover the FA antenna and two to cover the classic antennas. Prior to boronization, we monitored the antenna impurity source response at the classic and FA antennas in L-mode discharges.
Figure 12: Field aligned and classic antennas mounted inside Alcator C-Mod. Note that the antenna straps are perpendicular to the total field whereas the classic antenna straps are perpendicular to the toroidal field but has Faraday rods that are aligned with the total field.
Figure 13: Comparison of the local antenna source at the FA and classic antennas when the antenna is powered. The reference is the local source for a similar discharge with the antenna off.
22 In Figure 13, we concentrate on molybdenum source response at each antenna. The RF power is increased in three steps: 1 MW (0.6-0.725 s) to 1.75 MW ((0.6-0.725-0.875 s) to 2.5 MW (0.875-1 s) and is shown in the bottom panel. In the top panel, the black trace is the molybdenum I signal when the antenna in the view is off for a similar discharge (same injected power, B-field, density, and plasma current). Signal response above this level is defined to be the RF enhanced source. The blue trace is the molybdenum I signal (386.4 nm) from a view at the classic antenna with the classic antenna powered. The response is familiar: the source approximately doubles with each power step and is present only when the antenna is powered. The red trace is the molybdenum I signal at the FA antenna when the FA is powered, and responds weakly. These measurements indicate that the RF enhanced impurity source at the FA antenna is nearly eliminated and is dramatically lower than the impurity source at the classic antenna.
This represents the first demonstration that an ICRF antenna can be made with reactor compatible plasma facing materials.
To characterize the impurity contamination, a series of L and H-mode discharges has been performed to compare the overall stored energy and radiated power. An example of these results is shown in Figure 14 for an EDA H-mode discharge. The global impurity contamination is lower for the H-mode heated by the FA antenna but it is not as dramatic as the reduction in the antenna impurity source. There appears to be a residual impurity contamination associated with the FA antenna as evidenced by the increasing radiated power throughout the H-mode phase. This suggests a source associated with far field sheaths [49, 50] or transport changes due to the RF.
The emerging physics explanation for the elimination of the RF impurity source
at the FA antenna is that the FA antenna is aligned to the RF driven convective cell[51-53] via
Figure 14: Comparison of the plasma stored energy and radiation response to the FA and classic antennas in an EDA H-mode. The stored energy is similar and the radiated power is lower for the FA antenna heated discharge.
Figure 15: Comparison of the plasma response to the FA antenna for discharge where the antenna is aligned and intentionally misaligned. The classic antenna serves as a reference to show that the increased impurity contamination from FA antenna required the FA antenna to be powered.
23
geometry. For the FA antenna, the antenna structure is normal to the total magnetic field and inherently aligned to the RF driven convective cell in the near field of the antenna. For a classic antenna, the antenna is misaligned to the convective cell and results in a strong interaction at the antenna when the antenna is powered. To test this hypothesis, we ran a series of discharges where the plasma was intentionally misaligned to the antenna by a 1 cm vertical displacement, thus the FA antenna would intersect the RF driven convective cell. For the misaligned discharge, we expect to find significant impurity contamination. In Figure 15 the blue trace is the plasma response to ~2 MW of ICRF power from the classic antenna and will serve as a reference. The green trace is the plasma response when the discharge is heated with the FA antenna with intentional misalignment. Despite the similar stored energy response, the core molybdenum contamination is dramatically higher at the onset of H-mode and increases near the end of the RF pulse as expected. The red trace is the plasma response of a following discharge showing the return of a low impurity contamination – core molybdenum has a slow response to the FA power in H-mode. These observations are consistent with the hypothesis that the elimination of the local antenna impurity source is a result of the antenna alignment to the convective cell.
24
4.2 Parametric Decay and the Density Limit for Lower Hybrid Current Drive
There is a universally observed roll-off in Lower Hybrid Current Drive (LHCD) efficiency at density higher than a critical value, which for typical C-Mod conditions is ~1x10²⁰ m-3 [54]. This loss of efficiency has prevented access to advanced tokamak regimes on C-Mod since higher density operation is critical to realizing high bootstrap current fraction in C-Mod. Successful LHCD operation at higher density is also crucial for developing a reliable steady state RF current drive actuator for future reactor-relevant tokamaks (e.g., for ITER, FNSF [55], and DEMO) in which neutral beams might have limited heating and current-drive capabilities [56].
Recent C-Mod experiments have explored the role that Parametric Decay Instabilities (PDI) in the edge plasma could be playing in this efficiency roll-off [57]. It has been found that PDI strength correlates with the level of SOL density and with the loss of efficiency. In plasmas where PDI are suppressed by reducing the SOL density, fast electron generation is enhanced, as will be discussed below. While a quantitative understanding of the role that PDI play is yet to be determined, the experimental results show that PDI are involved in the observed loss of
efficiency at high density. The PDI observed in Alcator C-Mod are linked to the conditions in the SOL of diverted plasmas.
The discovery of ion cyclotron PDI in Alcator C-Mod was reported in the last IAEA meeting and the downshift of the sideband frequencies was found to be characteristic of the magnetic field strength near the inner separatrix [58, 59]. The location of the PDI at onset has since been observed to be dependent on the point location [60]. Recent experiments with field- and X-point reversals have revealed that this equilibrium dependency can be generalized to the B× B direction dependency with respect to the X-point.
In experiments in which the TF direction was varied (while maintaining the same helicity), it was found that in H-mode favorable (unfavorable) equilibria with B× B pointing toward (away from) the active divertor, ion cyclotron PDI initiate in the inner (outer) SOL. This has been explained by asymmetries that occur in the SOL due to the effect of an flow near the separatrix. Since the direction of this SOL flow depends on the toroidal magnetic field direction, it can reduce the level of heat transport from the outer to the inner SOL [61]. As a result, in the H-mode favorable equilibrium, temperatures decrease in the inner SOL, and the density at the inner SOL increases to preserve pressure balance along the open field lines. These inner SOL conditions (i.e., low temperature and high density) are found to be particularly favorable to excite PDI, as indicated by growth rate analyses [62]. The observed ion cyclotron PDI onset near the inner separatrix is also evidence of weak single-pass absorption of the launched LH waves radiated from a grill located in a midplane port.
Conversely, in a single null equilibrium with the B× B drift direction away from the active X-point, probes do not show evidence of PDI initiated near the inner SOL, as the observed frequency spectra are dominated by ion cyclotron sideband LH waves that are characteristic of the magnetic field strength near the outer separatrix. While even in this magnetic configuration LH waves need multiple bounces at the inner and outer edge to be Landau damped, wave-edge interactions including PDI, collisional absorption, non-specular reflection and turbulent scattering in the inner SOL are all weakened due to the lower SOL density. Wave-edge interactions near the
25
inner-SOL will be eliminated by strong single pass absorption so that most of the applied power is dissipated before LH rays reach the inner separatrix. Thus, when launching LH waves from outside the separatrix, interactions with the inner SOL are considered to be less threatening in future reactor conditions because of the higher plasma temperature which will ensure strong single pass absorption.
C-Mod experiments also show that as densities increase well above ~1x10²⁰ m-3, even in conditions that favor PDI excitation initially at the inner wall, ion cyclotron harmonics
characteristic of the field strength at the outer wall are ultimately observed. Independent of the measurement location, the observed LH frequency spectra show that the energy content of cyclotron harmonics with frequencies characteristic of the inner wall field strength ultimately dominates the spectra, regardless of probe location. Neither current drive effects nor evidence of fast electron generation is observed above ne = 1.2x10²⁰ m-3 in these conditions. The observed PDI occurring in the outer SOL are potentially problematic since they convert at least some of the applied power to waves that are ineffective for driving current. Even a small ∥ up-shift in the launched waves can result in a significant loss of efficiency because efficiency is inversely proportional to ||.
Since the analysis of growth rates from the PDI dispersion relation suggests that reducing the SOL density could mitigate their growth, a recent experiment focused on controlling SOL density by varying plasma current in high density C-Mod plasmas. The density in the far SOL in C-Mod is found to decrease with decreasing Greenwald fraction in Ohmic L-Mode plasmas [63]. A linear density ramp from ne = 0.8x10²⁰ m-3 to ne = 1.4x10²⁰ m-3 at three different currents (Ip=0.55, 0.8, and 1.1 MA) showed that PDI onset occurs at higher line-averaged densities as the plasma current is increased. SOL profile measurements with a scanning probe at the outer midplane confirm the density dependence of PDI onset. As an example, Figure 16 shows that the PDI strength is a function of the local plasma density in front of the LH launcher. Here the PDI strength is defined as the integrated spectral power of the first harmonic of the ion cyclotron sideband LH waves. This figure suggests that the local density at which PDI occurs is
approximately independent of current, emphasizing the importance of the density in the SOL or possibly near the separatrix in determining the onset.
Figure 17 shows that for fixed core density, the fast electron population in the plasma, as
measured by hard X-ray emission, increases dramatically at fixed ne as Ip is increased. In plasmas where PDI is suppressed, fast electron production rates are observed to be enhanced by more than an order of magnitude, implying that PDI are causally involved in the universally observed roll off in LHCD efficiency at high density. Thus, promising results have been obtained in mitigating the effects of outer SOL PDI and extending the density range over which fast electrons are generated by taking advantage of the lower SOL densities which occur at higher current in C-Mod L-modes.
Eliminating the onset of PDI in the outer SOL will require control of the SOL density which may be difficult or impractical in reactor scale devices. A possible new approach to address this issue would be to locate the LH launcher [57, 64] at the inner wall in double null equilibria, where the turbulent fluxes crossing the separatrix are negligible and where it may be possible to create low
26
density plasma conditions that avoid PDI and other turbulent scattering mechanisms. In addition, the effect of higher field at the launcher can substantially open the penetration window, resulting in a deeper poloidal trajectory of the LH rays and a broader off-axis driven current profile [64]. This can be appreciated by examining the “ ∥-window” available for LH waves, which is set from below by accessibility and from above by the threshold for Landau damping:
1 2⁄ 2 2 ⁄ 2 ⁄ ∥ 40/
From this one can see that increasing the field lowers the left hand side of the inequality, thereby allowing lower values of ∥ that will damp at higher temperature, i.e., farther from the plasma edge.
While conceptual designs have been developed for a test antenna to be installed in Alcator C-Mod, installing an inside launch LH antenna presents a non-trivial engineering challenge. Retrofitting such a launcher to an existing machine could be difficult, but incorporating this launcher early in the tokamak design could enable a successful deployment. An inside launch LH antenna conceptual design is being developed for a proposed new machine called the Advanced Divertor Experiment (ADX) [65], a new device being developed by an MIT-led consortium to demonstrate an integrated approach to managing reactor-relevant heat and particle fluxes.
27
Figure 16: Growth of PDI fundamental, ω = ωci(LFS) as a function of density in the SOL
(r/a1.1) for discharges at 3 different plasma currents. The ratio of line-averaged density to density at the plasma edge is a strong function of current. For example at 1.4 10 , it increases by a factor of ~5 as the current increases from 0.55 to 1.1 MA.
28
Figure 17: Comparison of x-ray count rates in the range 40 – 200 keV as a function of line average ne for the three discharges in Figure 16.
29
5. Accelerator-based In-situ Materials Surveillance
The Accelerator-based In-situ Materials Surveillance (AIMS) system is a novel diagnostic that nondestructively measures the evolution of plasma facing component surfaces (PFC) inside Alcator C-Mod [66]. The diagnostic aims to remotely generate isotopic concentration maps on a plasma shot-to-shot timescale that cover a significant fraction (~1 m2) of the PFC surfaces inside Alcator C-Mod without the need for vacuum breaks or physical access to the PFCs. AIMS uses a compact (~1 meter), high-current (~1 milliamp) radio-frequency quadrupole accelerator to inject 0.9 MeV deuterons into the vacuum vessel. In between shots, the tokamak magnetic fields steer the deuteron beam to the PFC surface of interest where the deuterons cause high-Q nuclear reactions with low-Z isotopes ~10 microns into the material. The induced neutrons and gamma rays are measured with scintillation detectors; energy spectrum analysis provides quantitative reconstruction of surface compositions. An overview of the diagnostic technique is shown in Figure 18. First deployed on Alcator C-Mod in 2012, AIMS has demonstrated the capability to measure the evolution of thin-film boron coatings and retained deuterium fuel on PFC surfaces in between plasma shots. As an example, Figure 19 shows a time
series of AIMS measurements on an inner wall tile for two different plasma configurations: lower single null (LSN) diverted and inner wall limited (IWL). Measurements indicate that net boron deposition seen during LSN operation switches to net erosion during IWL operation, consistent with previous measurements[67]. In addition, the AIMS measurements indicate that the plasma does not deplete retained deuterium from the boron films over the course of a run day. This provides additional evidence that retention in boron films cannot sufficiently explain the net fuel retention observed on Alcator C-Mod, as there is insufficient atomic capacity for deuterium storage [68].
Figure 18: The AIMS diagnostic installed on the Alcator C-Mod tokamak showing (A) the RFQ accelerator, (B) three different beam trajectories, (C) the toroidal field magnets used for beam steering, (D) the PFC tiles, and (E) the reentrant particle detectors.
Figure 19: AIMS measurements of the fractional change in boron and deuterium on an inner wall tile relative the measurement 0. The boxes indicate the order of number and magnetic configuration - LSN is lower single null diverted; IWL is inner-wall limited - of plasma shots.
30 6. ITER-Specific Research
6.1Scrape-off Layer Heat Flux Profiles – Guidance for ITER Limiter Design
The shape of ITER’s inner-wall limiter panels was chosen to accommodate heat loads from limiter startup discharges under the assumption of a single exponential e-folding heat flux profile in the scrape-off layer (SOL), q~50 mm [69]. But recent experimental evidence from JET [70] and other tokamaks [71-73], primarily from thermal imagining measurements, indicates that a ‘narrow heat flux feature’, of order 1 to 5 mm, exists near limiter contact points. With the exception of recent swing-probe measurements on the high-field side SOL of DIII-D [73], scanning probes at other poloidal locations have not clearly detected such a feature in the density and/or electron temperature profiles, implying that the physics might instead involve focused
heating of the limiter surface by a ‘funneling effect’ [74 Stangeby1992].
Experiments were undertaken in C-Mod to investigate this phenomenon at ITER magnetic field strengths and to explore dependences on plasma current and magnetic field. C-Mod is ideally suited to do this, with its array of three scanning probes (see Figure 20), including an electromagnetically actuated wall-scanning probe (WASP) [75] on the high-field side and a Mirror Langmuir Probe (MLP) [76] on the low-field side. In particular, the MLP records time-averaged SOL profiles with very high spatial resolution. Inner-wall limited, ohmically heated discharges were investigated (21 total), with toroidal field of 4 to 6.5 tesla, plasma current 0.4 to 1.1 MA, vertical elongation ~1.2 and plasma densities chosen to place the SOL in a sheath-limited heat flux regime (Greenwald fraction: 0.22 < ne/nG < 0.35). An overlay of profiles from the three scanning probe systems for a representative discharge is shown in Figure 20 (6.4 tesla, 1.0 MA case). A narrow feature in the SOL is clearly seen on all probes; plasma density and electron temperature are also found to align among all probes, consistent with a sheath-limited parallel heat conduction regime. The equivalent parallel heat flux profile on the limiter surface is
Figure 20: Representative magnetic equilibrium and locations of probe diagnostics for an inner-wall limited discharge (left panel); overlay of electron pressure and parallel heat flux profiles (assuming sheath model) from the three scanning probe diagnostics (right panel).
VP MLP WASP 1 10 -5 0 5 10 15 20 Rho (mm) 1 10 100 MLP VP WASP Electron Pressure 10 20 eV m -3 MW m -2
Parallel Heat Flux, q// = 7 Te Jsat
31
shown in the bottom panel. These results indicate the ‘narrow heat flux feature’ reported on inner-wall limiters is a plasma profile effect, its root cause being associated with cross-field plasma transport.
High resolution, parallel heat flux profiles obtained from the MLP diagnostic were fitted by a double exponential function and tracked systematically as a function of field and current (Figure 21). All discharges exhibited a two-exponential shape with the ‘short’ e-folding length (q1) being a factor of ~10 smaller than the ‘long’ e-folding length (q2) and producing a peak heat flux at the last-closed flux surface typically a factor of ~4 higher than would be projected using just the long e-folding length. q1 as small as ~1 mm are seen in 1.0 MA discharges. This two-exponential structure is essentially identical to the ‘near’ and ‘far’ SOL features identified in diverted discharges in C-Mod [77] and associated with a transition from a zone of diffusive transport (near SOL) to that of an intermittent, ‘blobby’ convective transport (far SOL).
Remarkably, q1 are found to scale approximately inverse with plasma current and to exhibit no significant sensitivity to toroidal field or safety factor. These observations are very similar to the ~1/Ip heat flux channel width scalings reported from C-Mod EDA H-modes and ohmic heated L-modes [78] and from a multi-machine database for H-mode discharges [79]. An important implication of these results, which has escaped notice until now, is that similar physics controls the SOL profiles and the heat flux channel widths over a wide variety of conditions. In almost all cases, q1 is found to be within a factor of two of the heat flux channel width derived from Goldston’s heuristic drift model [80], which suggests that the poloidal ion Larmor radius is an appropriate scale parameter in these cases.
As a consequence of these experiments in C-Mod and others performed on COMPASS [71], TCV [72], DIII-D [73] and JET [70 Arnoux], ITER has recently implemented a reshaping of inner-wall tile panels to accommodate the narrow heat flux feature [69].
Figure 21: A two-exponential fit is performed to high resolution parallel heat profiles obtained from the MLP diagnostic (left panel); the short e-folding distance (q1) is found to
scale approximately as ~1/Ip with no dependence on magnetic field or edge safety factor.
Shot#1140228026:0.55 -5 0 5 10 15 20 Rho (mm) 1 10 100 MW m -2
Parallel Heat Flux, q//
q1 = 1.1 mm
q2 = 10 mm
q// = q1exp(-/q1) + q2exp(-/q2)
0.4 0.6 0.8 1.0 1.2
Plasma Current (MA) 0 1 2 3 4 q ( mm) q95=2.7; =1.17 q95=3.1; =1.31 q95=3.2; =1.24 q95=4.1; =1.16 ~