PFC/JA-95-11
Alcator C-Mod Papers Presented at the
9thJoint
Workshop on Electron Cyclotron Emission &
Electron Cyclotron Resonance Heating
(Borrego Springs, CA, Jan. 22 -
26, 1995)
A.E. Hubbard, T.C. Hsu, P.J. O'Shea
and the Alcator C-Mod Group
April 1995
This work was supported by the U. S. Department of Energy Contract No.
DE-AC02-78ET51013. Reproduction, translation, publication, use and disposal, in whole or in part by or for the United States government is permitted.
Contents
Michelson Interferometer for Te Profile Measurements on Alcator C-Mod
A.E. Hubbard, T.C. Hsu, P.J. O'Shea 1
Nine Channel Polychromator for Fast Te Measurements on Alcator C-Mod
MICHELSON INTERFEROMETER FOR Te PROFILE MEASUREMENTS ON ALCATOR C-MOD
A.E. Hubbard T.C. Hsu and P.J. O'Shea
MIT Plasma Fusion Center, 175 Albany St., Cambridge, MA 02139
ABSTRACT
A high resolution Michelson interferometer is the primary diagnostic of electron
tempera-ture profiles on the Alcator C-MOD tokamak. This instrument has a mechanical crankshaft which moves 3 cm every 15 ms. It has operated routinely and with high reliability since the start of C-Mod operation in 1993. Operation to date has been mainly at 5.3 T, so that the second harmonic extraordinary mode is in the 200-400 GHz range. At the planned field of
9 T, the central frequency will be 504 GHz. A quasioptical beamline transports radiation
from the tokamak, and is entirely under vacuum to eliminate water vapour absorption lines in this range. This transmission system[1] gives broad-band transmission and high spatial resolution. The emission is shared by a grating polychromator[2]. An important new devel-opment is a black-body source which is vacuum compatible, allowing independent, in-situ absolute calibration. The source consists of carbon-loaded epoxy tiles at liquid nitrogen and room temperatures. The design of and operational experience with the interferometer will be discussed. Measurements of temperature profile evolution, both in ohmic discharges and in plasmas with up to 3.5 MW of RF heating, which significantly increases and peaks T., will also be presented.
INTRODUCTION
Electron cyclotron emission diagnostics on the new Alcator C-Mod tokamak have been measuring electron temperature profiles since the start of the experimental program in 1993. This compact tokamak has a minor radius of 0.21 m and major radius 0.67 m, and is designed to operate at fields up to 9 T. To date, most operation has been at 5.3 T. The relatively high field means that ECE frequencies for the second harmonic are also higher than for most other tokamaks, with 2Fce(O) up to 500 GHz. This obviously impacts the choice and design of ECE diagnostics.
A Michelson interferometer was selected as the primary diagnostic of T, profiles due to its
wide spectral coverage, which allows us to check the thermal nature of emission spectra high reliability and stability, and relative ease of absolute calibration. A novel mechanical
design
has been developed which combines high resolution (3 cm scan) with vacuum compatibility and low vibration levels. The transmission system used consists of a series of large quasiop-tical mirrors, which give ood spatial resolution and high efficiency over a wide frequency range. The hardware use is described in the following section.Perhaps the most challenging part of any ECE measurement is its absolute calibration. This was complicated in our case by the fact that the instrument is designed to operate in vacuum. In order to replicate the conditions of plasma measurements as accurately as possible, a new source was developed which uses liquid nitrogen circulating through epoxy tiles. The design and testing of this source, as well as typical calibration results, are presented in section 3.
A wide operating range in current and density has already been explored on Alcator C-Mod
under ohmic conditions, allowing temperature scalings to be obtained. The most dramatic changes in T. have been observed with ICRF heating, which heats efficiently even at the relatively high densities typical of C-Mod. A selection of these results, which illustrate the capability of the diagnostic, is described in Section 4.
2. DESCRIPTION OF THE DIAGNOSTIC
3.1 Interferometer
The Michelson interferometer on Alcator C-Mod has a moving mirror with a stroke of
3 cm, giving 5 GHz spectral resolution. It has been operated to date with a 30 ms scan
time, and and is mechanically designed to be cabable of up to 4000 rpm. The instrument is operated in vacuum, which means that air bearings typically found in such instruments
could not be used. Instead, the optical carriage slides on parallel shafts using linear ball
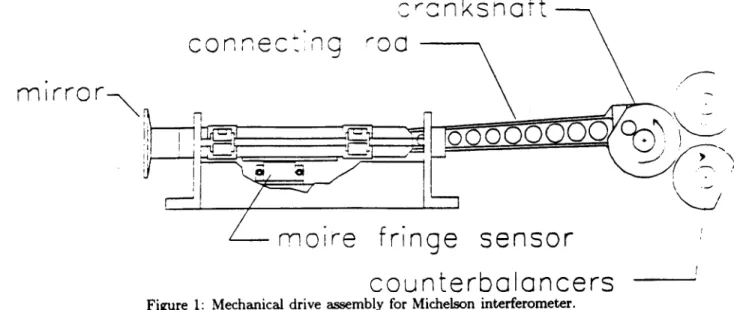
bearings. This is driven by a rotary DC motor connected to a crankshaft and connecting
rod assembly, shown in Fig. 1. Further details of the instrument design may be found in [31
connec:.ng
~ocmirror
000
000
rnoire
fringe sensor
counterboloncers
Figure 1: Mechanical drive assembly for Michelson interferometer.
A problem with previous large-scan instruments is that the high inertial forces lead to
large vibration levels, which can couple to the detector as well as cause excessive wear
and tear (and noise levels in the vicinity of the instrument). To overcome this, the
C-Mod interferometer uses two counterbalancers which rotate in the opposite direction to the crankshaft, cancelling the horizontal and vertical forces of the optical carriage assembly at
the fundamental frequency. Various drive mechanisms, incuding fixed gears and a rubber
belt, have been tested. The final design uses a triple chain drive. Calculations show that
the use of the counterbalancer reduces reaction force by a factor of 18.7, with the second harmonic now being the dominant fourier component. In operation, we find the instrument to be very quiet, with vibrations which can barely be felt by hand.
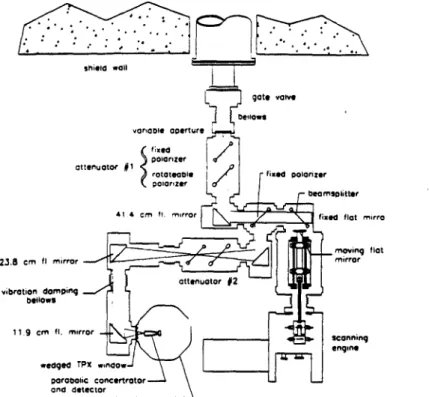
The michelson optics use reflecting mirrors which form two gaussian telescopes, with 6.3
cm diameter optics (Fig. 2). The beam is parallel through the Michelson mirrors, and is focussed onto the detector with a factor of two reduction from the input aperture. To
further reduce vibrations coupling to the detector, the Michelson, mirrors and detector are mounted on three separate concrete tables joined only by flexible bellows. Accelerometer
measurements confirm that vibratory accelerations are nearly an order of magnitude lower at the detector than at the Michelson, with higher frequency components most strongly attenuated.
A beam splitter composed of fixed and rotating wire grids is located just after the input
aperture of the michelson. This serves both to attenuate the plasma emission, which would otherwise saturate the electronics during high temperature discharges, and to direct part
Shield -Olt l
2:
voy variatle aerturago poarZe
'oto teote fie polarizer beamnstter 41 4 cm fl. m,,ror filled flat -rro
moving flat 238cm if mirror mirror vibration dampingq wedged TPX w.eoow paraolifc concertrator 1 and detector detector cryostat
Figure 2: Layout of Michelson optics.
of the sigal to a nine channel grating polychromator. The attenuation vs angle has been measured using mercury lamp spectra and has been found to be flat with frequency out to at least 500 GHz (where signal to noise declines) and in good agreement with calculations. The aperture is variable up to 5 cm, allowin us to optimize for spatial resolution and signal level. For experiments to date, where resolution has not been a prime consideration, we have typically operated with a 2-3 cm aperture for ease of calibration and to increase signal to the p ychromator. The interferometer has operated with high reliability since near the start of -Mod experiments in 1993. Only two mechanical failures have been experienced to date, both of which have been quickly corrected.
3.2 Beanline
The ECE instruments are located outside the C-Mod cell in a shielded laboratory. A quasioptical beamline consisting of two parabolic mirrors 20 cm in diameter, with 2.7 m focal length, as well as 3 flat mirrors, forms a gaussian telescope which images a spot near the midplane of the tokamak to the entrance aperture of the Michelson. The design and performance of this system were reported in detail at the EC-8 workshop[1}. Calculations and measurements at a frequency of 87 GHz showed that the beam pattern was more complex than predicted by gaussian optics, and required a full wave code to accurately predict the spatial response.
More recently, broad-band measurements have been made using a mercury lamxp source moved across the focal plane of the beamline, with the Michelson interferometer detecting the signals. It was found that for frequencies 300 GHz and above, where most of the ECE measurements on C-Mod are made, the measured spot size is in fact quite well described by the geometric optics approximation.
3. CALIBRATION
Calibration of the Michelson interferometer is carried out by rotating the parabolic mirror closest to the tokamak to view vertically towards a calibration source rather than horizontally towards the plasma. The optical path of the beamline and instrument is thus equivalent to that in plasma measurements and includes the window which separates the torus vacuum and rough vacuum sections ol the beamline. Space constraints dictate that the source be placed closer to the mirror than the mirror focus (0.95 vs 2.7 in). Its diameter of 18 cm more
than fills the beam pattern at this position.
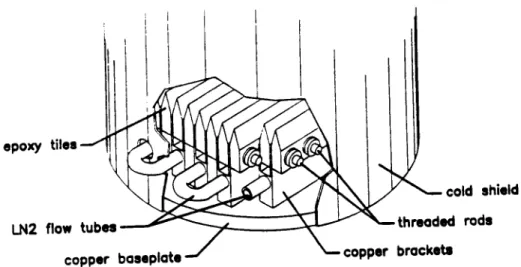
The fact that the calibration source is placed in the high vacuum part of the system places severe constraints on its design. The use of an open container of liquid nitrogen, as is typically done on many experiments [4], is obviously ruled out. Sources with a heating element would probably also have high outgassing. A novel design has been developed in which a liquid at constant temperature is circulated through serpentine passages in a cop er plate. Figure
3 shows a drawing of the new source. Vacuum feedthroughs separate the liquid from the
vacuum. Tiles of carbon-loaded epoxy, with a knife-edge cross-section, form the black body. They are connected thermally to the copper base via thin copper fins, which also provide the needed flexibility for thermal expansion. The present source uses liquid nitrogen giving a cold reference temperature. In principle, the same design could also be used with a hot liquid to gve a greater temperature difference. In this case a different tile material such as
pyrex or silicon carbide would be more appropriate.
epoxy tiles
cold shield
LN2 flow tubes threaded rods
copper boaseplate copper brackets
Figure 3: Drawing of vacuum compatible calibration source.
A number of measurements and calculations were made to optimize the design of the source
tiles. The main criteria are high effective emissivity, which requires low refractive index and a small enough wedge angle to give multiple bounces, and temperature uniformity across the surface, whic requires high thermal conductivity and is better at high wedge angle. Broad-band reflection measurements of epoxy samples, made using the Michelson interferometer, show that Stycast 2850FT epoxy loaded with 5% carbon has a refractive index of 2.94 ± 0.1.
A wedge angle of 50 degrees was selected, which gives emissivity better than 99.9% in the
polarization parallel to the plane of incidence of the tiles. The source is oriented so that this corresponds to the extraordinary mode in our case. In the perpendicular case, the emissivity
is 95.5%. Subsequent analysis showed that by decreasing the angle to 40 degrees, E could have been increased to > 99% in both polarizations.
From a thermal standpoint operation in vacuum is an advantage, since radiation becomes the dominant heat transfer mechanism between the calibration source and the surrounding surfaces. This has been minimized by placing a copper heat shield, thermally connected to the baseplate, around the source. The sold angle for radiation is then reduced to 1.3 steradians. A finite element model including the tiles and fins shows that, for epoxy at 77 K, there is a maximum temperature difference AT of 2.7 K between the base andtip of the tiles. This contributes a systematic error of 1.2% to the calibration. The optimum tile material from a thermal perspective would be SiC, which gives AT < 0.1 K for all wedge angles, even at temperatures up to 373 K. However, its fabrication would be more difficult and expensive. Materials such as plexiglass and TPX would not be acceptable due to low thermal conductivity.
The system calibration is carried out by coherently averaging many interferograms, us-ing exactly the same electronics and data acquisition as is used for plasma measurements. Interferograms are averaged in sets of typically 10,000 to 20,000. Data sets are taken al-ternately looking at the cold source and a warm source which is constructed with identical tiles but without the cooling passages. This slides in and out just above the cold source also under vacuum. Thermocouples embedded in several tiles measure the temperature ol both sources, giving a well determined temperature difference. Interferograms are fourier transformed, and all spectra from the cold and warm sources averaged. The difference be-tween 'cold' and 'warm' spectra gives the response of the Michelson and beamline. Some smoothing is applied to reduce the noise while retaining the real frequency structure in the response. Relative errors of typically 5-10% are the dominant source of uncertainty in the measured T, profiles. We hope to further reduce this by averaging over more interferograms and improving the noise in the electronics.
4. PLASMA MEASUREMENTS
The bulk of C-Mod operation to date has been with ohmic heating over a wide range
of parameters, with plasma current I, < 1.OMA and line average density 5 x10¹⁹m-3 < n. <
5x10²⁰m-3. Temperature profiles have been measured routinely for almost all of the
dis-charges. We do occasionay have problems due to non-thermal emission at the lowest den-sities and density cutoff immediately after large pellets. At low currents the shapes are very well fit by a gaussian, while at lower q the profiles tend to flatten within the sawtooth inversion radius. Apparent structure in the flat part of the profiles is within the relative calibration uncertainties. At all currents and densities, the gaussian width of the profiles is well described by an analytic expression assuming classical resistivity, a = 0.55[q,RI,,/BT1/2 [5].
In scalings over a large number of discharges, the peak and integrated electron temperature is found to increase significantly with current and decrease with density to the power 0.75. This is a major factor in the finding that C-Mod energy confinement is better fit by
ITER-89P scaling than by neo-Alcator scaling, a surprising departure from Alcator C results [6].
During ohmic H-Modes, the density typically rises strongly, while the usual decrease of temperature with n, is not seen. The temperature usually remains constant or rises slightly, giving a net increase in stored kinetic energy of up to 60%.
The most significant changes in electron temperature profiles occur during ICRF heating. C-Mod currently has two RF antennas, each capable of launching up to 2 MW of power at
80 MHz. The maximum coupled power power to date is 3.5 MW. Te(O) has often more than
doubled, to a maximum value of 4.5 keV. An increase in sawtooth period and amplitude is observed, presumably due to some stabilization mechanism. In these cases the profile
becomes strongly peaked, but also increases throughout the plasma radius (Fig. 4). With such strong sawtooth effects the Michelson is limited by the fact that its time resolution is comparable to the sawtoot'h period. While the spectrum is a convolution of the emission throughout the interferometer scan period, we find experimentally that the profiles are most representative of the temperature at the zero path difference of the interferogram. Profiles thus vary depending on the random phasing with respect to sawteeth. In addition, the large crashes in emission can introduce spurious structure in the spectra. Thus, while the Michelson is generally used to calculate energy content and confinement, the grating poly-chromator is better suited to following the dynamics of RF heating, sawtooth behaviour and other transient phenomena. We find the two instruments together provide a good diagnostic capability for T measurements on Alcator C-Mod.
2500
L
2000 -. + 500->4 Q)~ X Oj 100 0.50 0.60 0.70 0.80 0.90 Rcd(m)Figure 4: Temperature profiles for plasma with 1.6 MW RF. Points labelled with + show the profile with
RF, at the peak of a sawtooth oscillation. The dotted line is a gaussian fit to this profile. The dashed curve shows the profile after the same sawtooth, while the lower profile (dot-dash) is taken in the ohmic period.
References
[1] A. Hubbard et al, Proc. EC-8 Workshop, Gut Ising, Germany,Oct. 1992.
(2] P.J. O'Shea and A.E. Hubbard, this workshop.
[3] T. C. Hsu, "The Submillimeter Wave Electron Cyclotron Emission Diagnostic for the
Alcator C-Mod Tokamak", D. Phil. Thesis, Massachusetts Inst. of Technology, Dept. of Nuclear Eng., 1993.
[4] F. Stauffer, D. Boyd et al, Rev. Sci. Instrum. 59(10) p. 2129, 1988.
[5] J. E. Rice, K. Molvig and H. I. Helava, Phys. Rev. A 25(3), p. 1645, 1982. [6] I. H. Hutchinson et al, Plasma Phys. Controlled Fusion 36 ,B143-B152, 1994.
Nine Channel Polychromator for Fast Te Measurements on Alcator C-Mod
P.J. O'Shea, A.E. Hubbard, and the Alcator C-Mod Group.
MIT Plasma Fusion Center, 175 Albany St., Cambridge, MA 02139
Abstract
A nine channel polychromator has been installed at Alcator C-Mod and run
suc-cessfully for the 1994 spring campaign. The polychromator now complements the
previously installed high resolution Michelson interferometer 1. The polychromator
instrument was originally designed at the University of Maryland for use on the MTX tokamak and is now the primary source for fast temperature measurements on the MIT device. The two ECE temperature diagnostics share the upstream quasioptical beamline from the tokamak. The Michelson is absolutely calibrated independently, and the polychromator is then cross-calibrated against the Michelson plasma data. Using
emission from the second harmonic extraordinary mode from discharges with B, = 5.3
Tesla
(
2w, = 230 - 400GHz ), the polychromator system produces temperaturemea-surements at nine positions along the major radius with time, radial and temperature resolutions of up to 2 psec, -1.5 cm, and ~ 9 eV respectively. Future operation at 9 Tesla will improve both the radial and temperature resolutions.
Polychromator data from Alcator C-mod plasmas will be presented from the 1994 runs. Particular emphasis will be placed on measurements pertinent to ICRF heating deposition profiles and also some early analysis of transient heat transport phenomena.
'A.E. Hubbard et al, This workshop.
1. Introduction
Alcator C-mod is a compact tokamak with a minor radius of 0.21 m and a major radius of 0.67 m. Present operation is with a toroidal field of 5.3 Tesla, electron temperatures in
the range of 0.8 - 4.5 keV, and line average densities in the range 0.5 - 5 x 10 20m-3. A
cross-section view of the tokamak is shown in figure 1.
The addition of the grating polychromator to the complement of diagnostics available at Alcator C-Mod now allows a more precise investigation of many plasma phenomena. Time resolution of the electron temperature measurements has been improved by more than three orders of magnitude over that of the Michelson alone. Measurements are made at nine locations along the major radius which may be scanned from shot to shot. Details of the instrument layout and specifications will be given in the next section. Good time
ALCATOR C-MOD
HIGH FIELD
DIVERTED AN
VAC VESSEL
IS
A
, HIGH DENSITY,
D SHAPED TOKAMAK
SUPERSTRUCTURE
TF
OH
COIL-MO
T
ILE
V7177 III III III III .11.---Iii ny T1T *---1 -. 1 --- - - --- 14 EF2 EFO EF3 7 -F1 U ' 'N'
SLIDING JO
INT
ICRF
ANTENNA
1 METER
V
'-UFIGURE
.. EF4 -- H--,I I'ER
P 0 EA, iresolution has been available with soft X-ray and visible bremsstrahlung array diagnostics, but these instruments are sensitive to a convolution of temperature, density, and impurity concentration. The polychromator has the valuable advantage of being sensitive to changes
in Te only.
Routine operation of the instrument to date has allowed the interesting dynamics of saw-teeth, RF heating, and pellet injection to be observed. Examples of the data, and the results of some preliminary analysis are given in section 3. Some studies, such as cold-pulse prop-agation experiments, may require improvements of the signal to noise over that currently achieved. A discussion of areas where refinements may be made is given in section 4.
2. Description Of The Diagnostic
The polychromator was designed for use at MTX, another compact, high magnetic field
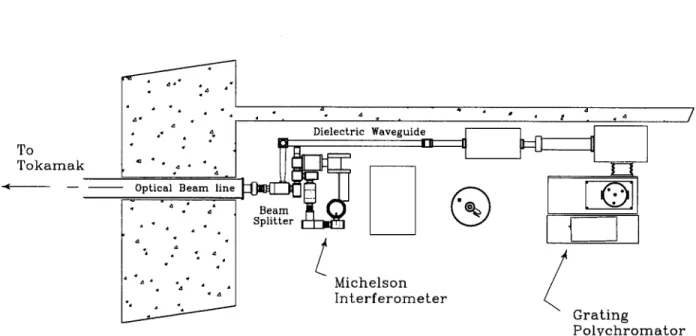
tokamak, and is thus well suited for use at Alcator C-Mod. Briefly, it consists of reflective optics which diffract the light from the entrance slit and image different frequency com-ponents onto 9 separate detectors. The polychromator and Michelson interferometer are located a shielded diagnostic lab adjacent to the C-mod experimental cell. An evacuated, quasi optical beam line carries cyclotron emission from the tokamak to the lab where it is divided between the two instruments. A pair of crossed wire-grid polarizers serve both as a mode selector and as a variable beam splitter. A circular dielectric waveguide carries the light from the beam splitter to the input optics of the polychromator. A plan view of this set up is shown in Figure 2. Typically, the extraordinary mode radiation from the plasma is viewed, and ~ 55% of the transmitted power is sent to the polychromator. The detectors have a minimum response time of ~ 2y sec. With the current input aperture size of 3.0 cm dia., the radial resolution in the plasma is approximately equal to the channel spacing which is also ~ 3cm. The polychromator has been operating very reliably since it was brought on line for the start of the 1994 experimental campaign. Though still running routinely and producing valuable results, optimization efforts are being made to maximize the diagnostic potential of the polychromator. ( See section 4).
3. Plasma Measurements
The polychromator reveals the temperature behavior for a wide spectrum of dynamic plasma phenomena. The most ubiquitous among these are sawteeth. Fundamental plasma MHD instabilities create these periodic events where energy from the plasma core is quickly redistributed over a significant volume of the plasma. A time history of a single sawtooth crash is shown in figure 3. Even during the flat-top phase of an ohmically heated plasma, considerable dynamics are seen in the sawtooth fluctuations. Sawteeth provide an interesting subject of study in their own right[1], but also serve other useful diagnostic purposes.
One very practical application of sawtooth observations has been for vertical alignment of the beamline optics. The first mirror is positioned 2.7m from the plasma center and its
Dielectric Waveguide
To
-Tokamak
- Optical Beam line
_ -Beam Splitter Michelson Interferometer 2 4 -I Grating Polychromator
Figure 2: Alcator ECE Diagnostics layout
shot #94 602019 etooth 12.0 01.0 Sff,~ -6.
view can be rotated to look downward into an in situ evacuated cold calibration source. An error in alignment of the beamline assembly of one degree gives a vertical position error in the plasma of - 5cm. To reduce this uncertainty, a vertical scan of the first mirror is made
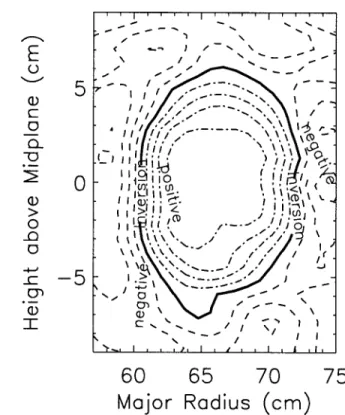
between a series of reproducible discharges until the true center position is located. Alcator C-Mod temperature profiles tend to have relatively broad peaks and thus the magnitude of the temperature is insensitive to such a scan. The qualitative behavior of the sawtooth fluctuations, however, is extremely sensitive near the inversion surface. Locating the upper and lower extent of this surface may be done accurately with only a few shots. The center is then estimated to lie halfway between. An example is shown in figure 4 where a 2-D contour plot of the relative sawtooth phase has been generated from a scan of 16 different mirror positions. C: 0 -o0
5
0OF
60
65
70
Major Radius (cm)
75
Figure 4: Contour plot of sawteeth from vertical GPC scan
The redistribution of energy during a sawtooth crash provides a periodic source of heat from the plasma core which must diffuse outward towards larger major radii. Tracking the propagation of these heat-pulses through regions not directly involved in the magnetic processes which cause the crash provides an opportunity to measure the electron thermal transport properties [2]. The spatial rate of change of the heat pulse phase can be used to obtain an estimate for the electron thermal diffusivity[3].
N N N ~ -I f~N \ .. -/ / - -- - -I- / IIl ~ \\~\ (Ifj N
*
(U
, ~ ( ~ I. \ \' \'\\ -~ .~ /7 / I / - I --*'~- 0~ -- -~ / - ~ I / I I -I I t I I.-5L
hP = 3nw,.. (_-2
Xe 4 dr
where : nwos is the nth harmonic of the Sawtooth frequency.
and: T is the the Sawtooth phase.
Preliminary analysis has demonstrated the potential of the technique. Optimization of the polychromator performance will reduce the uncertainty in the values obtained in the future. Other sources of temperature perturbations that have been observed with the grating poly-chromator include pellet injection (both fuel pellets and impurity pellets) and Ion Cyclotron Radio Frequency (ICRF) heating. In addition to the transients of the massive cooling asso-ciated with pellet injection, evidence of more subtle behavior such as snake oscillations have been observed during the recovery phase after injection. Most of the analysis that has been carried out on polychromator data thus far concerns the ICRF heating results.
The majority of the heating power on Alcator C-Mod is provided by two double-strap ICRF antennas (figure 1). Together, the antennas can deliver up to 4 MW of power at 80 MHz. Fast magnetosonic waves are launched which damp on central minority ions. Current operation heats a D(H) at 5.3 Tesla central magnetic field. The next phase will heat D(3He)
plasmas at 9 Tesla. A high energy tail is driven in the minority ion population. Heating is achieved as these ions damp through coulomb collisions with bulk ions and electrons. The response of the electrons to the heating is thus mediated by the minority ion tail. The fraction of the minority power lost by slowing down on electrons increases as the minority tail energy increases. Several techniques will be used to analyse the polychromator data in order to shed as much light as possible on the dynamics of the ICRF heating. These will include heat pulse propagation studies as described earlier to obtain transport coefficients, and measurements of central electron heating power density described in the next paragraphs. The heat pulses caused by sawteeth can be used during both Rf and Ohmic phases of the discharge. A similar experiment may also be accomplished by modulating the transmitter power. Such experiments have been used with ECRH heating and Fast Wave heating where there is a significant amount of direct electron heating[4][5]. Direct electron heating by the fast magnetosonic wave on Alcator C-Mod is expected to be at most 2 % and usually much smaller[6]. The expression for the local power balance for the electrons may be written as:
3 (n.T.) = PeRF + PeOH - Prad - Pie
- PVT,,
Where: p, is the x-channel power density.
Immediately after a sawtooth crash, the central profiles are flat, so the
trans-port terms (- VT,) are small. Interferometer and Z-meter measurements of
radia-tion and losses to bulk ions are also small in the core, thus we get the approx-imate expression, valid for the central plasma reheat following a sawtooth crash:
3nAeo (Teo) -PeRF +PeOH
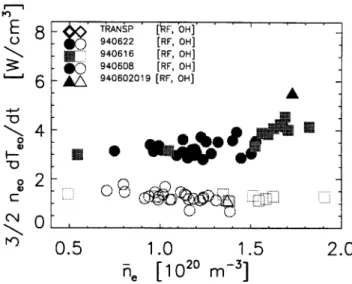
Calculating the instantaneous reheat rate for electrons after a sawtooth crash will thus indicate the central value of the total electron heating power density. Comparing results during ICRF with ohmic results gives important information related to the peakedness of the ICRF deposition profile. An illustration showing how the reheat measurements are made, and the effect of the ICRF power are shown in figure 5. Shown in figure 6 are results of
lCRF Power (MW) 940602019
O.S 0.5 0.6 0.62 0.64
Time (secondal
Figure 5: Illustration of central reheat rate calculation showing influence of ICRF on sawteeth this reheat rate analysis for ICRF experiments from the fall of 1994. Central reheat rate is shown as a function of plasma density. Also shown is the total energy available to heat electrons at the plasma center as computed with TRANSP. A rough sawtooth mixing model has been applied which flattens the power deposition profile for the minority ions out to the sawtooth mixing radius. The observation that there is as yet no sign of heating degradation
Central Electron remp (KeV) 940602 .019
- - -- - - -- -0 6 0-58 ... .. ... ... ...
...
...
QA2 0_11AE 8
TRANSP [ F, OH] 940622 [RF, OH] E _ 940616 [RF, OH] 940608 [RF, OH] 6 A 940602019 [RF, OH] 4-o2 0 0.5 1.0 1.5 2.0 he [1020 m-]Figure 6: Central reheat rates versus density. TRANSP points shown for comparison with increasing density is encouraging for future experiments. Coupling efficiency remains high up to average plasma densities of 2.0 x 10²⁰m-3. The increase in electron reheat rate
with increasing density most likely reflects the greater focussing effects predicted for the fast magnetosonic wave at high density.
4. Refinements and Future Plans
The results from the grating polychromator thus far have been very encouraging and some useful results have been produced. To extend the use of the instrument further, however, the signal to noise will have to be increased in the outer channels.
Transient transport coefficients can also be obtained by following the inward diffusion of the resulting cold-pulse[7]. Interesting anomalous temperature behavior has been seen on
some tokamaks following impurity injection into the plasma edge[8].
Attempts to see this cooling front resulting from edge localized radiant cooling have been unsuccessful.Greater sensitivity in the edge will also extend the range out to which the
sawtooth crash heat pulses can be tracked.
A number of areas exist where improvements may be made. Balkcum et al[9] have shown
that coupling efficiency to the dielectric waveguide can drop by a factor of 4 or greater when the input beam is misaligned by as little as 1 degree. An upgrade to the mechanical design of the polarizer/beam splitter is complete and will be installed shortly. This will allow remote
alignment and attenuation adjustments to be made without breaking vacuum.
The grating set designed for use at MTX was for a central magnetic field of 4.4 Tesla, and an aspect ratio of 4. A new set of gratings will be built in-house with period and blazing
A Rectangular input aperture with dimensions 50mm (toroidal direction) by 30mm
(poloidal direction) has been installed to maximize throughput to the instruments. The radial resolution of the beamline at this setting is not ideal. In the plasma center, the resolution is dominated by the spot size, with the central signal being an average over all flux surfaces out to a radius of - 2cm. The radial resolution improves to better than 1 cm
outside the central core[12]. As the temperature profiles are slowly varying in the core, this is deemed acceptable. Currently, only 55 % of the the total power is sent to the GPC.
The noise level will also be reduced in the near future. Currently two Jorway Aurora-14 transient digitizer modules are used for data aquisition. The entire discharge is covered with a 20 kHz slow digitization rate.Triggerable fast digitizing bursts at up to 500 kHz are timed to capture transient events. A series of low pass filters which can be removed during bursts are also built and await installation. If noise continues to be a problem, an upgrade from the original OP-37EP preamplifiers can be made fairly easily.
5. Conclusion
In summary, it has been shown that the grating polychromator diagnostic has been suc-cessfully installed and is now routinely producing electron temperature measurements on Alcator C-Mod. It is a useful complement to the diagnostic set already in place and will be used for many investigations of electron thermal transport in the coming campaigns.
References
[1] C. C. Gomez, Doctoral thesis manuscript, MIT, Cambridge, MA, 1986.
[2] M. Soler, J. D. Callen, Nucl. Fus., 19, 703, (1979).
[3] E.D. Fredrickson, J.D. Callen, K. McGuie et al, Nucl. Fus., 26, 849, (1986).
[4] M. Murakami et al (TFTR), Paper for the 10th Topical Conference on Radio Frequency Power in Plasma, Boston, MA, 1993.
[5] J. O'Rourke et al (Jet Joint Undertaking), Nucl.Fus., 32, 1861 (1992) [6] P. Bonoli, MIT Plasma Fusion Center, private communication.
[7] M. Kissick et al, poster for the 34th annual meeting of the American Physical
Society-Department of Plasma Physics, Seattle, WA, 1992.
[8] K. W. Gentle et al, paper for the IAEA Proceedings, Seville, Spain, 1994. [9] A. Balkum et al, Int. J. of Infrared and Millimeter Waves, 13, 1321, (1992).
[11] I. J. Wilson, L. C. Botten, R. C. McPhedran, J. Optics, 8, 217, (1977).