PSFC/JA-05-8
Density fluctuations on mm and Mpc scales
Basse, N.P.
May 2005
Plasma Science and Fusion Center Massachusetts Institute of Technology
Cambridge, MA 02139 USA
This work was supported by the U.S. Department of Energy, Grant No.
DE-FC02-99ER54512. Reproduction, translation, publication, use and disposal, in whole or in part, by or for the United States government is permitted.
Density fluctuations on mm and Mpc scales
N. P. Basse
∗
Plasma Science and Fusion Center, Massachusetts Institute of Technology, Cambridge, MA 02139, USA
Abstract
We will in this paper report on suggestive similarities between density fluctuation power versus wavenumber on small (mm) and large (Mpc) scales.
The small scale measurements were made in fusion plasmas and compared to predictions from classical fluid turbulence theory. The data is consistent with the dissipative range of 2D turbulence. Alternatively, the results can be fitted to a functional form that can not be explained by turbulence theory.
The large scale measurements were part of the Sloan Digital Sky Survey galaxy redshift examination. We found that the equations describing fusion plasmas also hold for the galaxy data.
The comparable dependency of density fluctuation power on wavenumber in fu-sion plasmas and galaxies might indicate a common origin of these fluctuations.
Key words: Density fluctuations, Wavenumber spectra, Fusion plasmas, Galaxies, Turbulence
PACS: 52.25.Fi, 52.35.Ra, 98.80.Bp, 98.80.Es
1 Introduction
If one were to make a survey of where we are, what we know and what we do not know about magnetically confined fusion plasmas, turbulence would certainly be an area marked ’Here Be Monsters’. Cross-field transport (per-pendicular to the main magnetic field) assuming that only binary particle collisions contribute is called neoclassical transport [1]. This transport level includes effects associated with toroidal geometry. However, in general the
∗ Corresponding author. Tel.: +1 617 253 5523; fax: +1 617 253 0627. Email address: [email protected] (N. P. Basse ).
URL: http://www.psfc.mit.edu/people/basse/ (N. P. Basse ).
measured transport is several orders of magnitude larger than the neoclassical one, especially for electrons. This phenomenon has been dubbed anomalous transport and is subject to intense studies on most experimental fusion devices [2]. Anomalous transport is believed to be driven by turbulence in the plasma. It is generally thought that turbulence creates fluctuations visible in most plasma parameters. Therefore a concerted effort has been devoted to the study of fluctuations and their relation to the global (and local) plasma confinement quality.
In this paper we study electron density fluctuation power versus wavenumber (also known as the wavenumber spectrum) in the Wendelstein 7-AS (W7-AS) stellarator [3]. Wavenumber spectra characterize the nonlinear interaction between turbulent modes. The fluctuations were measured using the localized turbulence scattering (LOTUS) diagnostic [4,5].
As we shall see, the density fluctuation power P decreases exponentially with increasing wavenumber k on mm scales in fusion plasmas
P (k) ∝ 1 k ×e
−nk
, (1)
where n > 0 is a constant having a dimension of length and k = 2π/λ, where λ is the corresponding wavelength. This was initially noted using the simplified form
P (k) ∝ e−nk
(2)
in Ref. [6]. Eq. (2) also holds for density fluctuations in the Tore Supra tokamak [7].
Having the exponential structure of the wavenumber spectrum in mind, we were intrigued to see a figure in KVANT [8], a magazine published by the Danish Physical Society, showing the root-mean-square density fluctuation amplitude of galaxies from the Sloan Digital Sky Survey (SDSS) [9] versus distance that seemed to display the same exponential behavior as we found in fusion plasmas. This remarkable similarity prompted us to apply the same analysis to the SDSS data as we had previously used for our fusion plasma measurements.
The paper is organized as follows: In Section 2 we summarize our wavenumber spectrum measurements in fusion plasmas. Thereafter we describe inflation and the SDSS wavenumber spectrum in Section 3. We discuss the results in Section 4 and finally state our conclusions in Section 5.
2 Fusion plasmas
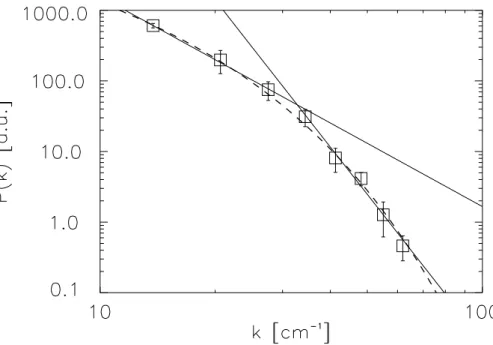
A wavenumber spectrum of turbulence in W7-AS is shown in Fig. 1. The measured points are shown along with two power-law fits
P (k) ∝ k−m
, (3)
where m is a dimensionless constant. The power-law fits are shown as solid lines and an exponential fit to Eq. (1) is shown as a dashed line. The power-law fits are motivated by classical fluid turbulence theory where one expects wavenumber spectra to exhibit power-law behavior with exponents m depend-ing on the dimension of the observed turbulence:
• 3D: Energy is injected at a large scale and redistributed (cascaded) by non-linear interactions down to a small dissipative scale. In this case, the energy spectrum in the inertial range E(k) ∝ k−5/3
[10].
• 2D: Here, two power-laws exist on either side of the energy injection scale. For smaller wavenumbers, the inverse energy cascade obeys E(k) ∝ k−5/3
and for larger wavenumbers, the enstrophy cascade follows E(k) ∝ k−3
[11]. • 1D: Energy is injected at a large scale and dissipated at a small scale;
E(k) ∝ k−2
[12].
Our measured power is equivalent to the d-dimensional energy spectrum Fd(k)
[13,10,14]
P (k) = Fd(k) =
E(k) Ad
A1 = 2 A2 = 2πk A3 = 4πk2, (4)
where Ad is the surface area of a sphere having radius k and dimension d.
Usually on would assume that d = 2 in fusion plasmas, since transport along magnetic field lines is nearly instantaneous. The fits to Eq. (3) in Fig. 1 yield exponents m = 3 (small wavenumbers) and 7 (large wavenumbers). A similar behavior has previously been reported in Ref. [15] where it was speculated that the wavenumber value at the transition between the two power-laws should correspond to a characteristic spatial scale in the plasma. The only length scale close to the transitional value was found to be the ion Larmor radius ρi.
The spectrum at small wavenumbers is roughly consistent with the inverse en-ergy cascade in 2D turbulence, F2(k) ∝ k
−8/3
. The exponent at large
Fig. 1. Wavenumber spectrum of broadband turbulence in W7-AS measured using the LOTUS diagnostic. Squares are measured points. Solid lines are power-law fits to the three smallest and five largest wavenumbers, the dashed line is a fit to Eq. (1). The power-law fit grouping of points is the only one where convergence is obtained.
bers does not fit into this framework. However, for very large wavenumbers one enters the dissipation range; here, it has been argued that the energy spectrum could have one of the following dependencies
ENeumann(k) ∝ e −ak
EHeisenberg(k) ∝ k −7
, (5)
where a > 0 is a constant having a dimension of length (see Ref. [12] and references therein). The energy spectrum proposed by J. von Neumann was what initially inspired us to investigate an exponential decay of P (k) in Ref. [6]. Fitting all wavenumbers to Eq. (1), ENeumann(k)/A2, we find that n = 0.1
cm or a wavenumber of 55 cm−1
. Alternatively, the transitional wavenumber found at the separation between the two power-laws is 31 cm−1
(0.20 cm). The expression EHeisenberg(k)/A2 yields m = 8, which is close to the experimental
value m = 7 for large wavenumbers. Calculating the ion Larmor radius at the electron temperature ρs for this case we find that it is 0.1 cm, i.e. the same
order of magnitude as the spatial scales found above. We used ρs instead of ρi
because ion temperature measurements were unavailable.
Currently we can think of three possible explanations for the behavior of the wavenumber spectrum:
(1) We observe 2D turbulence and the transition between the two power-laws occurs at a spatial scale where the inverse energy cascade develops into the dissipation range. However, the enstrophy cascade is not accounted
for in this case.
(2) We observe 2D turbulence in the dissipation range described by a single exponential function as proposed by J. von Neumann.
(3) Turbulence theory does not apply. The transition between two power-laws or the characteristic scale found using a single exponential function (Eq. (2)) indicates that one scale dominates the turbulent dynamics in the wavenumber range studied.
3 Galaxies
3.1 Inflation
Dramatic developments have taken place in cosmology over the last decade, lending increasing support to the paradigm of inflation as an explanation for what took place before the events described by the big bang theory [16]. Inflation solved the so-called horizon and flatness problems, but was at odds with earlier observations indicating that the ratio of the mass density of the universe to the critical value, the density parameter Ω, was 0.2-0.3, while inflation predicted it should be 1:
Ω = ρ ρc
Ω < 1 : open Ω = 1 : flat Ω > 1 : closed, (6)
where ρc = 3H02/8πG is the critical mass density, H0 = 70 km/s/Mpc is the
Hubble parameter observed today and G is I. Newton’s gravitational con-stant [17]. However, new measurements in the late 1990’s lead to a drastic modification of Ω: Observations of type Ia supernovae (SN) showed that the separation velocity between galaxies was speeding up, not slowing down as would be expected for an open universe. The underlying explanation for this accelerated expansion is not understood, but it seems that the universe con-tains large quantities of negative pressure substance, creating a gravitational repulsion driving the expansion. This negative pressure material is called dark energy, the total density of dark energy ΩΛ is 0.7. The existence of dark
en-ergy is equivalent to the cosmological constant Λ introduced by A. Einstein. The dark matter density Ωd is 0.25 and the baryonic matter density Ωb is
0.05, so the total density is very close (or equal) to the critical density. The SN Ia data is supported by measurements of nonuniformities in the cosmic microwave background (CMB) radiation. The CMB anisotropy is due to the presence of tiny primordial density fluctuations at the time of recombination,
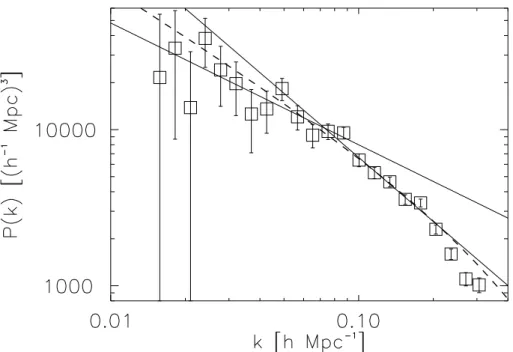
Fig. 2. Wavenumber spectrum of galaxies measured by the SDSS Team. Squares are measured points. Solid lines are power-law fits, the dashed line is a fit to Eq. (1). The power-law fit grouping of points is chosen so the combined, normalized, χ2 of
the fits is minimized. The data is taken from Ref. [23].
where atoms formed. At that point in time the age of the universe was about 300,000 years and the temperature was 3000 K. The structures observed in the CMB are called acoustic peaks, and the simplest versions of inflation all reproduce these structures quite accurately. The acoustic peaks can not be modelled by assuming that the universe is open.
3.2 Wavenumber spectrum
A study of density fluctuations on large scales using 205,443 galaxies has been published by the SDSS Team in Ref. [18], see Fig. 2. 3D maps of the universe are provided by the SDSS galaxy redshift survey, observing about a quarter of the celestial sphere using a 2.5 m telescope and a charge-coupled device (CCD) camera. The galaxies had a mean redshift z ≈ 0.1, corresponding to light emitted 1-2 Gyr ago [17]. Fixing some cosmological parameters to Wilkinson Microwave Anisotropy Probe (WMAP) satellite values [19–21] one finds - using physics based models - that the wavenumber spectrum measurements were fitted by a matter density Ωm = Ωd + Ωb = 0.295 ± 0.0323. In this case
h = H0/(100 km/s/Mpc) = 0.72 was assumed and it was observed that the
A follow-up paper by the SDSS Team, Ref. [22], combined non-CMB mea-surements (SDSS) with CMB meamea-surements (WMAP) to constrain free pa-rameters of cosmological models and break CMB degeneracies in parameter space. This resulted in Ωm = 0.30 ± 0.04 and h = 0.70+0.04−0.03. Adding the SDSS
information more than halved WMAP-only error bars on some parameters, e.g. the Hubble parameter and matter density.
The data presented in Fig. 2 has been taken from M. Tegmark’s homepage [23]. According to the recommendation by the SDSS Team [18], the three largest wavenumbers shown are not used in the fits described below.
As we did for the W7-AS data in Section 2, we fit the SDSS measurements to two power-laws (Eq. (3)) or a single exponential function (Eq. (1)). The power-law fits are shown as solid lines, the exponential fit as a dashed line. The power-law fits yield exponents m = 0.8 (small wavenumbers) and 1.4 (large wavenumbers). The wavenumber ranges were determined by minimizing the combined, normalized, χ2 of the fits. As the SDSS Team found, a single
power-law can not describe the observations. The exponents are not close to the ones governing fluid turbulence discussed in Section 2. The transitional wavenumber is 0.09 h Mpc−1
, corresponding to a length of 67 h−1
Mpc. We find the characteristic length from an exponential fit to be n = 2 h−1
Mpc or a wavenumber of 3 h Mpc−1
.
4 Discussion
The fact that density fluctuations on small (fusion plasmas) and large (galax-ies) scales can be described by an exponential function might indicate that plasma turbulence at early times has been expanded to cosmological propor-tions. A natural consequence of that thought would be to investigate fluctu-ations in quark-gluon plasmas (QGPs) corresponding to even earlier times. However, experimental techniques to do this are not sufficiently developed at the moment due to the extreme nature of QGPs.
It is fascinating that wavenumber spectra over wider scales peak at small wavenumbers and decrease both above and below that peak. This is seen both in fusion plasmas [24] and for galaxies, see e.g. Fig. 38 in Ref. [18]. Turbulence theory in 1D or 3D would interpret the peak position as the scale where energy is injected.
Fitting wavenumber spectra to power-laws is based on fluid turbulence the-ories, but in general care must be taken when interpreting the outcome: We
know that an exponential function can be Taylor expanded to an infinite power series: P (k) ∝ e−nk = ∞ X i=0 (−nk)i i! . (7)
So locally, i.e. for a small range of wavenumbers, an exponential dependency can be masked as a power-law; the exponent would vary as a function of the wavenumber range selected.
We favor the exponential functions over power-laws as descriptors of the data, either including an algebraic prefactor as in Eq. (1) or using a pure exponential function as in Eq. (2): In the latter case, fits yield n = 0.2 cm for fusion plasmas and 11 h−1
Mpc for galaxies. The exponential decrease of density fluctuation power versus wavenumber implies that either (2) or (3) in Section 2 could explain the data. Perhaps forcing occurs at a large scale and transitions either directly to dissipation (2) or to some effect governed by the scale determined from the exponential function (3) at smaller scales. The fact that we obtain n ' ρs using Eq. (1) for fusion plasmas supports this conjecture.
5 Conclusions
We have in this paper reported on suggestive similarities between density fluctuation power versus wavenumber on small (mm) and large (Mpc) scales. The small scale measurements were made in fusion plasmas and compared to predictions from turbulence theory. The data fit Eq. (1), which is consistent with the dissipative range of 2D turbulence. Alternatively, the results fit Eq. (2) which has a functional form that can not be explained by turbulence theory. The large scale measurements were part of the SDSS galaxy redshift survey. As is the case for fusion plasmas, the galaxy data can be described by Eqs. (1) and (2). The similar dependency of density fluctuation power on wavenumber might indicate a common origin of these fluctuations, perhaps from fluctua-tions in QGPs at early stages in the formation of the universe.
The cross-disciplinary work presented here is hopefully just the beginning of an interesting path that can benefit both fields. As a first step, we will expand our studies to encompass a wider range of scales, both for fusion plasma and galaxy measurements.
Acknowledgements
This work was supported at MIT by the Department of Energy, Cooperative Grant No. DE-FC02-99ER54512.
References
[1] F.L. Hinton and R.D. Hazeltine, Rev. Mod. Phys. 48 (1976) 239. [2] A.J. Wootton et al., Phys. Fluids B 2 (1990) 2879.
[3] H. Renner, W7AS Team, NBI Group, ICF Group, and ECRH Group, Plasma Phys. Control. Fusion 31 (1989) 1579.
[4] M. Saffman et al., Rev. Sci. Instrum. 72 (2001) 2579.
[5] N.P. Basse, Ph.D. Thesis, University of Copenhagen, 2002. Available from: http://www.risoe.dk/rispubl/ofd/ris-r-1355.htm.
[6] N.P. Basse et al., Phys. Plasmas 9 (2002) 3035.
[7] P. Hennequin et al., Plasma Phys. Control. Fusion 46 (2004) B121. [8] M.C. Andersen, KVANT 14 (2003) 25.
[9] http://www.sdss.org/.
[10] U. Frisch, Turbulence, Cambridge University Press, Cambridge, UK, 1995. [11] G. Antar et al., Plasma Phys. Control. Fusion 40 (1998) 947.
[12] J. von Neumann, Collected works VI: Theory of games, astrophysics, hydrodynamics and meteorology, ed. A.H. Taub, Pergamon Press, Oxford, UK, 1963.
[13] H. Tennekes and J.L. Lumley, A first course in turbulence, MIT Press, Cambridge, USA, 1972.
[14] G. Antar, Ph.D. Thesis, ´Ecole Polytechnique, 1996.
[15] C. Honor´e et al., in: Proc. 25th European Conference on Controlled Fusion and Plasma Physics, Prague, 1998 (European Physical Society, Petit-Lancy, Switzerland, 1998), vol. 22C, p. 647.
[16] A.H. Guth and D.I. Kaiser, Science 307 (2005) 884.
[17] W.H. Kinney, astro-ph/0301448, 2004.
[18] M. Tegmark et al., Astrophys. J. 606 (2004) 702.
[19] C.L. Bennett et al., Astrophys. J., Suppl. Ser. 148 (2003) 1.
[20] D.N. Spergel et al., Astrophys. J., Suppl. Ser. 148 (2003) 175. [21] L. Verde et al., Astrophys. J., Suppl. Ser. 148 (2003) 195.
[22] M. Tegmark et al., Phys. Rev. D 69 (2004) 103501.
[23] M. Tegmark’s homepage is http://space.mit.edu/home/tegmark/ and the SDSS data used is available on http://space.mit.edu/home/tegmark/sdsspower/ sdss measurements.txt.
[24] N.P. Basse et al., Characterization of core and edge turbulence in L- and enhanced Dα H-mode Alcator C-Mod plasmas, Phys. Plasmas (2005), in press.