HAL Id: hal-01432012
https://hal.sorbonne-universite.fr/hal-01432012
Submitted on 11 Jan 2017
HAL is a multi-disciplinary open access
archive for the deposit and dissemination of sci-entific research documents, whether they are pub-lished or not. The documents may come from teaching and research institutions in France or abroad, or from public or private research centers.
L’archive ouverte pluridisciplinaire HAL, est destinée au dépôt et à la diffusion de documents scientifiques de niveau recherche, publiés ou non, émanant des établissements d’enseignement et de recherche français ou étrangers, des laboratoires publics ou privés.
The Branching Point in Erythro-Myeloid Differentiation
Leïla Perié, Ken r. Duffy, Lianne Kok, Rob j. De boer, Ton n. Schumacher
To cite this version:
Leïla Perié, Ken r. Duffy, Lianne Kok, Rob j. De boer, Ton n. Schumacher. The Branching Point in Erythro-Myeloid Differentiation. Cell, Elsevier, 2015, 163, pp.1655 - 1662. �10.1016/j.cell.2015.11.059�. �hal-01432012�
The branching point in erythro-myeloid differentiation
Leïla Perié1, 2, 4, Ken R Duffy3, Lianne Kok1, Rob J de Boer2 and Ton N Schumacher1
Affiliations:
1Division of Immunology, The Netherlands Cancer Institute, Amsterdam, The Netherlands,
2Theoretical Biology and Bioinformatics, Utrecht University, Utrecht, The Netherlands,
3Hamilton Institute, National University of Ireland, Maynooth, Ireland,
4Institut Curie, PSL Research University, CNRS UMR144, Paris, France
Contact information:
Summary:
Development of mature blood cell progenies from hematopoietic stem cells involves the transition through lineage-restricted progenitors. The first branching point along this developmental process is thought to separate the erythro-myeloid and lymphoid lineage fate by yielding two intermediate progenitors, the common myeloid and the common lymphoid progenitors (CMPs and CLPs). Here, we use single cell lineage tracing to demonstrate that so-called CMPs are highly heterogeneous with respect to cellular output, with most individual CMP yielding either erythrocytes or myeloid cells after transplantation. Furthermore, based on the labeling of earlier progenitors, we show that the divergence between the myeloid and erythroid lineage develops within multipotent progenitors (MPP). These data provide evidence for a new model of hematopoietic branching in which multiple distinct lineage commitments occur in parallel within the MPP pool.
Introduction
During hematopoiesis, hematopoietic stem cells (HSCs) self-renew or differentiate into all blood cell types through successive stages of lineage commitment, a process that has become a prototype of multi-lineage diversification from a stem cell pool. The prevailing model of hematopoiesis predicts a step-by-step process of lineage commitment in which HSCs give rise to multipotent progenitors (MPPs) that subsequently generate intermediate lineage restricted progenitors. Strongest support for this model has come from the identification of the common lymphoid progenitor (CLP) (Kondo et al., 1997) that produces lymphoid cells (i.e. T and B lymphocytes, NK cells) and the common myeloid progenitor (CMP) (Akashi et al., 2000) that gives rise to granulocyte-macrophage (GM) progenitors and the megakaryocyte–erythroid (MkE) progenitors. In this model, the lymphoid-myeloid split forms the first step in lineage commitment downstream of MPPs (Reya et al., 2001). However, a number of studies have questioned the CMP-CLP split as the first step of commitment. Reports of unequal output of GM or MkE progenitors by subsets of CMPs (Iwasaki et al., 2005; Nutt et al., 2005; Terszowski et al., 2005) suggest a separation between the erythroid and myeloid lineages earlier than the CMP stage. Additionally, earlier bypasses towards lymphoid, myeloid (GM) or MkE commitment have been reported in HSCs (Benz et al., 2012; Dykstra et al., 2007; Sanjuan-Pla et al., 2013; Yamamoto et al., 2013) and MPPs (Adolfsson et al., 2005; Cabezas-Wallscheid et al., 2014; Igarashi et al., 2002; Lai and Kondo, 2006; Mansson et al., 2007; Miyawaki et al., 2015; Naik et al., 2013; Pietras et al., 2015; Takano et al., 2004; Yoshida et al., 2006). Based on some of these data, a myelo-lymphoid versus erythro-megakaryocytic separation has been proposed as the first commitment step (Adolfsson et al., 2005), but other results have also contradicted this model (Boyer et al., 2011; Forsberg et al., 2006). Overall, which lineage commitment occurs first between the lymphoid, myeloid or erythroid lineages remains to be determined. Importantly, most of the results that bear on this question have been obtained using in vitro clonal assays or population-based tracking approaches that can miss in vivo cellular heterogeneity and thereby influence our interpretation of lineage commitment. To address this issue, we here have utilized cellular barcoding technology that allows the in vivo tracking of single cell fate (Gerlach et al., 2013; Gerrits et al., 2010; Lu et al., 2011; Naik et al., 2013; Naik et al., 2014; Schepers et al.,
2008) to describe the steps of myeloid and erythroid commitment during successive stages of hematopoietic development.
Results
To understand the clonal output of individual CMPs, we obtained mouse CMPs based on their
original description (ckit+Sca1-CD16/32lowCD34+) (Akashi et al., 2000), labeled these with
unique genetic barcodes in a 6 hr in vitro process, and assessed their ability for myelopoiesis (for the GM lineage) and erythropoiesis (for the MkE lineage). At different time points after
transplantation of 2⋅103 barcode-labeled CMPs into irradiated recipients, CMP-derived myeloid
cells (GFP+CD11b+) and erythroblasts (GFP+Ter119+) were sorted and assessed for their barcode
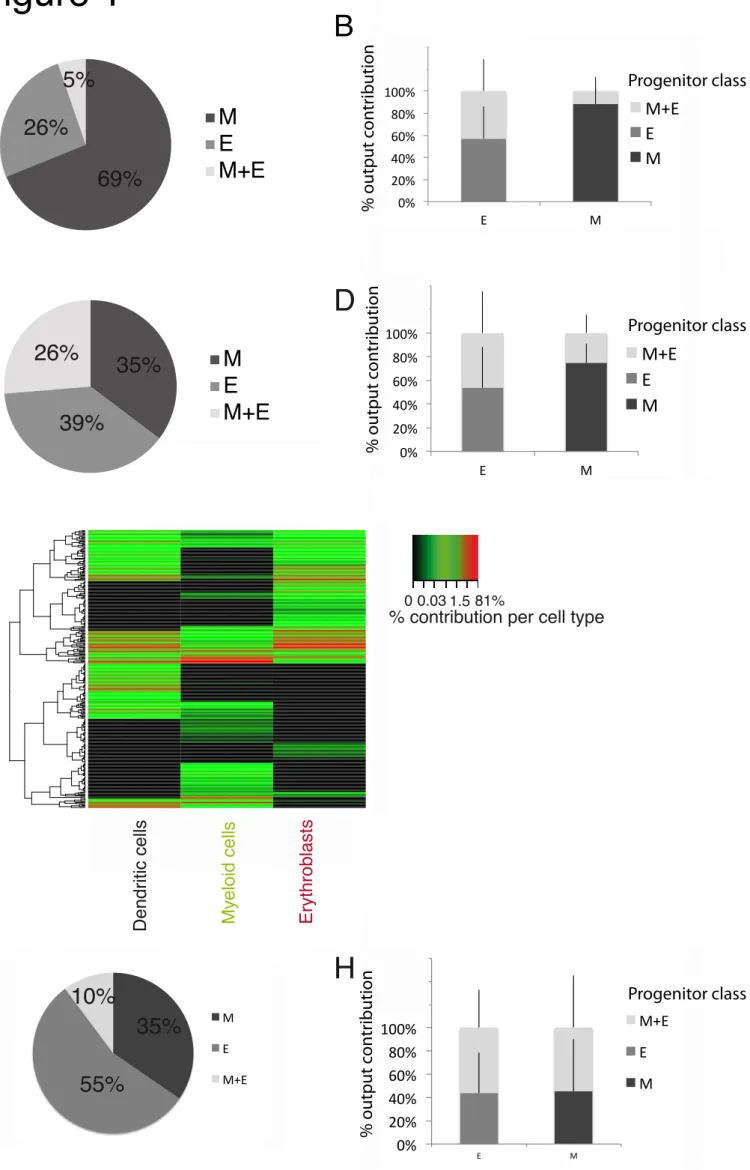
identity using PCR and deep-sequencing (Fig S.1.A, C and D, and Supplemental Table 1). Erythroblasts were measured as a proxy for erythropoiesis, as they retain the nucleus required for barcode analysis. Subsequently, barcode-labeled CMPs were assigned to a class of (lineage biased) progenitor, using a hand-tailored classifier that is based on cellular output of each individual progenitor towards the examined lineages (Naik et al., 2013). Six days after transplantation, we found that 95% of the engrafted CMPs showed highly biased (>99% of cellular output) production of myeloid cells (69±17% of presumed CMPs) or highly biased (>99% of cellular output) production of erythroblasts (26±13% of presumed CMPs) (Fig 1.A, quality controls Fig S2.A and B, effect of classification threshold in Fig S.2.D and F). Furthermore, this large pool of myeloid biased or erythroid biased CMPs accounted for 82±13% and 53±27% of total myeloid cell and erythroblast production respectively (Fig 1.B and Fig S2.D). Only 5±4% of CMPs produced appreciable numbers of both myeloid cells and erythroblasts, overall accounting for 11±12% of total myeloid cell reads and 40±27% of total erythroblast reads (Fig 1.B and Fig S2.D). The observation of these high frequency of uni-outcome CMPs could not be explained by limits of detection or sampling issues, as determined by the following detection controls: I) the per progenitor output (as measured in read counts) of uni-outcome CMPs towards one specific lineage (i.e. myeloid cells or erythroblasts) was as high as the per progenitor output of bi-outcome CMPs toward the same lineage (Fig S2.H) and II) the absence of output of uni-outcome CMPs towards the other lineage was reproducible in technical replicates before applying the replicate filter (not shown). In other words, lack of detectable output of a given CMP towards either the myeloid cell or erythroblast compartment was a reproducible feature.
Similarly, when assessed 14 days after transplantation, 74% of the engrafted CMP produced essentially only myeloid cells (35±3% of presumed CMPs) or only erythroblasts (39±12% of presumed CMPs) (Fig 1.C and Fig S2.E), accounting for 74±16% and 53±35% of total myeloid cell and erythroblast production, respectively (Fig 1.D and Fig S2.G). Also at this point in time, only a minority of CMPs showed substantial production of both myeloid cells and erythroblasts. Finally, heterogeneity in output toward either the myeloid and erythrocyte lineage is not specific to the spleen, but was also observed in the bone marrow, where 90% of the engrafted CMP also produced essentially only myeloid cells (35±9% of presumed CMPs) or essentially only erythroblasts (55±12% of presumed CMPs) (Fig 1.G, and Fig S.4.D and E). The observation of the somewhat higher fraction of CMPs with detectable output in both the myeloid and erythrocyte lineage over time (Day 6: 5±4%; Day 14: 26±15% of presumed CMPs) may either be interpreted as a more prolonged engraftment potential of the small subset of CMPs producing
both erythroblasts and myeloid cells or contamination of CMPs by Lin-Sca1+ckit+ (LSK) cells (Fig S2.C), whose contribution may also be expected to increase over time after transplantation. A preponderance of uni-output was also observed at two CMP doses tested (Fig S.4.F and G). In addition to heterogeneity in output towards the myeloid and erythrocyte lineage, further disparity in cellular output between individual CMPs was observed at day 14 after transplantation (Fig 1.E and Fig S.3), with 16±4% of CMPs producing detectable output only in the dendritic cell (DC) lineage (Fig S.4.A, note that DC production could not be assessed at day 6). These DC uni-outcome CMPs accounted for 24±25% of total DC production (Fig S.4.B) and their presence could not be explained by limits of detection (Fig S.4.B). While these data do not exclude the possibility that some DC uni-outcome CMPs might have produced myeloid cells or erythroblasts at an earlier point in time, this would then imply that individual CMPs differ in the kinetics with which they contribute to DC versus myeloid/erythroid lineage. Collectively, these data show a striking heterogeneity within the CMP pool, greater than previously suggested by in vitro or in vivo experiments that examined output at the population level (Iwasaki et al., 2005; Nakorn et al., 2003; Nutt et al., 2005; Terszowski et al., 2005). Importantly, this heterogeneity could not be explained by detection issues and it was relatively insensitive to the threshold used for output classification (Fig S.2.D-H and Fig S.4.C-E).
To determine at which developmental point the observed divergence between the myeloid and
erythroid lineage occurs, we subsequently generated barcode-labeled HSCs (LSK+CD150+) and
MPPs (LSK+CD150-Flt3+, excluding LMPPs) (Fig S1.B) and, after transplantation, analyzed
their production of myeloid cells and erythroblasts, together with their lymphoid cell production
(measured by analysis of CD19+ B cells), and CD11c+ dendritic cell production (Fig S1.D). As
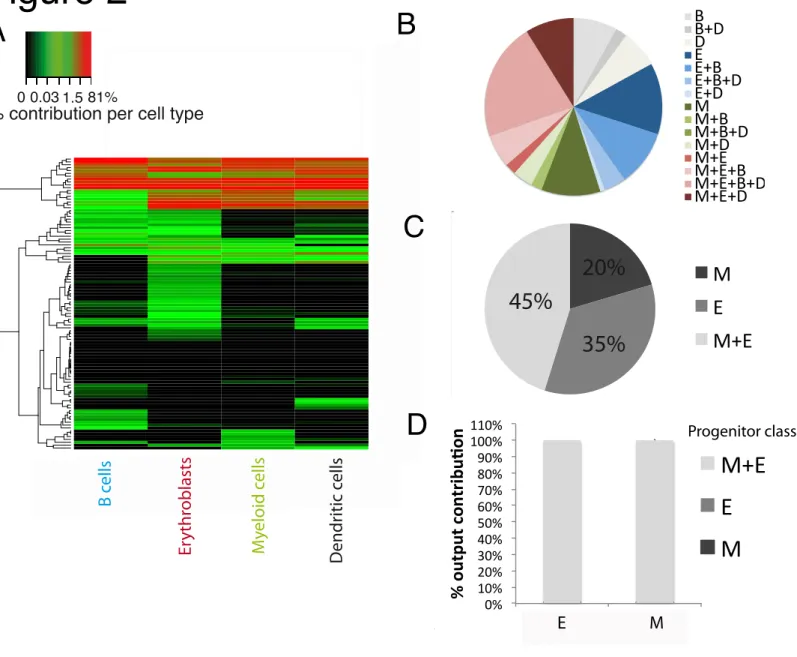
previously described using cellular barcoding (Gerrits et al., 2010; Naik et al., 2013), a small number of HSC were the major contributors to total cellular output at day 27 after transplantation, and these HSC were multi-outcome (Fig 2.A and B, and Fig S6.A). With respect to contribution towards the erythroid and myeloid lineage, >99% of the total cell output of myeloid cells and erythroblasts was derived from HSCs (45±7%) that produced both cell types at this time point (Fig 2.C and D, quality controls and effect of classification threshold Fig S.5.A-C). Some HSCs produced only myeloid cells (10±4%) or erythroblasts (12±7%), without detectable production of any of the other cell types (Fig 2.B). However, these HSCs collectively contributed to less than 0.1% of the total cell output of erythroblasts and myeloid cells (Fig 2.D and Fig S.5.C). Furthermore, the occurrence of these biased HSCs may well be explained by insufficient sensitivity of detection, as these HSCs have a per progenitor output (as measured in read counts) towards the erythroid or the myeloid lineage that is several fold lower than that of multi-outcome HSCs for the same lineage (Fig S.5.D). Also, when assessed at day 42 after
transplantation (Fig S.6.B), the vast majority of myeloid cells and erythroblasts (≥90%) were
derived from HSCs that contributed to both lineages. In conclusion, the large majority of erythroid and myeloid cells are produced by multi-outcome HSCs.
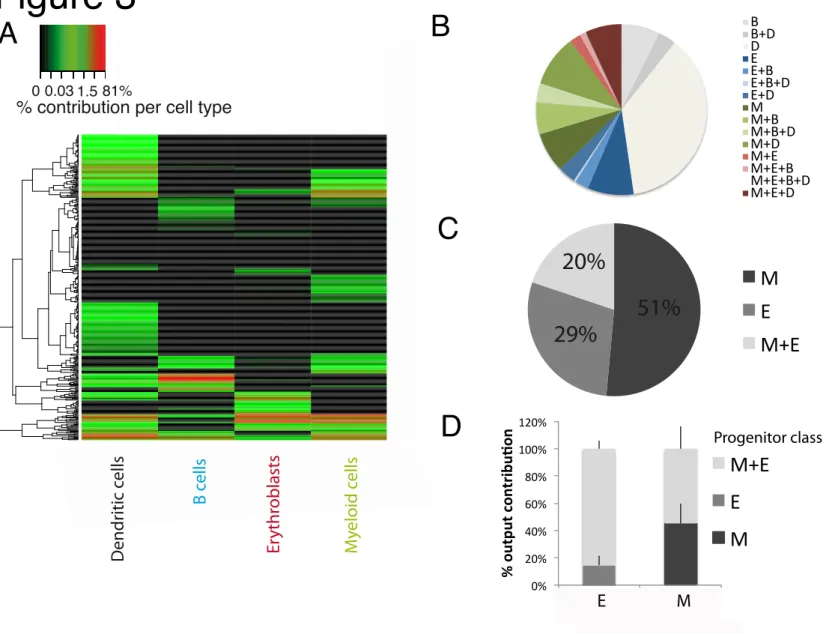
In contrast to this, substantial variability in the ability to contribute to erythroid and myeloid cell production was apparent amongst MPPs (Fig 3.A and B). At Day 14 after transplantation, only 20±9% of the MPPs produced both erythroblasts and myeloid cells, irrespective of their capacity to produce dendritic cells or B cells (Fig 3.C and Fig S.8, quality controls and effect of classification threshold in Fig S.7.A and B). While these cells still contributed to a large fraction
of erythroblast output (84±23%), approximately 50% of total myeloid output was derived from the large pool of MPPs (51±9%) that produced myeloid cells without producing erythroblasts (Fig 3.D and Fig S7.C). Furthermore, contrary to the uni-outcome biased HSCs, the observation of these myeloid-not-erythroid biased MPPs could not be explained by limits of detection, as I) these cells consistently had a per progenitor output (as measured in read counts in myeloid cells) as high as the per progenitor output (read counts in myeloid cells) of MPP producing both myeloid cells and erythroblasts (Fig S.7.D); II) their lack of output in erythroblasts was reproducible in technical replicates before applying the replicate filter (not shown). Note that we also detected a significant fraction of MPPs that only show dendritic cell output (Fig 3.B), as has also been observed for LMPPs (Naik et al., 2013). These data show the existence of a subpopulation of true common progenitors to myeloid and erythroid lineages within the MPP
pool, potentially within the recently described CD41+ cell population (Miyawaki et al., 2015).
However, within the MPP population, divergence of a myeloid biased subpopulation is already apparent.
Discussion
The main finding of this work is that the population classically defined as common myeloid progenitors is highly heterogeneous, with most individual CMPs only yielding erythrocytes or only yielding myeloid cells after transplantation, and with some CMPs contributing towards the DC lineage only. A minor subpopulation is observed that could represent a rare but true subset of bipotent CMP, but may also reflect a contamination of LSK+ cells.
As the existence of a “common” erythro-myeloid progenitor has been the basis for the model in which the first step of commitment is formed by the separation between CMP and CLP, our findings suggest a revised model of hematopoiesis. Miyawaki et al. have recently identified a more immature common myeloid progenitor within the MPP population (Miyawaki et al., 2015). Existence of such a common erythro-myeloid progenitor is still consistent with a model in which the first step of commitment is formed by the myeloid-lymphoid split. Likewise, our data also show that a true common erythro-myeloid progenitor exists within the MPP population. Importantly though, 40% of the total output of myeloid cells was derived from progenitors that neither produced erythrocytes or lymphoid cells (Fig S.7.C). These data indicate that, next to the classical erythro-myeloid versus lymphoid split, an additional myeloid-only commitment already manifests itself at the MPP stage.
Alternative models for hematopoiesis have been proposed in which the megakaryocyte-erythroid lineage branches first, followed by a myeloid-lymphoid split (Adolfsson et al., 2005; Arinobu et al., 2007). In this model, direct erythropoiesis from HSC or MPP is predicted to occur independently of myelopoiesis and lymphopoiesis. We did not observe evidence for a significant role of such an erythroid bypass from either HSC or MPP. Specifically, of total erythroblast production from HSC or MPP respectively, only 0.1±0.1% and 9±0.01% was derived from cells that did not yield myeloid or B cells. Elegant recent in vivo lineage tracing analysis suggests that transplantation can skew output of HSCs towards a few dominant clones (Sun et al., 2014). However, at least under transplantation conditions, an early erythroid commitment (Yamamoto et al., 2013) is at best a minor pathway.
The experimental measurements that we make in our work are the in vivo output of single cells. As such, the strong bias in single cell output that we observe could result from the commitment pre-injection of the cells that are used for reconstitution, or a dominant effect of the niche in which an individual progenitor cell finds itself after transplantation. We strongly believe that the biased output that we observe for individual progenitor cells originates from pre-commitment for two reasons. First, a pre-commitment of for instance individual CMP to produce either erythrocytes or myeloid cells implies an ‘encoding’ of this commitment at the genetic level, and the observation of substantial transcriptional heterogeneity between individual cells within the murine CMP pool by Amit and coworkers (I. Amit, pers. comm.) provides strong support for such a model. Second, if the commitment towards the production of a single type of output is pre-existing rather than induced by the niche that is encountered, one would expect to also observe heterogeneous behavior under in vitro conditions in which individual cells all experience identical conditions. In support of this, Notta and colleagues have provided strong evidence that human bone marrow CMPs and MPPs are highly heterogeneous and composed of subpopulations with uni-outcome myeloid, erythroid, and megakaryocyte potential in in vitro assay systems (Notta et al., 2015).
Collectively with these data, our single cell tracing data provide evidence for a model in which multiple combinations of lineage commitments (e.g. erythroid-myeloid, myelo-lymphoid) are already manifest during the transition of the MPP stage of hematopoietic development. The combination of single cell transcriptomics and single cell lineage tracing, preferably under conditions of unperturbed hematopoiesis (Sun 2014, Busch 2015) should help reveal how sibling cells commit to different types of output at this stage.
Experimental procedures:
Mice, progenitor isolation and barcode labeling
C57BL/6J (CD45.2) donor mice, and C57BL/6 Pep3b (CD45.1) recipient mice irradiated with 5 gy were used in all experiments. Labeling of cells with the lentiviral barcode library was performed as described in (Naik et al., 2013). In brief, BM was harvested from femurs, tibias and
ilia and enriched using anti-CD117 magnetic beads (Miltenyi). The c-kit+ fraction was stained
with antibodies against CD16/32 (FITC, clone 24G2, BD Pharmingen or PerCPCy5.5, clone 24G2, BD Biosciences), CD117 (c-kit APC, clone 2B8, Biolegend), Sca-1 (Pacific Blue, clone D7, Biolegend), CD135 (Flt3 PE, clone A2F10, ebiosciences), CD34 (alexa700, clone RAM34, ebioscience) and CD150 (Slam PEcy7, clone TC15-12F12.2, Biolegend). MPPs, CMPs and HSCs were sorted using a strategy similar to that described previously (Akashi et al., 2000) (Fig
S.1.B & C). Per experiment, up to 105 progenitors were transduced for 6 h in stem cell medium
(stempan SFEM, Stem Cell Technologies) with 50ng/ml stem cell factor (SCF). For the first 90 min of transduction, progenitors were centrifuged at 200rpm (low brake) and cells were subsequently incubated at 37°C for 4.5 hours. Following transduction, cells were washed and injected intravenously into at least two recipient mice in saline solution. Efficiency of transduction ranged between 10-40%.
Cell isolation
Cell suspensions were derived from spleen or bone marrow of killed mice and positively selected for Ter119 expression using biotinylated anti-Ter119 antibody (BD Pharmingen) and anti-biotin
against CD45.2 (Pacific blue, clone 104, Biolegend), CD11C (APC, clone HC3, BD biosciences), CD11b (PercPCy5.5, clone M1/70, ebioscience), CD19 (APC-Cy7, clone 1D3, BD Pharmingen), Ter119 (PEcy7, BD Pharmingen) to sort Myeloid cells, B cells and Dendritic Cells
(Fig S1.D). The Ter119+ fraction was stained at 4°C with antibody against Ter119 (Pecy7, BD
Pharmingen) to sort the erythroblast fraction (Fig S1.D). Output cell types were sorted following the gating strategy in Fig S1.D and cell numbers are depicted in Supplemental Table 1.
Polymerase chain reaction and sequencing
Sorted cell samples were lysed in Viagen buffer (direct PCR, Viagen) and split into technical replicates (Schumacher et al., 2010). Barcodes were amplified by nested polymerase chain reaction (PCR) as previously described in (Naik et al., 2013). In brief, barcode sequences were first amplified using top-LIB (5’TGCTGCCGTCAACTAGAACA-3’) and bot-LIB (5’GATCTCGAATCAGGCGCTTA-3’) primers (30 cycles: 15’’ 95°C; 15’’ 57.2°C; 15’’ 72°C).
PCR products were then subjected to a 2nd PCR (30 cycles: 5’’ 94°C; 5’’ 57.2°C; 5’’ 72°C) in
which the P5 and P7 (5’-CAAGCAGAAGACGGCATACGAGAT-3’) adaptors required for sequencing on Illumina platforms, as well as a unique 8 bp index and a sequencing primer annealing site were attached. Primers used were as follows: forward (5’-P5-seq_prim-index-CAGGCGCTTAGGATCC-3’), reverse (5’-P7-TGCTGCCGTCAACTAGAACA-3’). Up to 192 tagged PCR products were pooled and sequenced by next-generation sequencing using a HiSeq2000 or HiSeq2500 platform (Illumina). Total read lengths were 50-60 bp, of which the first 22 bp consisted of the index and constant regions. The following 15 bp were used to distinguish between different barcodes.
Filtering procedure
Sequence reads were first screened for quality by the software packages that are part of the
Illumina pipeline and only high-quality reads were selected (~10-70x106 per run). Subsequently,
only reads showing a 100% match to the expected scheme: index-CAGGCGCTTAGGATCC-random_sequence were selected (typically >90% of reads), whereby a 100% match to one of the 192 index sequences was required. Of the random sequence (the barcode), only the first 15 bp were considered. To filter out reads that reflect PCR or sequencing errors within the 15 bp barcode region, all filtered reads were compared to a barcode reference list (Gerlach et al., 2013), and only sequences that showed a 100% match to one of the sequences within the barcode reference file were maintained (typically 80-93%).
Using a customized script in R (Team, 2014), we subsequently applied a filtering procedure composed of 3 steps, similar to the procedure used in (Naik et al., 2013). Specifically, samples for which insufficient read counts were obtained during deep sequencing (average of the two
technical replicates less than 103, compared to the expected 105) were first excluded. Samples
having passed this step were then normalized to 105 reads for each sample. To control the quality
of the analysis of the barcode content of a given sample, we additionally excluded samples where the two technical replicates displayed a Pearson correlation coefficient of <0.8. These technical replicate controls are essential to give confidence whether barcode expansion and cell type recovery were sufficient for informative lineage relationship analysis. Thirdly, after passing these technical replicate quality controls, all reads of barcodes present in only one of the two technical replicates of a given sample – an indication that there was a low confidence for inclusion of that barcode – were changed to zero (0) reads for that sample. Resulting data were collated in a table of normalized barcode read counts in each cell type.
Barcode analysis and barcode classification
For heatmap analysis, read counts were transformed using the hyperbolic arcsine function that is similar to a logarithmic function, but can accommodate barcode reads with a value of 0. After confirming that technical replicates yielded similar data, as described above and by visual inspection (Fig S.2.A,S.5.A and S.7.A), their average was taken for further analysis.
To classify individual progenitors by their lineage bias, we used a previously published hand tailored classifier (Naik et al., 2013). In summary, an additional normalization per progenitor was applied in each mouse, thereby enabling categorization into classes of biased output towards the analyzed lineages (Myeloid cells, Erythroblasts, Dendritic cells or B cells depending on the experiment). Potency to contribute to a given lineage was assigned if more than 1% of the output of a given CMP, MPP, or HSC was towards that lineage (Fig 1-3). Other thresholds were also analyzed (Fig S.2, S.4, S.5,S.7).
Quality controls
To illustrate the quality of the samples, the barcodes find in both duplicates of the same sample are always compared and representative plots of each experiment are provided in the supplemental figures (Fig S.2, S.4, S.5,S.7). Furthermore, by cross-comparing two mice that received barcoded progenitors from the same transduction batch, the extent of ‘repeat use’ – instances where two progenitors are transduced with virus particles that harbor the same barcode – was always compare and was found to be minimal (Fig S.2, S.4, S.5,S.7).
Uni-outcome progenitors were further analyzed for potential detection issues by: I). Determining
whether the distribution of clonal outputs of uni-outcome progenitors towards one specific
lineage was similar to the clonal output towards the same lineage of multi-outcome progenitors.
II). Determining whether the lack of output of uni-outcome progenitors towards the other
lineages was reproducible in technical replicates before applying the replicate filter.
Author Contributions:
L.P designed, performed experiments and analyzed data; K.D performed data analysis; L.K performed experiments; R.d.B. supervised data analysis; T.S. supervised the study. L.P and T.S wrote the paper incorporating feedback from all coauthors.
Acknowledgments:
The authors thank A. Pfauth and F. van Diepen for cell sorting, J. Urbanus for lentivirus production, A. Velds and R. Kluin for computational assistance and S. Naik for discussion. The data and the code presented in this manuscript are available upon request. The authors declare no conflict of interest. This work was supported by Human Frontier Science Program grant RGP0060/2012 (to T.S. and K.D.). Netherlands Organization for Scientific Research grant TOPGO.L.10.042 (to T.S. and R.d.B.), ERC grant Life-His-T (to T.S.), and Science Foundation Ireland grant 12 IP 1263 (to K.D.), an ATIP-Avenir grant from CNRS and Bettencourt-Schueller Foundation (to L.P.) and two grants from the Labex CelTisPhyBio (No. ANR-10- LBX-0038) and Idex Paris-Science-Lettres Program (ANR-10-IDEX-0001-02 PSL) (to L.P.).
References and Notes:
Adolfsson, J., Mansson, R., Buza-Vidas, N., Hultquist, A., Liuba, K., Jensen, C.T., Bryder, D., Yang, L., Borge, O.J., Thoren, L.A., et al. (2005). Identification of Flt3+ lympho-myeloid stem cells lacking erythro-megakaryocytic potential a revised road map for adult blood lineage commitment. Cell 121, 295-306.
Akashi, K., Traver, D., Miyamoto, T., and Weissman, I.L. (2000). A clonogenic common myeloid progenitor that gives rise to all myeloid lineages. Nature 404, 193-197.
Arinobu, Y., Mizuno, S., Chong, Y., Shigematsu, H., Iino, T., Iwasaki, H., Graf, T., Mayfield, R., Chan, S., Kastner, P., et al. (2007). Reciprocal activation of GATA-1 and PU.1 marks initial specification of hematopoietic stem cells into myeloerythroid and myelolymphoid lineages. Cell stem cell 1, 416-427.
Benz, C., Copley, M.R., Kent, D.G., Wohrer, S., Cortes, A., Aghaeepour, N., Ma, E., Mader, H., Rowe, K., Day, C., et al. (2012). Hematopoietic stem cell subtypes expand differentially during development and display distinct lymphopoietic programs. Cell stem cell 10, 273-283.
Boyer, S.W., Schroeder, A.V., Smith-Berdan, S., and Forsberg, E.C. (2011). All hematopoietic cells develop from hematopoietic stem cells through Flk2/Flt3-positive progenitor cells. Cell stem cell 9, 64-73.
Cabezas-Wallscheid, N., Klimmeck, D., Hansson, J., Lipka, D.B., Reyes, A., Wang, Q., Weichenhan, D., Lier, A., von Paleske, L., Renders, S., et al. (2014). Identification of regulatory networks in HSCs and their immediate progeny via integrated proteome, transcriptome, and DNA methylome analysis. Cell stem cell 15, 507-522.
Dykstra, B., Kent, D., Bowie, M., McCaffrey, L., Hamilton, M., Lyons, K., Lee, S.J., Brinkman, R., and Eaves, C. (2007). Long-term propagation of distinct hematopoietic differentiation programs in vivo. Cell stem cell 1, 218-229.
Forsberg, E.C., Serwold, T., Kogan, S., Weissman, I.L., and Passegue, E. (2006). New evidence supporting megakaryocyte-erythrocyte potential of flk2/flt3+ multipotent hematopoietic progenitors. Cell 126, 415-426.
Gerlach, C., Rohr, J.C., Perie, L., van Rooij, N., van Heijst, J.W., Velds, A., Urbanus, J., Naik, S.H., Jacobs, H., Beltman, J.B., et al. (2013). Heterogeneous Differentiation Patterns of Individual CD8+ T Cells. Science.
Gerrits, A., Dykstra, B., Kalmykowa, O.J., Klauke, K., Verovskaya, E., Broekhuis, M.J., de Haan, G., and Bystrykh, L.V. (2010). Cellular barcoding tool for clonal analysis in the hematopoietic system. Blood 115, 2610-2618.
Igarashi, H., Gregory, S.C., Yokota, T., Sakaguchi, N., and Kincade, P.W. (2002). Transcription from the RAG1 locus marks the earliest lymphocyte progenitors in bone marrow. Immunity 17, 117-130.
Iwasaki, H., Somoza, C., Shigematsu, H., Duprez, E.A., Iwasaki-Arai, J., Mizuno, S., Arinobu, Y., Geary, K., Zhang, P., Dayaram, T., et al. (2005). Distinctive and indispensable roles of PU.1 in maintenance of hematopoietic stem cells and their differentiation. Blood 106, 1590-1600. Kondo, M., Weissman, I.L., and Akashi, K. (1997). Identification of clonogenic common lymphoid progenitors in mouse bone marrow. Cell 91, 661-672.
Lai, A.Y., and Kondo, M. (2006). Asymmetrical lymphoid and myeloid lineage commitment in multipotent hematopoietic progenitors. The Journal of experimental medicine 203, 1867-1873. Lu, R., Neff, N.F., Quake, S.R., and Weissman, I.L. (2011). Tracking single hematopoietic stem cells in vivo using high-throughput sequencing in conjunction with viral genetic barcoding. Nature biotechnology 29, 928-933.
Mansson, R., Hultquist, A., Luc, S., Yang, L., Anderson, K., Kharazi, S., Al-Hashmi, S., Liuba, K., Thoren, L., Adolfsson, J., et al. (2007). Molecular evidence for hierarchical transcriptional lineage priming in fetal and adult stem cells and multipotent progenitors. Immunity 26, 407-419. Miyawaki, K., Arinobu, Y., Iwasaki, H., Kohno, K., Tsuzuki, H., Iino, T., Shima, T., Kikushige, Y., Takenaka, K., Miyamoto, T., et al. (2015). CD41 marks the initial myelo-erythroid lineage specification in adult mouse hematopoiesis: redefinition of murine common myeloid progenitor. Stem Cells 33, 976-987.
Naik, S.H., Perie, L., Swart, E., Gerlach, C., van Rooij, N., de Boer, R.J., and Schumacher, T.N. (2013). Diverse and heritable lineage imprinting of early haematopoietic progenitors. Nature
496, 229-232.
Naik, S.H., Schumacher, T.N., and Perie, L. (2014). Cellular barcoding: a technical appraisal. Experimental hematology 42, 598-608.
Nakorn, T.N., Miyamoto, T., and Weissman, I.L. (2003). Characterization of mouse clonogenic megakaryocyte progenitors. Proceedings of the National Academy of Sciences of the United States of America 100, 205-210.
Notta, F., Zandi, S., Takayama, N., Dobson, S., Gan, O.I., Wilson, G., Kaufmann, K.B., McLeod, J., Laurenti, E., Dunant, C.F., et al. (2015). Distinct routes of lineage development reshape the human blood hierarchy across ontogeny. Science.
Nutt, S.L., Metcalf, D., D'Amico, A., Polli, M., and Wu, L. (2005). Dynamic regulation of PU.1 expression in multipotent hematopoietic progenitors. The Journal of experimental medicine 201, 221-231.
Pietras, E.M., Reynaud, D., Kang, Y.A., Carlin, D., Calero-Nieto, F.J., Leavitt, A.D., Stuart, J.M., Gottgens, B., and Passegue, E. (2015). Functionally Distinct Subsets of Lineage-Biased Multipotent Progenitors Control Blood Production in Normal and Regenerative Conditions. Cell stem cell 17, 35-46.
Reya, T., Morrison, S.J., Clarke, M.F., and Weissman, I.L. (2001). Stem cells, cancer, and cancer stem cells. Nature 414, 105-111.
Sanjuan-Pla, A., Macaulay, I.C., Jensen, C.T., Woll, P.S., Luis, T.C., Mead, A., Moore, S., Carella, C., Matsuoka, S., Bouriez Jones, T., et al. (2013). Platelet-biased stem cells reside at the apex of the haematopoietic stem-cell hierarchy. Nature 502, 232-236.
Schepers, K., Swart, E., van Heijst, J.W., Gerlach, C., Castrucci, M., Sie, D., Heimerikx, M., Velds, A., Kerkhoven, R.M., Arens, R., et al. (2008). Dissecting T cell lineage relationships by cellular barcoding. The Journal of experimental medicine 205, 2309-2318.
Schumacher, T.N., Gerlach, C., and van Heijst, J.W. (2010). Mapping the life histories of T cells. Nature reviews Immunology 10, 621-631.
Sun, J., Ramos, A., Chapman, B., Johnnidis, J.B., Le, L., Ho, Y.J., Klein, A., Hofmann, O., and Camargo, F.D. (2014). Clonal dynamics of native haematopoiesis. Nature 514, 322-327.
Takano, H., Ema, H., Sudo, K., and Nakauchi, H. (2004). Asymmetric division and lineage commitment at the level of hematopoietic stem cells: inference from differentiation in daughter cell and granddaughter cell pairs. The Journal of experimental medicine 199, 295-302.
Team, R.C. (2014). R: A language and environment for statistical computing. R Foundation for
Statistical Computing. Vienna, Austria URL http://wwwR-projectorg/.
Terszowski, G., Waskow, C., Conradt, P., Lenze, D., Koenigsmann, J., Carstanjen, D., Horak, I., and Rodewald, H.R. (2005). Prospective isolation and global gene expression analysis of the erythrocyte colony-forming unit (CFU-E). Blood 105, 1937-1945.
Yamamoto, R., Morita, Y., Ooehara, J., Hamanaka, S., Onodera, M., Rudolph, K.L., Ema, H., and Nakauchi, H. (2013). Clonal analysis unveils self-renewing lineage-restricted progenitors generated directly from hematopoietic stem cells. Cell 154, 1112-1126.
Yoshida, T., Ng, S.Y., Zuniga-Pflucker, J.C., and Georgopoulos, K. (2006). Early hematopoietic lineage restrictions directed by Ikaros. Nature immunology 7, 382-391.
Figure legends:
Fig. 1. Individual CMPs yield either erythrocytes or myeloid cells
Barcode-labeled CMPs were transplanted into 5gy-irradiated mice. At day 6 (A and B) or 14 (C-
E) post-transplantation, Myeloid cells (CD11b+), Erythroblasts (Ter119+) and Dendritic Cells
(CD11c+) were recovered from spleen and barcode content was analyzed. (A and C) Proportion
of CMPs classified as producing either M (Myeloid cells), E (Erythroblasts) or both, using a 1% classification threshold (other thresholds in Fig S.2). (B and D) Quantitative contribution of the three classes to each lineage (mean+sd). (E) Heatmap representation of the output of individual CMPs (rows) to different cell types (columns) at day 14 (248 barcodes, pooled data of 4 mice), arcsin transformed data clustered by complete linkage using Euclidean distances. For day 6, 636 single CMPs were analyzed (58±46 CMPs/mouse), data shown in (A) and (B) displays average+sd over 3 experiments, 4 mice/experiment; for day 14, 248 single CMPs were analyzed (62±18 CMPs/mouse), data shown in (C) and (D) displays average+sd over 2 experiments, 2 mice/experiment. Quality controls in Fig S2. (G) Proportion of CMPs classified as producing output as defined in (A) in bone marrow at day 14 post-transplantation. (H) Quantitative contribution of the three classes to each lineage (mean+sd). For G and H, 89 barcodes were analyzed (29±6 CMPs/mouse) over 2 experiments, 2 mice/experiment), other thresholds than 1% displayed in Fig S.4.D and E.
Fig. 2. Common origin of Erythrocytes and myeloid cells within HSC
Barcode-labeled CD150+ HSCs were transplanted into 5gy-irradiated mice. At day 27
post-transplantation, Myeloid cells (CD11b+), Erythroblasts (Ter119+), B cells (CD19+) and dendritic
cells (CD11c+) were recovered from spleen and barcode content was analyzed. (A) Heatmap
representation of the output of individual CD150+ HSC (rows) to different cell types (columns),
arcsin transformed data. (B) Proportion of HSCs classified using a 1% classification threshold in the different possible categories (averaged over mice). (C) Same analysis as in (B) but examining erythroblast and myeloid cell output only (D) Quantitative contribution of the different classes to Myeloid cell and Erythroblast production (mean+sd). All the results comes from 4 mice/experiment. Quality controls and other thresholds in Fig S5.
Fig. 3. Divergence between erythrocyte and myeloid output within the MPP pool
Barcode-labeled MPPs were transplanted into 5gy-irradiated mice. At day 14
post-transplantation, Myeloid cells (CD11b+), Erythroblasts (Ter119+), B cells (CD19+) and dendritic
cells (CD11c+) were recovered from spleen and barcode content was analyzed. (B) Proportion of
MPPs classified using a 1% classification threshold in the different possible categories (average over mice). (C) Same analysis as (B) but examining erythroblasts and myeloid cell output only (D) Quantitative contribution of the classes to Myeloid cell and Erythroblast production from
barcode-labeled MPPs (mean+sd). All results come from 4 mice/experiment. Quality controls and other thresholds in Fig S7.
Figure 1
A
M
E
M+E
M
E
M+E
69%
5%
26%
35%
26%
39%
D
C
LP32_d14_DC LP32_d14_M LP32_d14_E2 241 82 212 38 158 146 236 192 218 85 116 115 124 261 170 110 156 55 120 286 114 119 113 290 289 201 50 186 61 179 184 62 279 288 181 185 175 204 176 118 117 178 180 182 121 177 123 64 130 172 45 156 260 208 203 256 193 257 171 249 111 132 173 202 247 264 253 285 280 47 48 291 275 197 283 53 51 191 281 52 54 282 287 49 278 196 277 133 284 57 276 183 238 45240 28 227 211 222 235 244 32 234 91 98 140 155 135 131 75 7102 230 13 125 95 97 100 17 128 70 187 217 9221 83 246 137 279 36 73 136 19 14 40 67 89 213 200 99 216 210 239 88 214 148 228 139 154 3206 145 86 141 92 229 194 225 152 215 94 42 87 69 23 33 68 80 58 188 245 150 149 157 31 93 78 142 72 101 81 77 190 104 103 112 163 252 266 165 43 122 199 271 251 106 259 160 107 258 105 189 44 270 272 174 268 198 162 262 108 169 263 209 8254 274 265 255 248 63 250 164 161 46 109 207 267 127 273 168 269 166 167 129 159 20 24 39 237 22 126 11 66 147 153 26 144 138 143 232 219 231 233 74 25 151 226 96 242 220 41 27 12 15 205 134 195 37 243 76 10 18 21 90 65 59 84 35 223 29 30 634 224 71 16% contribution per cell type0 0.03 1.5 81%
Erythroblasts Myeloid cells Dendritic cells !"# $!"# %!"# &!"# '!"# (!!"# ($!"# (%!"# )# *# *+)# )# *#
B
!"# $!"# %!"# &!"# '!"# (!!"# ($!"# (%!"# )# *# *+)# )# *#E
39%
% output c on tr ibution % output c on tr ibution Progenitor class Progenitor classG
!" #" !$#"35%
10%
55%
%!"#&!"# '!"# (!!"# ($!"# (%!"# (&!"# *+)# )# *#H
on tr ibution Progenitor classFigure 2
A
d27_stHSC_B d27_stHSC_E d27_stHSC_My d27_stHSC_DC 56 89 67 92 158 10 13 110 113 295 97 109 42 46 85 19 45 77 29 48 39 32 41 55 91 111 100 105 116 30 18 75 58 21 23 108 112 114 107 84 36 28 27 82 63 72 70 49 50 40 60 71 81 79 938 34 69 78 64 468 52 43 102 57 53 73 666 106 22 12 733 115 15 96 17 324 62 76 103 44 35 93 59 101 25 47 26 65 61 20 54 16 51 80 B c ells Er ythr oblasts M yeloid c ells D endr itic c ells!"
#"
!$#"
!"# $!"# %!"# &!"# '!"# (!"# )!"# *!"# +!"# ,!"# $!!"# $$!"# -# .# !"#$%&$%"'#(%)*+$,#(""./-#
-#
.#
B
C
D
B B+D D E E+B E+B+D E+D M M+B M+B+D M+D M+E M+E+B M+E+B+D M+E+D E M45%
20%
35%
Progenitor class 0 0.03 1.5 81%Figure 3
B
C
D
d14_MPP_DC d14_MPP_B d14_MPP_E d14_MPP_M 63 136 146 287 268 163 261 162 140 35 178 130 40 199 220 49 160 311 102 14 2244 181 250 157 126 6135 143 10 55 142 134 147 121 131 132 149 127 229 111 228 164 113 232 359 171 357 31 269 354 327 328 197 317 305 7150 165 65 306 176 172 169 175 168 293 62 60 167 59 308 122 307 173 309 61 170 362 361 234 161 85 73 254 252 248 253 264 267 11 12 271 249 251 247 266 273 246 152 242 192 355 193 204 183 278 206 210 97 53 94 92 182 187 26 219 341 180 337 356 336 203 319 321 330 208 347 217 310 323 191 334 335 45 303 313 77 314 47 95 349 188 324 83 348 338 325 225 72 89 227 68 320 100 207 213 353 87 270 101 222 216 189 19 238 233 38 50 119 118 27 29 286 236 256 239 241 277 257 258 255 288 292 282 281 280 263 272 245 274 260 240 275 276 358 112 108 230 231 346 312 315 265 200 333 185 190 139 212 71 107 117 106 259 294 34 284 235 237 42 114 110 37 105 886 99 298 289 296 88 283 345 46 184 148 156 290 360 104 109 116 57 243 302 115 141 129 123 133 128 124 120 137 154 166 144 145 136 541 52 155 30 21 25 23 58 413 153 279 174 285 16 317 15 43 928 54 22 20 44 318 18 159 125 81 291 24 138 351 96 316 51 198 158 48 195 326 90 179 209 211 202 297 39 262 221 223 177 205 226 304 93 201 215 33 82 299 64 78 75 224 350 80 331 56 186 301 300 218 32 343 352 329 79 103 194 342 344 214 151 98 340 332 74 91 66 84 69 70 295 339 196 76 67 322 B c ells Er ythr oblasts M yeloid c ells D endr itic c ells !"# $!"# %!"# &!"# '!"# (!!"# ($!"# )# *# !"#$%&$%"'#(%)*+$,#(""*+)#
)#
*#
!"
#"
!$#"
29%
20%
51%
B B+D D E E+B E+B+D E+D M M+B M+B+D M+D M+E M+E+B M+E+B+D M+E+D E MA
% contribution per cell type0 0.03 1.5 81%
Supplemental Materials:
Supplemental Table 1 Figures S1-S8
Legends of Supplemental Figures
Fig S.1. Summary of experimental setup and sort profiles of progenitors and output cell types
(A). Progenitors (HSC, MPP or CMP) were transduced with low efficiency (5-15%) to minimize the chance of 2 different barcode virus particles integrating into the same progenitor. Progenitors from a single transduction batch were then transplanted into 2-8 5gy irradiated mice (to allow later comparison of barcodes between mice as a control for random barcode sharing). At the indicated time points after transplantation, Myeloid cells (CD11b+), Erythroblasts (Ter119+), Dendritic Cells (CD11c+) and B cells (CD19+) were isolated from the spleen of recipient mice. Each sample was split into two replicates; barcodes were amplified by PCR and analyzed by deep-sequencing. (B). Bone marrow progenitors were enriched using anti-CD117 (c-kit) magnetic beads and subsequently stained with antibodies against CD16/32, CD117, Sca-1, CD135 (Flt3), CD34 and CD150. MPP and HSC were sorted using the gates shown. (C). Gating strategy used to isolate CMP. (D). Splenic cells were separated into a Ter119+ and Ter119- fraction by magnetic bead-based selection. The Ter119- fraction was used to sort B cells, Myeloid cells and Dendritic Cells as shown. The Ter119+ fraction was used to sort Erythroblasts as shown.
Fig S.2. Quality controls of CMP barcode data (related to Fig 1)
(A). CMPs from a single transduction batch were transferred into 2-4 mice per experiment. The barcode repertoire observed in technical replicates of CMP-derived myeloid cells is depicted, both within and between mice. Plots representative of the quality controls for accuracy of barcode sampling (comparison of barcodes seen in technical replicates of a mouse, left panel) and of the inferred chance of random sharing of barcodes between different progenitors in one mouse (comparison of barcodes observed in two mice that received CMPs from the same transduction batch, right panel). (B). Quantification of average repeat usage of barcodes. The proportion of barcodes shared between mice (m1 & m2) or present in only one of the mice (m1 or m2) from the same transduction batch is averaged over 3 different experiments at day 6 (left panel) or 2 experiments at day 14 (right panel). (C). Possible contamination of CMP by LSK cells. The first and the second panel show the definition of the CMP gate in order to exclude LSK, and later MEPs and GMPs. The third panel shows the position of LSK cells when not excluded by the gate in the first panel, revealing a potential source of contamination at the border between the LS-K and LSK gates as indicated by the red arrow. One representative experiment shown. (D). Based on their relative output to the different cell types analyzed, barcode-labeled CMPs were assigned to a class of (lineage biased) progenitor using a hand-tailored classifier (see methods). The effect of different thresholds for lineage bias classification is depicted for the proportion of CMPs assigned to each class, for output observed at day 6. (E). Same as D for CMPs output observed at day 14. (F). Quantitative contribution of the classes to the myeloid lineage (left panel) and erythroid lineage (right panel) for different thresholds (x-axis) for CMP output observed at day 6 (mean)/ (G). Same as (F) for CMP output observed at day 14. ‘0’, ‘1’, and ‘2.5’ refer to the minimal percentage of total reads of a progenitor that is observed within a given cell type in order to classify this progenitor as contributing to this lineage. As an example, a CMP of 98% of the output was in E and 2% was in M would be classified as E biased using the 2.5% classification threshold, but not the 0% or 1% classification thresholds. Note that a large fraction of CMPs produced >99% of its output in either the myeloid or the erythroid lineage. (H). Cumulative read distribution of barcoded CMPs pooled from 4 mice classified as uni-outcome (only producing myeloid cells (M, left panel) or erythroblasts (E, right panel)) versus barcoded CMPs classified as bi-outcome (producing both E and M, M+E, with the E and M read distributions respectively) at day 6. Classification was done with a threshold of 1%. The graph is representative of one experiment and shows that the read distribution of uni-outcome CMPs was similar to that of the bi-outcome CMPs. (I) Same as (H) for day 14. Showing that also at this time point the cumulative read distribution of uni-outcome CMPs was similar to that of bi-outcome CMPs. Together with sampling controls as shown in panel A, these data indicate that the frequent observation of uni-outcome CMPs is not explained by the low cellular output of these cells.
Fig S.3. Heatmaps of CMP contribution to different cell types for individual mice (related to Fig 1).
(columns) of each mouse shown in Fig.1.E. Arcsin transformed data clustered by complete linkage using Euclidean distances.
Fig S.4. Dendritic cell production by CMPs, bone marrow output and effect of different doses of CMPs at day 14 (related to Fig 1).
(A). Left: Proportion of CMPs classified as producing the indicated combinations of M (Myeloid cells), E (Erythroblasts) or D (Dendritic cells) at day 14 post transfer, using a 1% classification threshold. (A). Right: Quantitative contribution of the different classes of CMPs to each lineage at day 14 post transfer. (B). Cumulative read distribution of barcoded CMPs pooled from 4 mice classified as only producing dendritic cells versus classified as producing dendritic cells plus at least one other cell type at day 14. Classification was done with a threshold of 1%. The graph shows that the cumulative read distribution of uni-outcome CMPs was similar to the bi-outcome CMPs. (C) The effect of different values of the threshold (t) used for lineage bias classification is shown for the proportion of CMPs assigned to each class, for output recovered at day 14. Same as Fig.S2.F but this time when also using dendritic cells output for classification. (D and E) Analysis of bone marrow erythroblasts (E) and bone marrow myeloid cells (M) produced by CMPs at day 14. (D) Proportion of CMPs classified as producing E or M using different thresholds (mean and sd between 4 mice). (E) Quantitative analysis of contribution of classes from (D) to each lineage for different thresholds, left: myeloid output, right: erythroblasts output. (F and G) Analysis of erythroblasts (E) and myeloid cells (M) from the spleen produced at day 14 after transplantation of different doses of barcode labeled CMPs (low dose=6500 total CMPs (2600 barcodes-labeled CMPs) injected per mouse, medium dose=32500 total CMPs (13000 barcodes-labeled CMPs) injected per mouse, similar dose to that in Figure 1). (F) Proportions of CMPs classified as in (D) (mean and sd between 4 mice). (G) Quantitative output of the classes from (F) to each lineage.
Fig S.5. Quality controls of HSC data (related to Fig 2).
(A). As in Fig.S.2, plots are representative of the quality controls for accuracy of barcode sampling (left panel) and of the inferred chance of having different progenitors with the same barcode in one mouse (repeat use), by comparing barcode content in two mice that received HSCs from the same transduction batch (right panel). (B). The effect of different values of the threshold (t) used for lineage bias classification is shown for the proportion of HSCs assigned to each class, for output recovered at day 27. (C) Quantitative contribution of the classes to the myeloid lineage (left panel) and erythroid lineage (right panel) for different thresholds (mean) for HSC ouput at day 27. Here the classification of HSCs was performed using either only erythroblasts and myeloid cells output, or using output for all cell types analyzed (erythroblast, myeloid, dendritic and B cells). The results shown in (C) are from the latter classification. The color-coding indicates the correspondence between the two classifications: shade of red equivalent to the M+E class, shade of green to the M class, shade of blue to the E class. (D) Cumulative read distribution of barcoded HSCs pooled from 4 mice classified as uni-outcome (only producing myeloid cells (M, right panel) or erythroblasts (E, left panel)) versus the output in myeloid cells or erythroblasts of the barcoded HSCs producing more than one cell type at day 27. Classification was done with a threshold of 1%. The graph shows that the cumulative read distribution of uni-outcome HSCs is largely different from the rest of HSCs.
Fig S.6. Heatmaps of HSC contribution to different cell types for individual mice (related to Fig 2).
Each heatmap represents the contribution of individual HSCs (rows) to the indicated cell types (columns) of each mouse shown in Fig.2. Arcsin transformed data clustered by complete linkage using Euclidean distances. (A). Day 27 after transplantation. (B). Day 42 after transplantation.
Fig S.7. Quality controls of MPP data (related to Fig.3)
(A). As in Fig.S.2, plots are representative of the quality controls for accuracy of barcode sampling (left panel) and of the inferred chance of having different progenitors with the same barcode in one mouse (repeat use), by comparing barcode content in two mice that received MPPs from the same transduction batch (right panel). (B). The effect of different value of the threshold (t) used for lineage bias classification is shown for the proportion of MPPs assigned to each class, for output recovered at day 14. (C). Quantitative contribution of the classes to the myeloid lineage (left panel) and erythroid lineage (right panel) for different thresholds (mean) for MPPs at day 14 Here the classification of MPPs was performed using either only erythroblasts and myeloid cells output or output for all cell types analyzed (erythroblast, myeloid, dendritic and B cells). The results shown in (C) are from the latter classification. Color-coding indicates the correspondence between the two classifications: shade
of red equivalent to the M+E class, shade of green to the M class, shade of blue to the E class. (D) Cumulative read distribution of barcoded MPPs pooled from 4 mice classified as producing myeloid cells but not erythroblast (M, right panel) or erythroblasts but not myeloid cells (E, left panel)) versus reads in myeloid cells or erythroblasts of the barcoded MPPs producing both erythroblasts and myeloid cells (M+E). Classification was done with a threshold of 1% irrespective of the other cell types produced. The cumulative read distribution of uni-outcome MPPs is in the same order of magnitude as that of the M+E MPPs.
Fig S.8. Heatmaps of MPP contribution to different cell types for individual mice (related to Fig 3).
Each heatmap represents the contribution of individual MPPs (rows) to the indicated cell types (columns) of each mouse shown in Fig.3, day 14 after transplantation. Arcsin transformed data clustered by complete linkage using Euclidean distances.
B
D
B Cells Dendritic Cells Myeloid Cells Erythroblastsbarcoded stem cells
or progenitors 5gy
Myeloid cells (CD11b+) Dendritic cells (CD11c+) Erythroblasts (Ter119+) B cells (CD19+)
Split in two technical replicates PCR and deep sequence analysis
A
C
CMP
MPP
HSC
Figure S1
autofluorescence autofluorescence GFP GFP GFP!%" !%' !%# !%( !%$ !%) !%* !%+ & 6787,29:;1<=0->2>:,:9? < @ !%" !%' !%# !%( !%$ !%) !%* !%+ & 6787,29:;1<=0->2>:,:9? < B !%" !%' !%# !%( !%$ !%) !%* !%+ & 6787,29:;1<=0->2>:,:9? < @ !%" !%' !%# !%( !%$ !%) !%* !%+ & 6787,29:;1<=0->2>:,:9? < B
B
D
A
C
m1 m2 m1 & m2 m1 m2 m1 & m2 1% 2.6% LS-K LSK LS-K LSKE
F
G
Figure S2
!" #!" $!" %!" &!" '!" (!" )!" *!" +!" ," -" ,.-" !"#$"%&'(" !" #" $/'" !" #!" $!" %!" &!" '!" (!" )" *" )+*" !"#$""%&'(" !" #" $,'" 0 1 2 3 4 5 0 1 2 3 4 5Day 14_mouse 2_Myeloid_a (log(reads+1)) D ay 1 4_ m ou se 2 _M ye lo id _b (lo g( re ad s+ 1) ) 0 1 2 3 4 5 0 1 2 3 4 5
Day 14_mouse 2_Myeloid_a (log(reads+1)) D ay 1 4_ m ou se 4 _M ye lo id _a (lo g( re ad s+ 1) ) !"#$ %&#$ %"#$ '&#$ '"#$ (&&#$ &$ ($ )*"$ !"#$%&$%"'#(%)*+$,#("%#"-" +,-$ +$ !"# $!"# %!"# &!"# '!"# (!"# )!"# *!"# +!"# ,!"# $!!"# !# $# %-(# !"#$%&$%"'#(%)*+$,#("%#"-" ./0# 0# !"# $!"# %!"# &!"# '!"# (!"# )!"# *!"# +!"# ,!"# $!!"# !# $# %-(# !"#$%&$%"'#(%)*+$,#("%#"-" ./0# 0# .# !"# $!"# %!"# &!"# '!"# (!"# )!"# *!"# +!"# ,!"# $!!"# !# $# %-(# !"#$%&$%"'#(%)*+$,#("%#"-" ./0# 0# .#
H
I
dendr itic cells er ythrob lasts m yeloid cells 59 58 764 61 60 54 63 57 62 56 52 54 48 51 49 50 46 55 53 647 37 29 35 15 44 24 20 11 30 12 23 134 28 41 25 18 45 31 38 40 43 13 22 26 10 32 42 16 17 39 927 214 19 33 836 21 m yeloid cells er ythrob lasts dendr itic cells 42 3 31 23 33 44 8 43 46 45 47 48 53 51 57 49 52 54 1 50 56 55 7 13 17 9 36 19 14 40 38 2 32 5 28 4 22 26 41 11 15 37 12 25 27 39 20 24 10 16 18 21 35 29 30 6 34
Figure S3
0 0.03 1.5 81% % contribution per cell typem yeloid cells dendr itic cells er ythrob lasts 3 42 43 40 6 47 45 46 15 16 4 7 18 27 51 2 9 35 50 53 11 52 48 41 44 39 1 12 62 65 58 63 49 60 64 54 55 57 56 59 61 30 13 38 8 26 5 32 23 17 22 37 25 19 34 14 10 33 24 20 31 21 28 29 36 er ythrob lasts m yeloid cells dendr itic cells 20 43 39 57 829 93 102 100 18 104 103 15 105 89 11 97 99 94 96 101 92 595 10 91 98 90 75 72 384 86 74 22 17 63 71 70 716 61 78 67 468 88 79 69 64 62 21 83 87 81 77 23 82 12 76 66 80 65 85 73 13 37 40 38 251 59 55 50 26 632 54 52 48 58 49 41 25 36 60 35 131 44 27 14 28 42 30 24 53 46 47 33 45 919 56 34 Erythroblasts
Myeloid cells Dendritic cells Dendritic cells Erythroblasts Myeloid cells
Erythroblasts
A
Figure S4
!"# $!"# %!"# &!"# '!"# (!"# )!"# *!"# +!"# ,!"# $!!"# -.# /# 0# !"#$%&$%"'#(%)*+$,#("%#"-*(./0." 01-1/# 01/# -1/# -10# /# 0# -# !" #" $!" $#" %!" %#" &!" &#" '" (" )" '*(" '*)" (*)" (*'*)" !"#$"%&'" +,!" +,$" +,%-#"C
D M E D+M D+E M+E M+D+E 16% 20% 18% 9% 17% 15% 5%D
!" #!" $!" %!" &!" '!" (!" )!" *!" +" ," +-," !"#$"%&'(" !" #" $.'" !"# $!"# %!"# &!"# '!"# (!!"# !# (# $)*# !"#$%&$%"'#(%)*+$,#(" +,-# +# !"# $!"# %!"# &!"# '!"# (!!"# !# (# $)*# !"#$%&$%"'#(%)*+$,#(" +,-# -#E
!" #!" $!" %!" &!" '!" (!" )!" *!" +!" ," -" ,.-" !"#$"%&'(" /01" 234562" !"# $!"# %!"# &!"# '!"# (!"# )!"# *!"# +!"# ,!"# $!!"# -./# 012340# !"#$%&$%"'#(%)*+$,#(" 567# 5# !"# $!"# %!"# &!"# '!"# (!"# )!"# *!"# +!"# ,!"# $!!"# -./# 012340# !"#$%&$%"'#(%)*+$,#(" 567# 7#F
G
ï!" " ! # $ % & "'! "'# "'$ "'% "'& "'( "') "'* "'+ ! ,-.!"/012345 6787,29:;1<=0->2>:,:9? < < @6 @6A2B-9C10<D1,,<9?E1B
ï! " ! # $ " "%& "%! "%' "%# "%( "%$ "%) "%* "%+ & ,-.&"/012345 6787,29:;1<=0->2>:,:9? < < @ @A2B-9C10<D1,,<9?E1 " ! # $ " "%& "%! "%' "%# "%( "%$ "%) "%* "%+ & ,-.&"/012345 6787,29:;1<=0->2>:,:9? < < F FA2B-9C10<D1,,<9?E1 !"# $!"# %!"# &!"# '!"# (!"# )!"# *!"# +!"# ,!"# $!!"# !# $# %-(# !"#$%&$%"'#(%)*+$,#("%#"-" " ./0/1# 1/./2/0#
B
C
A
0 1 2 3 4 5 6 0 1 2 3 4 5 6Day 27_mouse 2_Myeloid_a (log(reads+1)) D ay 2 7_ m ou se 2 _M ye lo id _b (lo g( re ad s+ 1) )
Figure S5
0 2 4 6 0 1 2 3 4 5 6 D ay 2 7_ m ou se 3 _M ye lo id _a (lo g( re ad s+ 1) )Day 27_mouse 2_Myeloid_a (log(reads+1))
D
!" #!" $!" %!" &!" '!" (!" )!" *" +" *,+" !"#$"%&'" -.!" -.#" -.$/'" !"# $!"# %!"# &!"# '!"# (!"# )!"# *!"# +!"# ,!"# $!!"# !# $# %-(# !"#$%&$%"'#(%)*+$,#("%#"-" " ./0/1# 1/./2/0# M+E+D M+E+B+D M+E+D M+E+B+DB cells er ythrob lasts m yeloid cells dendr itic cells 14 18 13 2 4 17 1 20 11 10 6 12 8 5 21 22 23 26 19 15 24 25 16 7 B cells er ythrob lasts dendr itic cells m yeloid cells 21 17 31 15 20 6 26 23 27 29 22 7 4 11 30 25 28 10 12 24 16 8 18 er ythrob lasts dendr
itic cells B cells
m yeloid cells 2 31 30 4 13 21 1 23 18 16 28 9 15 24 14 10 25 27 6 17 12 19 3 5 8 22 26 11 7
Figure S6
0 0.03 1.5 81% % contribution per cell typem yeloid cells dendr itic cells er ythrob lasts B cells 19 1 10 18 5 8 21 23 4 9 2 13 22 28 27 12 7 15 17 3 24 6 16 20 25 26 Erythroblasts
Myeloid cells Dendritic cells B cells
Erythroblasts
Erythroblasts
Erythroblasts B cells
B cells Myeloid cells B cells Myeloid cells
Myeloid cells Dendritic cells Dendritic cells Dendritic cells
A
B
er ythrob lasts dendritic cells B cells
m yeloid cells 21 2 3 28 14 8 11 16 13 26 15 4 22 17 19 27 23 9 25 12 5 20 18 7 6 1 B cells er ythrob lasts dendr itic cells m yeloid cells 11 5 9 3 22 10 18 2 13 21 19 14 20 1 16 17 23 12 6 8 4 7 15 0 0.03 1.5 81% % contribution per cell type
ï! " ! # $ " "%& "%! "%' "%# "%( "%$ "%) "%* "%+ & ,-.&"/012345 6787,29:;1<=0->2>:,:9? < < @ @AB ï! " ! # $ " "%& "%! "%' "%# "%( "%$ "%) "%* "%+ & ,-.&"/012345 6787,29:;1<=0->2>:,:9? < < B @AB
B
C
A
Figure S7
0 1 2 3 4 5 6 0 1 2 3 4 5 6Day 14_mouse 2_DC_a (log(reads+1)) D ay 1 4_ m ou se 2 _D C _b (lo g( re ad s+ 1) ) 0 1 2 3 4 5 6 0 1 2 3 4 5 6
Day 14_mouse 2_DC_a (log(reads+1)) D ay 1 4_ m ou se 4 _D C _a (lo g( re ad s+ 1) ) 0 10 20 30 40 50 60 70 M E M+E % of MPP t=0 t=1 t=2.5 !"# $!"# %!"# &!"# '!"# (!"# )!"# *!"# +!"# ,!"# $!!"# !# $# %-(# !"#$%&$%"'#(%)*+$,#("%#"-" " ./0/1# 1/0# 1/./2/0# 2/./1# 1/.# 1# !"# $!"# %!"# &!"# '!"# (!"# )!"# *!"# +!"# ,!"# $!!"# !# $# %-(# !"#$%&$%"'#(%)*+$,#("%#"-" " ./0/1# 1/0# 1/./2/0# 2/./0# ./0# 0# M+E+D M+E M+E+B+D M+B+D M+D M M+E+D M+E M+E+B+D E+B+D E+D E
D
dendr
itic cells B cells
er ythrob lasts m yeloid cells 93 20 46 27 77 85 75 50 110 70 113 28 116 76 64 86 87 163 56 21 58 109 60 90 91 99 81 54 98 101 103 59 102 111 88 79 112 29 83 108 107 97 84 95 96 115 106 78 80 89 62 73 72 69 82 93 94 38 44 65 52 67 68 66 24 92 61 243 42 104 57 48 55 18 53 49 119 100 114 37 117 118 105 71 74 120 121 45 36 16 17 14 47 51 41 40 39 22 31 15 433 19 34 35 13 11 712 26 23 30 810 625 32 5 dendr
itic cells B cells
er ythrob lasts m yeloid cells 65 59 61 62 60 113 111 55 31 39 33 82 78 75 64 79 103 56 80 32 98 74 91 76 67 66 84 69 70 112 108 71 107 117 106 34 46 88 886 99 42 114 110 37 105 115 104 109 116 57 19 38 50 119 118 27 29 26 97 53 94 92 83 95 101 100 45 77 47 68 89 72 87 711 12 23 58 413 541 52 30 21 25 16 317 15 43 928 54 22 20 44 36 63 114 26 10 49 96 102 40 90 85 73 35 81 24 18 93 51 48 B cells er ythrob lasts m yeloid cells dendr itic cells 57 31 46 56 49 48 54 51 352 78 59 23 15 28 212 13 111 112 30 8110 109 45 113 119 114 97 70 117 121 120 122 17 36 34 55 65 29 37 116 118 20 93 22 10 414 95 118 35 47 25 26 81 66 71 87 74 85 64 53 50 105 67 77 32 99 75 95 33 73 84 89 98 91 100 61 63 68 72 108 106 69 103 88 94 115 42 76 19 40 639 79 60 90 92 83 107 82 96 102 104 58 86 27 44 43 21 11 101 41 80 62 38 716 24 B cells dendr itic cells er ythrob lasts m yeloid cells 38 37 24 33 32 28 39 36 29 34 35 27 14 55 350 112 107 92 81 70 56 47 52 22 31 25 10 20 2124 19 123 125 812 13 11 15 518 16 41 26 41 84 115 76 46 121 65 105 117 108 77 74 61 71 118 111 82 114 120 42 80 90 66 110 100 88 91 85 73 119 79 44 68 60 93 94 72 95 98 109 89 122 63 97 67 86 102 116 101 45 87 75 106 9103 104 7126 21 54 623 17 40 30 64 78 99 57 62 83 49 96 48 51 43 59 53 113 69 58
Figure S8
0 0.03 1.5 81% % contribution per cell typeErythroblasts Myeloid cells
Dendritic cells B cells Erythroblasts Erythroblasts Erythroblasts B cells
B cells Myeloid cells B cells Myeloid cells
Myeloid cells
Dendritic cells
Dendritic cells
Supplementary Tables Progenitor type CMP (D6) CMP (D14) Cell population E M E M DC mean 23542 4516 118934 5110 2009 sd 36494 6490 45909 2621 834 Progenitor type MPP (D14) Cell population E M DC B mean 128533 31936 4147 10095 sd 34315 18021 812 6439 Progenitor type HSC (D27) HSC (D42) Cell population E M DC B E M DC B mean 124274 4042 5803 24359 576096 9030 14014 29444 sd 37079 706 1591 39202 175907 4911 8109 16792
Supplementary Table 1 : Number of cells sorted per progenitor and per cell population, mean and sd between mice. Days between brackets indicate day after transplantation