Correcting for serial dependence
in studies of respiratory dynamics
The MIT Faculty has made this article openly available.
Please share
how this access benefits you. Your story matters.
Citation
Gong, J. J., K. F. K. Wong, J. F. Cotten, K. Solt, and E. N. Brown.
“Correcting for Serial Dependence in Studies of Respiratory
Dynamics.” 2011 Annual International Conference of the IEEE
Engineering in Medicine and Biology Society (n.d.).
As Published
http://dx.doi.org/10.1109/IEMBS.2011.6090493
Publisher
Institute of Electrical and Electronics Engineers (IEEE)
Version
Author's final manuscript
Citable link
http://hdl.handle.net/1721.1/86329
Terms of Use
Creative Commons Attribution-Noncommercial-Share Alike
Correcting for Serial Dependence in Studies of Respiratory
Dynamics
Jen J. Gong,
A student at Harvard College
Kin Foon Kevin Wong,
Neuroscience Statistics Research Laboratory, and Massachusetts General Hospital, Boston, MA 02114 USA
Joseph F. Cotten,
Harvard Medical School and Massachusetts General Hospital, Boston, MA 02114 USA
Ken Solt, and
Harvard Medical School and Massachusetts General Hospital, Boston, MA 02114 USA
Emery N. Brown
Neuroscience Statistics Research Laboratory, Harvard Medical School, Massachusetts General Hospital, Boston, MA 02114 USA, and also with the Harvard-Massachusetts Institute of
Technology (MIT) Division of Health Science and Technology and the Department of Brain and Cognitive Sciences, MIT, Cambridge, MA 02139 USA
Jen J. Gong: [email protected]; Kin Foon Kevin Wong: [email protected]; Joseph F. Cotten: [email protected]; Ken Solt: [email protected]; Emery N. Brown: [email protected]
Abstract
Understanding the physiological impact of drug treatments on patients is important in assessing their performance and determining possible side effects. While this effect might be best determined in individual subjects, conventional methods assess treatment performance by averaging a physiological measure of interest before and after drug administration for n subjects. Summarizing large numbers of time-series observations in two means for each subject in this way results in significant information loss. Treatment effect can instead be analyzed in individual subjects. Because serial dependence of observations from the same animal must then be considered, methods that assume independence of observations, such as the t-test and z-test, cannot be used. We address this issue in the case of respiratory data collected from anesthetized rats that were injected with a dopamine agonist. In order to accurately assess treatment effect in time-series data, we begin by formulating a method of conditional likelihood maximization to estimate the parameters of a first-order autoregressive (AR) process. We show that treatment effect of a dopamine agonist can be determined while incorporating serial effect into the analysis. In addition, while maximum likelihood estimators of a large sample with independent
observations may converge to an asymptotically normal distribution, this result of large sample theory may not hold when observations are serially dependent. In this case, a parametric bootstrap comparison can be used to approximate an appropriate measure of uncertainty.
I. INTRODUCTION
In many respiratory experiments, treatment effect is quantified after taking extensive
NIH Public Access
Author Manuscript
Conf Proc IEEE Eng Med Biol Soc
. Author manuscript; available in PMC 2013 September 09.Published in final edited form as:
Conf Proc IEEE Eng Med Biol Soc. 2011 ; 2011: 1721–1724. doi:10.1109/IEMBS.2011.6090493.
NIH-PA Author Manuscript
NIH-PA Author Manuscript
in only n data points in the analysis. Because these n data points are the averages of detailed time-series measurements made before and after the drug administration in each animal, this method results in substantial information loss. This suggests that it should be possible to preserve the information content of the original data by making an inference about the effects of the drug in each animal separately, provided the serial dependence in the recordings of the respiratory variable can be taken into account. This paper presents one approach to addressing serial dependence between observations in constructing a test for treatment effect.
Previous work has developed methods such as three-dimensional phase-space reconstruction to incorporate nonlinearity, which is often observed in heart rate variability and respiratory movements, into time-series analysis [1]. However, while these methods can provide insight into the data, they do not necessarily lend themselves well to assessing the statistical significance of the difference in a physiological measure between two particular time intervals. To address this, this paper sets up the framework for a first-order autoregressive process to demonstrate the use of conditional maximum likelihood and bootstrap methods, although the same method can be used for higher order models that may characterize the data more accurately.
The standard method for assessing treatment effect in n animals is to conduct a z-test or t-test for the difference between means. These t-tests, however, assume independence between observations. Because cardiac and breathing rate observations in the same subject are serially correlated, this assumption of independence is violated (Figs. 1 and 2). Therefore, conventional means of hypothesis testing cannot be used. In addition, construction of 95% confidence intervals for the mean difference using the standard error of the considered data will not accurately represent the uncertainty in the estimate because of the assumption of independent observations.
Modeling time-series data with an autoregressive (AR) process, however, allows us to use conditional likelihood methods to estimate the parameters and account for the serial dependence between observations. Thus, a standard hypothesis test can be modified to test for treatment effect in serially correlated data by replacing the typically used sample mean and standard error with the analogous maximum likelihood estimates and standard deviations of these estimates, as approximated by the inverse of the observed Fisher information matrix [3]. Similar methods have been used in constructing state-space models based on Kalman filtering to analyze optical imaging data, although the full likelihood function is used instead of the conditional one [4]. The observed Fisher information gives a reliable estimate for the variances of the parameters under the assumption that when the sample size is large, the conditional likelihood estimates behave according to the distributions they asymptotically approach as the sample size goes to infinity. These
asymptotic distributions are Gaussian with variances given by the inverse Fisher information matrix [3]. This theory assumes that the data have a large number of independent
observations. In the case of serially correlated data, however, there may be a substantial amount of information loss because the observations depend on each other. As a consequence, the approximate variances of the maximum likelihood estimates from the observed Fisher information matrix may not accurately describe the actual variance in the parameters. To better approximate this uncertainty, parametric bootstrap methods can be used to generate a sample of values for the maximum likelihood estimate of the parameter μ
[5].
By addressing these two issues in the context of assessing the difference in mean breathing rate before and after the injection of a dopamine agonist in two rats, we propose a correction
NIH-PA Author Manuscript
NIH-PA Author Manuscript
for serial dependence on a standard hypothesis test that allows us to maintain the information content of the time-series data for each animal.
II. METHODS
A. Experimental Procedure
Two rats were maintained for 40 minutes under stable general anesthesia using 1.4% isoflurane. Respiratory rate (BPM) and tidal volume were continuously measured. After 40 minutes, a dopamine agonist was injected to assess its effect on respiratory rate.
B. Experimental Data
To investigate whether or not injection of a dopamine agonist resulted in a significant change in mean breathing rate, the BPM data from before the administration of the drug was compared to BPM data from after the administration of the drug for two rats. The raw breathing rate data, as shown in Figures 1 and 2, can be seen to start at a baseline level and transition to a higher level, where it eventually flattens out. Missing data values were removed from all data sets. The conditional log-likelihood is
(1)
C. Conditional Likelihood Estimation
A stationary AR(1) model with mean μ, |φ| < 1, and white noise εt follows
(2)
The white noise εt is assumed to be independently and identically Gaussian distributed for
all t, with mean 0 and variance . We are interested in finding values for the parameters that maximize the likelihood of the data.
Rather than maximizing the full likelihood, which is less computationally tractable, we greatly simplify the likelihood calculations by conditioning on the first observation, x1. If
we let x = (x1, …, xT), then we have
(3)
Maximizing this with respect to μ, φ, and , we find that the maximum likelihood estimates
of the three parameters are:
(4)
NIH-PA Author Manuscript
NIH-PA Author Manuscript
(5)
(6)
While the conditional maximum likelihood estimates of μ̂ and φ̂ are independent of , they
are not independent of each other. To find these estimates, we apply a cyclic descent algorithm. These estimates convergence after a few iterations, and the final values are used to calculate [6].
D. Variance of estimated parameters
The observed Fisher information matrix is computed from the second derivatives of the conditional log-likelihood with respect to μ, φ, and . The variance for each parameter is
obtained from the inverse of this matrix and used to construct 95% confidence intervals for the parameters.
The observed Fisher information matrix is
(7)
The variances of the parameter estimates are obtained from the elements of the matrix [I(θ̂)]−1.
E. Hypothesis Test
Using these. conditional maximum likelihood estimates, we can conduct a hypothesis test of the difference in means between two sets of data. From our AR(1) model, we know that xt −
μ − φ(xt−1 − μ) = εt, where the εt are independently and identically distributed according to a
normal distribution with mean 0 and variance for all t. For each of the two data sets we are comparing, we find the maximum likelihood estimate of μ. In addition, we can
approximate the values of and , the variances of these estimated means, using the observed Fisher information matrix (7). Thus, we can construct the test statistic
(8)
To analyze the difference in mean breathing rate before and after the injection of the dopamine agonist, as illustrated in Figures 3 and 4, we conduct a test of the null hypothesis
H0 : μbefore = μafter against the alternative H1 : μbefore ≠ μafter for the two animals.
F. Bootstrap Analysis
From the observed Fisher information matrix, it is easy to show that
NIH-PA Author Manuscript
NIH-PA Author Manuscript
(9)
From this expression for the variance of the estimated mean, it can be seen that it takes a form analogous to that of the variance of the mean in a sample with independent observations
(10)
where n is the number of observations and σ2 is the variance of the population. Thus, the
denominator of the variance of the mean for serially correlated data has what can be seen to be approximately (T − 1)(1 − φ)2 independent observations.
For data for which this denominator is small (when there is large serial correlation between observations), large sample theory may not provide a suitable estimate of the parameter variance. Therefore, this estimate of the variance of μ̂ may not be an accurate measure of the
uncertainty and will give an incorrect z-statistic. To find a more accurate estimate of the variance of the estimated mean (σ̂μ̂), we use a parametric bootstrap comparison [5]. Using
our original data and conditional maximum likelihood estimates derived previously, we simulate multiple bootstrap samples and find the conditional maximum likelihood estimates of the parameters for each of these samples.
The bootstrap algorithm is as follows: A. For t = 2, …, T
1. Draw from .
2. Compute .
B. Given , compute θ̂* by maximizing l(θ|x*).
C. Repeat A and B 200 times.
Using this process, we obtained a set of 200 values of μ̂. Taking the variance of the
bootstrap sample gives a bootstrap estimate of σ̂μ̂. The values were used to calculate the
modified z-statistic for the data from both animals (Table 2).
III. RESULTS
A. Convergence of maximum likelihood estimates
Convergence of conditional maximum likelihood estimation of parameters for all but one of the considered data sets occurred in fewer than 20 iterations. Convergence time for each (μ̂, φ̂) pair was defined as the number of iterations it took before both parameters reached a
value less than 0.00001 from their values in the previous iteration. B. Maximum likelihood estimates and standard deviations
Maximum likelihood estimates of the parameters and their variances for the breathing rate data before and after the dopamine agonist injection are shown in Table 1. These estimates were calculated using a cyclic descent algorithm, and the variances were calculated from the observed Fisher information matrix.
NIH-PA Author Manuscript
NIH-PA Author Manuscript
C. Hypothesis tests
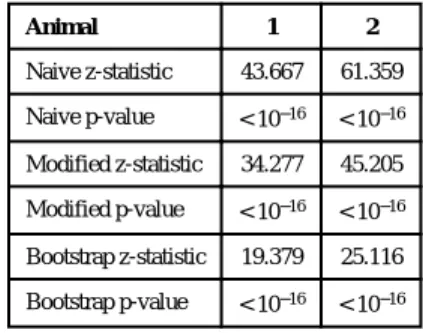
Hypothesis tests for two animals were conducted to examine the statistical significance of the difference in mean breathing rate before and after the injection of the dopamine agonist. Under the null hypothesis, the means before and after the injection would be the same, and therefore, the difference between the two would equal zero. For each animal, three versions of this hypothesis test were performed. The first, which we call the naive test, was done without accounting for the serial correlation between observations. The second, called the modified test, accounted for serial correlation and used the conditional maximum likelihood estimates and the Fisher information matrix to calculate the z-statistic. The third test also used the conditional maximum likelihood estimates of the parameters, but parametric bootstrap methods were used to estimate the variance of μ̂ instead of the Fisher information
matrix. The results of the hypothesis tests are given in Table 1.
Although all of the p-values were found to be significant (< 10−16), there is a noticeable difference in the z-statistics for the three methods considered. The lower magnitude of the bootstrap z-statistic compared to the modified one agrees with our stated logic; because there are a large number of correlated observations, large sample theory need not hold. Therefore, the inverse of the Fisher information matrix may not give an accurate measure of the uncertainty in the parameters.
IV. DISCUSSION & CONCLUSIONS
We have provided a two step correction for the problem of conducting a simple hypothesis test of the difference in mean respiratory rate before and after administration of a dopamine agonist. To correct for the serial dependence in each set of measurements, we first fit separate autoregressive models to the BPM data before and after administration of the drug treatment using a cyclic descent procedure to maximize the conditional maximum likelihood of each data set. Second, we used a parametric bootstrap to compute the uncertainty in the parameters before and after the drug treatment to correct for the possible inaccuracies in the parameter variance estimates based on the observed Fisher information. The bootstrap estimates of the parameter variances are used to conduct the hypothesis test comparing the means. The two step procedure provided a correction for the naive hypothesis test which assumes that both sets of data are independent. Our approach makes it possible to perform within subject hypothesis testing instead of having a substantial loss of power because each subject contributes a only a single pair of observations to a group hypothesis test.
Our approach suggests several important extensions. These include use of a higher order autoregressive model to characterize the data better and use of a non-parametric bootstrap procedure to further help compensate for lack of fit. In addition, the non-constant mean respiratory rate can be accounted for. These extensions will be considered when applying these methods to further analyze the respiratory data examined in this study.
Acknowledgments
This research was supported by NIH grants DP1-OD003646, K08-GM094394 and K08-GM083216.
References
1. Myers KL, Brockwell AE, Eddy WF. State-space models for optical imaging. Statistics in Medicine. 2007; 26(21):3862–3874. [PubMed: 17566966]
2. Box, GEP.; Jenkins, GM.; Reinsel, GC. Time-Series Analysis: Forecasting and Control. 4. Wiley and Son; New York: 2008.
NIH-PA Author Manuscript
NIH-PA Author Manuscript
3. Pawitan, Y. In All Likelihood: Statistical Modelling and Inference Using Likelihoods. Oxford Press; Oxford: 2001.
4. Hoyer D, Schmidt K, Bauer R, Zweiner U, Kohler M, Luthke B, Eiselt M. Nonlinear analysis of heart rate and respiratory dynamics. Engineering in Medicine and Biology Magazine, IEEE. 1997; 16(1):31–39.
5. Efron, B.; Tibshirani, R. An Introduction to the Bootstrap. Chapman & Hall; 1993.
6. Garkavi AL. Method of cyclic descent in the problem of best approximation. Mathematical Notes. 1980; 27(4):270–274.
NIH-PA Author Manuscript
NIH-PA Author Manuscript
Fig. 1.
Breathing rate (BPM) of rat 1. Injections of saline and dopamine agonist marked by left and right dotted lines, respectively.
NIH-PA Author Manuscript
NIH-PA Author Manuscript
Fig. 2.
Breathing rate (BPM) of rat 2. Injections of saline and dopamine agonist marked by left and right dotted lines, respectively.
NIH-PA Author Manuscript
NIH-PA Author Manuscript
Fig. 3.
Comparing mean breathing rate (BPM) before and after injection of dopamine agonist (marked by dotted line) in rat 1
NIH-PA Author Manuscript
NIH-PA Author Manuscript
Fig. 4.
Comparing mean breathing rate (BPM) before and after injection of dopamine agonist (marked by dotted line) in rat 2
NIH-PA Author Manuscript
NIH-PA Author Manuscript
NIH-PA Author Manuscript
NIH-PA Author Manuscript
NIH-PA Author Manuscript
TABLE I
Conditional Maximum Likelihood Estimates
Animal μ ̂ Var (μ ̂ ) φ ̂ Var (φ ̂ ) 1 Pre-DA 76.983 0.52007 0.8267 0.00179 2.4394 0.075806 Post-DA 114.52 3.1179 0.6441 0.0013303 171 135.06 2 Pre-DA 72.231 0.78295 0.7997 0.0044509 4.3426 0.26561 Post-DA 102.31 0.71939 0.59669 0.0013932 53.826 12.597
NIH-PA Author Manuscript
NIH-PA Author Manuscript
NIH-PA Author Manuscript
TABLE II
Comparing mean breathing rate before and after injection of Dopamine agonist (DA) with H0 : μbefore = μafter,
H1 : μbefore ≠ μafter. Animal 1 2 Naive z-statistic 43.667 61.359 Naive p-value < 10−16 < 10−16 Modified z-statistic 34.277 45.205 Modified p-value < 10−16 < 10−16 Bootstrap z-statistic 19.379 25.116 Bootstrap p-value < 10−16 < 10−16