Publisher’s version / Version de l'éditeur:
Canadian Geotechnical Journal, 8, 2, pp. 170-181, 1971-05
READ THESE TERMS AND CONDITIONS CAREFULLY BEFORE USING THIS WEBSITE.
https://nrc-publications.canada.ca/eng/copyright
Vous avez des questions? Nous pouvons vous aider. Pour communiquer directement avec un auteur, consultez la
première page de la revue dans laquelle son article a été publié afin de trouver ses coordonnées. Si vous n’arrivez pas à les repérer, communiquez avec nous à [email protected].
Questions? Contact the NRC Publications Archive team at
[email protected]. If you wish to email the authors directly, please see the first page of the publication for their contact information.
NRC Publications Archive
Archives des publications du CNRC
This publication could be one of several versions: author’s original, accepted manuscript or the publisher’s version. / La version de cette publication peut être l’une des suivantes : la version prépublication de l’auteur, la version acceptée du manuscrit ou la version de l’éditeur.
Access and use of this website and the material on it are subject to the Terms and Conditions set forth at
Use of ice covers for transportation
Gold, L. W.
https://publications-cnrc.canada.ca/fra/droits
L’accès à ce site Web et l’utilisation de son contenu sont assujettis aux conditions présentées dans le site LISEZ CES CONDITIONS ATTENTIVEMENT AVANT D’UTILISER CE SITE WEB.
NRC Publications Record / Notice d'Archives des publications de CNRC:
https://nrc-publications.canada.ca/eng/view/object/?id=f82531c8-b226-4328-8187-7fea72114ed0 https://publications-cnrc.canada.ca/fra/voir/objet/?id=f82531c8-b226-4328-8187-7fea72114ed0Use of Ice Covers for Transportation'
L. W. GOLDDivision of Building Research, National Research Council of Canada, Ottawa, Canada
Received November 20, 1970
Observations are reported on the failure and use of freshwater ice covers for vehicular traffic. The study showed that good quality ice covers can support loads of up to P = 250 ha,
where P is the total load in pounds and h is the thickness of the ice in inches. Failures were reported, however, for loadings as low as P = 50 hZ. Factors contributing to the failure of covers for loading less than P = 250 h2 were: vehicle speed, thermal stress due to drop in
temperature, and fatigue and quality of the cover. The results are discussed with reference to Westergaard's equations for the maximum stress due to circular loads on an elastic plate resting on an elastic foundation. Information is presented on the elastic and strength properties of ice covers required for theoretical calculations. Experience in the construction and use of ice roads and parking areas is described.
Des observations ont Bti faites sur l'utilisation et l'affaissement des couvertures de glace des lacs et des rivikres pour le trafic des v6hicules. L'6tude d6montre que des couvertures de glace de bonne qualit6 peuvent supporter des charges P = 250 h2, alors que P est le total des charges en livres et h est I'Bpaisseur de la glace en pouces. Les affaissements ont 6t6 rapportts cependant pour des chargements aussi bas que P = 50 hZ. Les facteurs contribuant ?i l'affaisse- ment des couvertures pour les chargements aussi lBgers que P = 250 ha Btaient: la vitesse des v6hicules, la contrainte thermique due ?i une baisse soudaine de tempkrature, la fatigue et la qualit6 de la couverture. Les rBsultats sont analyses en regard des Bquations de Westergaard pour la contrainte maximum due aux charges circulaires sur une plaque Blastique se reposant sur une fondation 6lastique. Des reseignements sont present& sur les propri6tBs d'Blasticit6 et de rksistance des couvertures de glace requises pour des calculs thboriques. L'expBrience et l'usage dans la construction des routes de glace et des aires de stationnement sont dktaillis. Ice covers are used
in
Canada for winter servations of their use. The Division of Building roads and airstrips and to provide a surface Research of the National Research Council of from which struckres, such as bridges, can beerected. Their use for these purposes is based primarily on experience, much of which is un- recorded. It is of importance to develop more generally available guidelines concerning the thickness and quality of ice required to support safely a given load. The challenge posed by this need can be more fully appreciated when it is realized that ice covers are normally at a temperature within 40 centigrade degrees of their melting point, formed in an outdoor, un- controlled environment, and subject to spatial and temporal variations in type, quality, and properties of the ice.
It is not possible to predict with confidence the maximum loads that can be placed safely on ice covers because of their relatively high temperature and the naturally .occurring varia- tions in their characteristics. Probably the best way to establish practical guidelines concern- ing their bearing capacity is through field ob- 'Presented at the 23rd Canadian Geotechnical Con- ference, Banff, Alberta, Nov. 19-20, 1970.
Canada has for several years been accumulat- ing information concerning this experience. Particular attention has been given to the use of ice covers by the pulp and paper industry.
A survey was carried out on failures that occurred during logging operations and the results published (Gold 1960). Additional in- formation has been accumulated on the failure and successful use of freshwater ice covers; this is presented and discussed in this paper.
Theoretical Considerations
An ice cover floating on water can be considered as a plate on an elastic foundation. Field observations and laboratory studies have shown that ice can be assumed to behave elastically for moving loads. The boundary conditions most relevant to the bearing capacity problem are concentrated and distributed loads on an infinite plate, at the edge of a semi- infinite plate, or at the tip of an infinite sector plate. The concentrated load problem is dis- cussed by Wyman (.1950), the uniformly dis- Canadian Geotechnical Journal. 8, 170 (1971)
GOLD: ICE COVERS FOR TRANSPORTATION 171
tributed load by Wyman (1950) and Wester- gaard (1948), the sector plate by Nevel
(1961) and Gold et al. (1958).
It is usually assumed that failure of an ice cover occurs because the ultimate flexural strength of the cover has been exceeded. The sequence of failure varies and depends upon whether the load is moving or stationary, and on the characteristics of cracks and crack patterns.
Assur (1956, 1961
9
and Frankenstein (1963) describe the sequence of failure for concentrated and distributed static loads on a continuous ice cover. The first stage is the formation of radial cracks at the bottom of the sheet associated with the maximum bending moment developed immediately beneath the load. These cracks do not normally cause failure. The second stage is the formation of circumferential cracks at the upper surface of the cover in the general location of the second maximum in the bending moment. These cracks are some distance from the load. At this stage the load is supported by the tips of sector plates formed by the radial cracks. The final stage is usually the formation of a vertical circumferen- tial shear plane immediately adjacent to the loaded surface.Failure can also occur by punching in the immediate vicinity of the load for some types of ice covers (e.g., a large load on a highly cracked cover, with the cracks penetrating
deeply into the cover). This type of failure is usually not considered to be the determining factor for predictive purposes, but does occur inadvertently in practice.
It is reasonable to assume that for loads moving relatively slowly, failure will be re- lated to the stresses associated with the maxi- mum bending moments. Westergaard ( 1948) gives the following expression for the maximum stress at the center of a uniform load applied to an infinite plate over a circular area of radius a.
where U, and U, are the maximum stresses, P is the total load, v is Poisson's ratio, and 1 is
a characteristic length for the plate, given by Eq. 121.
where h is the thickness of the plate, E is Young's modulus, and k is the subgrade reac- tion. Westergaard also gives the following for the maximum stress at the edge of a semi- infinite plate due to a load P applied uniformly over a circular area tangent to the edge (Eq. 131).
1 1 lv
[3] 0.=
lfv
[2.2{4 loga
+
log 12(1 - v2)-
23 + v
These equations provide a suitable basis for h is ice thickness in inches. It can be seen that discussing the information presented in this most of the observations lie between these two
~ a u e r . curves.
I 1
Use and Failure of Ice Covers
In the survey conducted on the failure of ice covers, information was obtained on the load and associated thickness of the ice. The results of the survey are shown in Fig. 1, where log P is plotted against log h. Theoretical and field studies have shown that the bearing capacity of ice covers is approximately propor- tional to the square of their thickness. Figure 1 shows the two curves: P = 50 h2 and P = 1000 h2, where P is the load in pounds and
The survey indicated that many of the failures occurred for ice thicknesses that would normally have been considered safe for the loads that were applied. This can be seen in Fig. 2 in which information is presented on loads placed successfully on covers. Some of the plotted points give recommended practice for companies making extensive use of covers. It can be seen that the region defined by the observations on the successful use of covers overlaps appreciably that defined by the obser- vations of failure.
CANADIAN GEOTECHNICAL JOURNAL. VOL. 8, 1971
1
103 104 105 106
L O A D P . P O U N D S
FIG. 1. Load and thickness of ice associated with observed failures of ice covers.
I I I I I 0 B U L L D O Z E R . T R A C K E D V E H I C L E , T R A C T O R
-
T R U C K H O R S E...
0--
D 0 O D.
I I I I lo4 lo5 L O A D . P O U N D SFTG. 2. Loads and thickness of ice associated with observed successful use of ice covers.
A survey was undertaken with the assistance of the Pulp and Paper Association and four pulp and paper companies to obtain informa- tion on normal use of ice covers. Results of this study are presented in Figs. 3 and 4.
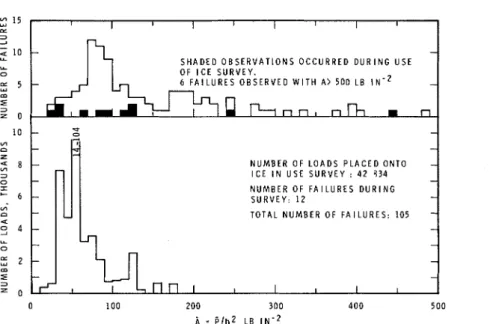
Figure 3 is a plot of the frequency distribu- tion in the average loading, defined by
A
= P/h2, for loads placed in the survey. The average load,P,
was the numerical average ofall loads placed on the same ice cover in periods for which the ice thickness, h, was constant to within 1 in. Shown also is the dis- tribution in loadings for all failures that have been recorded. The failures that occurred in the survey have been suitably identified. The maximum value for A for each period (i.e., A m = Pm/h2, where P, is the maximum load placed on a given cover of thickness h k 1 in.)
GOLD: ICE COVERS FOR TRANSPORTATION I I I I I I I I - S H A D E D O B S E R V A T I O N S O C C U R R E D D U R I N G U S E O F I C E S U R V E Y . 6 F A I L U R E S O B S E R V E D W I T H A) 500 L B I N - ' -
U
k m n I n h m m = - 0-
- --
-
--
N U M B E R O F L O A D S P L A C E D O N T O - I C E I N U S E S U R V E Y : 4 2 8 3 4 - - N U M B E R O F F A I L U R E S D U R I N G-
S U R V E Y : 1 2 - --
T O T A L N U M B E R O F F A I L U R E S : 105-
- --
- --
- - ? - , I, n n
I I I I I I 0 1 0 0 200 3 0 0 4 0 0 5 0 0 A = P / h Z L B I N - 'FIG. 3. Distribution in the loadings observed in survey of use of ice covers and of failures. is plotted against the average loading for the
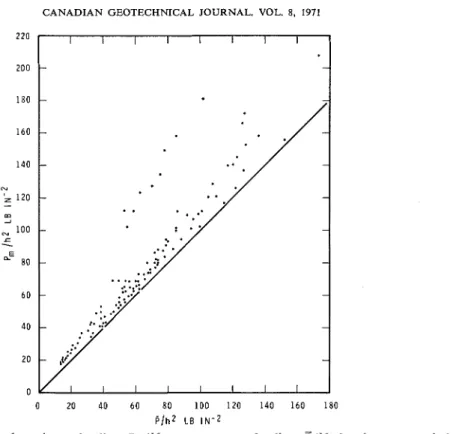
same period in Fig. 4.
Recommendations have been published on the thickness of natural ice required for a given load and vehicle configuration (Gold 1960; Assur 1956; Lagutin 1954). The recom- mended upper limit for loads to be placed on I I
ice of thickness, h, is given approximately by P = 100 h2.
Discussion
It is normal for a vertical section of an ice cover to be partly clear, transparent ice, and partly ice of whitish color due to air inclusions. The whitish opaque ice, can be formed by the natural flooding of snow on top of a clear ice sheet, or by flooding if the ice cover is,built up artificially to a desired thickness. The white ice has a lower strength than the transparent ice, and it has been the practice to assume that this ice has an effective thickness of only one-half its actual thickness. No studies have been undertaken to verify this assumption. The actual thickness of the cover was used, how- ever, when plotting Figs. l and 2, and when calculating the average and maximum loadings. This was done because usually no information is available on the relative amounts of clear and white ice when estimating the ice thickness required for a given load, or when placing
loads on covers. The proportion of white ice, furthermore, can vary from one position to another. It was considered also that, if the white ice is of good quality (density
>
0.88 g/cm2), other factors are more important and are primarily responsible for the significant overlap in the regions defined by the successful use and failures of ice covers in Figs. 1 and 2. Figure 5 presents information on the de- pendence on thickness of the characteristics length 1 for ice. This information was obtained from field observations of the author and others. It is seen that the equation[dl 1 = 40ha in.
provides a good fit to the observations. This corresponds to a value of
which is in good agreement with measured values of the elastic properties of ice.
It is clear from Eqs. [I], [2], and [3] that the stress at failure is not directly related to P/h2, as was tacitly assumed in presenting the results. Equations [ I ] and [3] were rearranged to the form:
CANADIAN GEOWCHNICAL JOURNAL. VOL. 8, 1971
FIG. 4. Plot of maximum loading, P , / h q versus average loading, H/h2, for the same period of observation. I I I 1 G O L D ET A L . 1 9 5 8 ,-, -
.
S T E V E N S A N D T I Z Z A R O 1 9 6 9.-.
.-.
/
0 R O T H L I S B E R G E R 1 9 6 8 A F R A N K E N S T E I N 1 9 6 3 ;1:A/ . . , o' . - - , -1 0 1 0 - 1 1 . 0 1 0 1 0 2 I C E T H I C K N E S S , I N C H E SFIG. 5. Dependence of the characteristic length, I, for ice covers on the thickness.
load P. B is plotted against ice thickness, h, in teristic length, I , was assumed to be given by Fig. 6 for various values of a, the radius of the Eq. [4]. It can be seen that for a given load load area. It was assumed that Poisson's ratio radius, B is not strongly dependent on ice had a value of 0.33, which is not unreasonable thickness over the range of thickness of prac- for ice subject to a dynamic load. The charac- tical interest ( e . g . , 20 to 60 in.).
GOLD: ICE COVERS FOR TRANSPORTATION 1 . 4 I I I I I I I I I I I
-
- - - - - I N F I N I T E P L A T E S E M I - I N F I N I T E P L A T E . E D G E L O A D 0 0 1 0 20 3 0 4 0 5 0 6 0 70 80 90 1 0 0 1 1 0 1 2 0 I C E T H I C K N E S S , I N C H E SRG. 6. Dependence of B on ice thickness in P = Ba,h2 for values of equivalent load radius a.
Figure 6 provides a general indication of the influence of load distribution and cracks on the bearing capacity. In practice, the load will not be applied uniformly over a circular area, but rather over a pattern determined by the type of wheeled or tracked vehicle. In theory, it would be possible to replace most actual load distributions by an approximately equivalent circular one. The radius of this equivalent area would probably be in the range of 25 to 100 in. for most vehicles of interest. The value of B, therefore, would be about 0.6 for the infinite plate case and 0.3 for the semi- infinite case, for ice thickness in the range of
10 to 30 in. These values for B, and the two curves bracketing the failure observations in Fig. 1 (i.e. P = 50 h h n d P = 1000 h2) give for the approximate range of the critical stress,
U, 80 to 3000 p.s.i.
A comparison of these values, even though approximate, with measured values for the tensile strength of ice indicates that the boundary conditions assumed for the calcula- tions are not always those associated with the failures. A uniaxial stress in the range given by the condition P = 50 h"i.e., u in the range
of 80 to 170 p.s.i.) will cause cracks to form in ice if applied for a sufficient length of time. It could cause a preexisting crack to propagate a short distance, but this propagation would be suppressed by the stress distribution associated with the bending of the ice cover. In general, contributing factors would be necessary to
cause continuous, good ice covers to fail under moving loads less than about P = 200 h2 (i.e.,
r in the range of 300 to 650 p.s.i.). P = 250 h2
defines approximately the upper limit that has been recommended in the literature for situa- tions where risk is acceptable (e.g. tanks in wartime).
Factors Affecting Bearing Capacity
Most of the failure and use observations were for trucks on unreinforced ice. The trucks varied from the normal 4- and 5-ton capacity type to semitrailers. Results of this survey, therefore, are applicable to this general load distribution. Attention was given in the study to factors, in addition to ice thickness, that affect the ability of ice to carry these loads. Vehicle Speed
When a vehicle travels over an ice cover, a hydrodynamic wave is set up in the underly- ing water. This wave travels with a speed that depends upon the depth of the water, the thick- ness of the cover, and the modulus of elasticity of the ice. If the speed of the vehicle coincides with that of the hydrodynamic wave, the deflec- tion of the cover due to the wave reinforces that due to the vehicle, increasing the maximum stress in the ice by a factor of about two and one-half. This problem has been considered by Assur (1961) and Wilson (1958).
Figure 7, reproduced from Assur (1961), gives the dependence of the vehicle speed on
GOLD: ICE COVERS E :OR TRANSPORTATION 177
Young's modulus, ice thickness, and vehicle depth. The graph is entered by specifying a value for Young's modulus on the scale MN. The intersection of this value with the relevant ice thickness curve gives a value for the param- eter ll. This particular value for ll is followed until it intersects the line giving the depth of water under the ice. The critical speed is ob- tained by moving horizontally from this inter- section to the critical speed axis. For most bearing capacity problems, the critical speed lies between 20 and 30 m.p.h.
The observations showed that vehicle speed was a factor for some of the failures. Particular caution must be exercised when approaching shore, or travelling close to it, because of more severe stressing of the cover due to reflections of the hydrodynamic wave. Vehicle speeds should always be strictly controlled when operating on ice. They should be maintained below 10 m.p.h. for ice covers about 30 in.
, thick.
Temperature
It was noted that several of the failures occurred after a marked drop in air temper- ature. Observers commented on the brittle be- havior of covers under this condition. This behavior may be due to the development of thermal stresses. A drop in air temperature would place the upper and lower surface of the cover in a transient state of tension, and the central region in compression. These stresses could be particularly serious in the vicinity of cracks. and in some cases thermal contraction may be sufficient to cause a crack to propagate completely through the cover.
It is of interest that some users of ice covers consider the ice to be safer if it has been worked by light-to-medium weight traffic prior to imposing the maximum allowable loads. The explanation for this may be that light traffic during the preparation of an ice surface may induce numerous relatively small cracks. As a result, thermal contraction due to drop in air temperature would be more uniformly distributed over the ice cover, and there would be a reduced probability for the contraction to cause a complete separation of the cover.
The strength of ice also increases with de- creasing temperature. Attempts have been made to take this into account by some investi- gators. Such a temperature correction is prob-
ably not justified for moving loads because of the more significant contribution of other factors, particularly thermal stresses. Addi- tional care must be taken, however, if the average daily air temperature rises above 30 O F (-1.1 OC). Suspension of operations
should be considered if the average daily air temperature exceeds 40 O F (4.4 OC), or if the
ice shows signs of deterioration and weakening. The effect of temperature on the strength of ice is a more significant factor for stationary loads.
Quality of the Cover
Remarks submitted with the reports on failure showed that many failures were caused by poor quality of ice. Other failures occurred when the vehicles left a prepared area and travelled on an unmodified ice cover. These incidents emphasize the need for close and continuous monitoring of the ice and control of traffic. Following are some of the comments that were submitted. "The truck backed off the built-up area and the rear wheels broke through the ice." "The tractor driver took a road that had just been prepared for light travelling, and broke through 3 in. of ice." "The right front wheel of the truck struck an air hole." "The vehicle broke through approxi- mately 100 ft from shore where the ice was 3 in. thick and covered with 6 in. of snow. Ice adjacent to the area was 7 to 9 in. thick." "The vehicle went down where the current was greatest, the ice in the adjacent area was 18 in. thick." "There were two layers of ice, each about 9 in. thick, with 2 in. of water in be- tween."
Several of the failures were probably asso- ciated with preexisting cracks (e.g., "only one wheel broke through"; "only the rear wheels went through"). Attention should be given to locating and marking large cracks, particu- larly those that intersect and those that pene- trate completely through the cover (i.e., are wet). It is considered that for a vehicle moving approximately perpendicular to a wet crack, the bearing capacity in the vicinity of the crack is only one-half of that for a continuous sheet (Fig. 6). The bearing capacity of the tip of a 90' sector is only about one-quarter that of the continuous sheet (Gold et al. 1958; Black 1958).
CANADIAN GEOTECHNICAL JOURNAL. VOL. 8, 1971
0
0 100 200 300 400
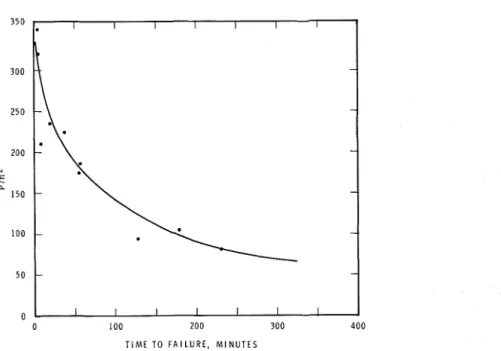
T I M E TO FAILURE. M I N U T E S
FIG. 8. Dependence of the time to failure on the loading A = P / h 2 (from Assur 1961).
teriorate because of fatigue (e.g., "thirty loads passed by the same spot earlier in the day without any indication of distress"). It is con- sidered good practice to make an unreinforced ice road or crossing of sufficient width so that the travelled path being used can periodically be alternated to allow recovery of fatigued regions.
Attention must be given to possible changes in water level. Some of the reported failures occurred near shore on ice that had been held up by the shore after a drop in water level. A rising water level can also be responsible for the formation of two ice layers with an intervening water layer.
The factors affecting the strength of ice covers that have been discussed are relatively more significant for thin ice than for thick ice. This is particularly true of the effect of tem- perature and temperature changes. The study on the use of ice covers by the pulp and paper industry brought out this point clearly, for the load in the majority of cases was placed on covers over 20 in. thick, whereas the majority of the failures that have been recorded during the whole study occurred for ice less than 20 in. thick.
Snow Cover
Snow applies an additional load to the cover. If a road or ice crossing is to be cleared of
snow, care must be taken not to place the snow in windrows adjacent to the road. Wind- rows can cause the cover to be depressed below water level, the ice to weaken beneath them, and cracks to form parallel to the pile of snow. If the cover is displaced below water level, flooding of the surface will occur which can seriously affect the use of a crossing. Wind- rows should be leveled out if their height is greater than two-thirds of the thickness of the ice. It is common practice in the preparation of storage areas for logs to saturate newly fallen snow with water when building up the thickness of the cover (Rose and Silversides 1958; Ager 1961). Existing snow covers may be compacted with rollers before flooding, or the snow may be compacted as it falls after an area of road has been prepared.
Static Loads
Ice is a viscoelastic solid. There appears to be a load above which the cover will con- tinuously deflect with time and ultimately fail. Meyerhof (196.2) has carried out a limit analysis of ice covers based on the theory of plasticity which is relevant to the static load problem. Assur (1961) presents some field observations giving the dependence of the time to failure of a cover on the loading, P/h2. These observations, reproduced in Fig. 8, indi- cate that the load should be less than that
GOLD: ICE COVERS F !OR TRANSPORTATION 179
defined by P = 50 h2 if it is to be stationary on the ice for more than 2 h.
Conclusions
The study has shown that good quality ice covers have been used successfully by wheeled and tracked vehicles exerting loadings of up to P = 250 h2, where P is the total load in pounds and h the thickness of the ice in inches. Failures have been observed for loadings as low as P = 50 h2. Factors contributing to the failure of covers for the values of loading less than P = 250 h2 are: vehicle speed, thermal stress due to drop in temperature, and fatigue and quality of the cover. Ice covers can be used safely for the transportation of loads, but traffic must be subject to close control at all times, and the covers checked daily for changes in thickness, formation of cracks, and evidence of change in quality, especially deterioration due to fatigue or high temperatures.
In Appendix A are presented case histories of the construction and use of ice crossings and parking areas.
Acknowledgments
The author wishes to express his gratitude to the several individuals and companies who assisted so willingly in the collection of the information presented in this paper.
This paper is a contribution of the Division of Building Research, National Research Council of Canada, and is published with the approval of the Director of the Division. AGER, B. H. 1961. Snow roads and ice landings.
Woodlands Sect. Pulp Paper Mag. Can. 62, pp. 137-138, 140-141, 143-146, 148.
Assm, A. 1956. Airfields on floating ice sheets. Cold Reg. Res. Eng. Lab., U.S. Corps Engs., Hanover, N.H. Rep. 36, p. 24.
1961. Traffic over frozen or crusted surfaces. Proc. 1st Int. Conf. Mechs. Soil-Vehicle Syst. Torino, Saint Vincent. pp. 913-923.
BLACK, L. D. 1958. Relative strength of plates on elastic foundations. Trans. Eng. Inst. Can. 2, pp. 129-131.
FRANKENSTEIN, G. E. 1963. Load test data for lake ice sheets. Cold Reg. Res. Eng. Lab., U.S. Corps Engs., Hanover, N.H. Tech. Rep. 89, p. 14. GOLD, L. W., BLACK, L. D., TROFIMENKOFF, F., and
MATZ, D. 1958. Deflection of plates on elastic foundations. Trans. Eng. Inst. Can. 2, pp. 123- 130.
GOLD, L. W. 1960. Field study on the load bearing capacity of ice covers. Woodlands Rev., Pulp Paper Mag. Can. 61, pp. 153-154, 156-158.
LAGUTIN, B. L. (editor) 1954. Data on the problem of ice crossings. Trudy nauchno-issledovatel'skikh uchrezhdeniy seriya 5, Vyp. 20, Moscow, 1946.
Translated by Arctic Constr. Frost Effs. Lab. New Engl. Div., U.S. Army Corps Engs. p. 121. MEYERHOF, G. G. 1962. Bearing capacity of floating ice sheets. Trans. Amer. Soc. Civil Eng. 127, Pt. 1, pp. 524-581.
NEVEL, D. E. 1961. The narrow free infinite wedge on an elastic foundation. Cold Reg. Res. Eng. Lab., U.S. Corps Eng. Hanover, N.H. Res. Rep. 79, p. 24.
ROSE, L. B., and SILVERSIDES, C. R. 1958. The preparation of ice landings by pulp and paper companies in eastern Canada. Trans. Eng. Inst. Can. 2, pp. 101-107.
WESTERGAARD, H. M. 1948. New formulas for stresses in concrete pavements of airfields. Trans. Am. Soc. Civil Eng. 113, pp. 425-444.
WILSON, J. T. 1958. Moving loads on floating ice sheets. Univ. Mich. Res. Inst. Project 2432, Final Rep. p. 24.
WYMAN, M. 1950. Deflections of an infinite plate. Can. J. Res. A, 28, pp. 293-302.
Appendix A
Construction of Ice Crossings and Parking Areas
Following are brief summaries of descrip- tions of the construction of ice roads and parking areas received during the survey. Bridge Erection
The thickness of the ice was increased from 24 to 52 in. or more by flooding. No reinforce- ment was used. A minimum thickness of 48 in. occurred over the main river channel which was about 60 ft wide and 14 ft deep.
The heaviest load applied was a 60-ton crawler crane. In the area with 52 in. of ice, this crane lifted a maximum load of 34 tons. The bearing area of the crane was two 16 ft by 33 in. treads. Slight hairline cracks appeared about 2 ft from the crane and parallel to the treads when it moved over the ice 48 in. thick. Other crossings, averaging three per day, were made with machines weighing 40 to 50 tons.
The flooding of the ice was done when the maximum temperature during the day was 0 to 20 O F (-18 to -7 OC). Operations on the
cover were carried out during a period when the daytime temperatures ranged from 30 to 40 O F (-1 to 4 OC), and the nighttime from
15 to 20 O F (-9 to -7 OC). Over the 2-week
period of operations, about 6 in. of ice was eroded away by the river, the major part of this
180 CANADIAN GEOTECHNIC :AL JOURNAL. VOL. 8, 1971
wear occurring after the heavy lifting was com- pleted.
Reinforced Ice Crossing
The bridge was constructed at a site where the river is about 1400 ft wide, the water depth about 6 ft, and the current 1 to 2 m.p.h. A 250-ft-wide route was cleared across the river when the ice was 12 to 18 in. thick.
A 150-ft-wide roadway was flooded to level out the surface. Small logs, 8 to 12 in. in diameter, were placed diagonally across the bridge at 2-ft centers to form a 25-ft-wide road surface. The ice was built up by flooding until the average thickness of the roadway was about 60 in.
The ice )bridge was used for 8 weeks to transport about 19 000 tons of freight. The heaviest load was a truck and tractor weighmg 13 1 tons. Regular checks were made on the condition of the bridge to ensure that no weak areas were present.
Unreinforced Ice Crossing
The width of the river at the site of the crossing was 3800 ft, and the current was about 3 m.p.h. The initial cover was formed by the jamming together of ice floes from a lake upstream. When the minimum thickness was 12 in., the rough surface was smoothed with a tractor weighing about 4 tons. A motor patrol was used to blade and pack snow over a width of 100 ft. It was considered that early clearance and compaction of snow, along with flooding of thin sections only, was adequate to provide a suitable crossing. This was used by cars and trucks until 13 February, with a maximum load of about 30 tons. On the 13th of February a haul began which involved moving a total of 26 000 tons of gravel. The trucks used were Mack Tandem Model 42B, with a gross weight of 25 tons. They travelled at speeds between 10 to 20 m.p.h.
The loaded trucks moved from south to north. Shortly after the haul began, longitudinal cracking occurred in the center of the truck lane. At the north end of the road, where the ice thickness was about 40 in., the road surface became highly cracked after 10 days. The cover still supported the loads, although the deflection was 5 to 6 in. Boring showed that the cracks extended to within 10 in. of the bottom. When the holes were drilled com-
pletely through the cover, the cracked area became flooded with water, which subsequently froze. No further difficulty was experienced thereafter. It was considered that the longi- tudinal cracks formed because of tensile stresses induced by the buoyancy force de- veloped 'by the increased ice thickness at the crossing. The cracking of the surface at the north side, however, may have been due in
part to reflection of the hydrodynamic wave I b
that would occur as a vehicle approached the shore.
The heaviest load to use the crossing was a a* lowbed trailer carrying a 40-ton shovel, the
gross load being 60 tons. The minimum ice thickness at this time was 46.5 in.
Ice thickness and air temperature were measured daily, and observations were made of cracks. Cracks were observed to form when the temperature dropped; their width did not exceed 2 in. No cracks penetrated completely through the cover.
It is planned to construct this crossing each winter. It was recommended that two 50-ft lanes be constructed, one for southbound and one for northbound traffic, separated by 150 ft. The roads should turn on the approaches so that the ice deflection caused by the vehicles would not be reinforced by the reflection of the hydrodynamic wave. It was also recom- mended that the speed limit of vehicles of gross weight greater than 10 tons should be 10 m.p.h., the minimum allowed spacing be- tween vehicles be 800 ft, and that vehicles should not be allowed to overtake one another under any circumstance. A daily inspection of ice conditions should be carried out, with special attention at the time the crossing is opened, and prior to spring breakup.
Reinforced Ice Crossing
When the ice was 28 in. thick, three l+-in. steel cables of 60-ton breaking strength were t
laid and anchored at each shore. Logs were placed across the three cables and frozen into
position. The pumping of water onto the cross- I ing was continued until the total thickness was
52 in. Snow was removed from the adjacent cover over a width of 50 to 100 ft on both sides.
1185 vehicles of gross weight less than 15 tons, 2034 of gross weight between 15 to
GOLD: ICE COVERS FOR TRANSPORTATION 181
25 tons, and 52 of gross weight between 25 to 50 tons, used the crossing over the period 16 January to 15 April. The maximum load was 50 tons.
Reinforced Ice Crossing
The bridge was constructed at a site where the river was about 360 ft wide; water depth beneath the cover was about 7 ft for one-half the width, and greater than 15 ft for the remainder.
Four layers of logs, 8 to 10 in. in diameter, were frozen into the ice. The first layer was placed crosswise, the second lengthwise, the third crosswise and the fourth lengthwise. The logs were frozen in as laid at a spacing of about 4 ft between centers.
The width of the reinforced area was 30 ft, and the total thickness about 5 ft. Twenty-five- foot strips on either side of the reinforced area
were flooded so that the width of the built-up crossing was about 80 ft. A hole drilled 28 ft from the center line and 45 ft from shore indicated 50 in. of solid ice and 5 in. of weak ice near the surface. One hundred and ten fee't from shore and 28 ft from the center line there was 58 in. of good ice. The water rose to the top of these test holes. The maximum thickness of the natural ice was about 24 in.
A tower-erecting crawler crane weighing 100 tons was moved over the crossing. The crane was supported on four tracks, 13.5 ft long and 4.5 ft wide. The distance between the center lines of the tracks was 7.5 ft along the width of the crane and 20.5 ft along the length. Con- tact pressure under the tracks was 6 p.s.i. No cracking was heard as the crane travelled over the ice.
The crossing was used regularly for carrying loads of up to about 50 tons.